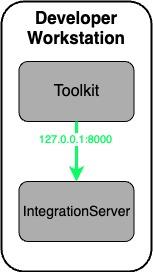
Occasionally a flow that has been deployed in containers doesn't behave as expected. As a result of this you may need to run the visual debugger and step through the flow to understand what the root cause of the error is. To be able to achieve this there are a few extra steps required when ACE is deployed in containers / via the operator. This blog will cover the steps required to enable it.
The Challenge
When there is a need to debug issues with flows running in Kubernetes, your preferred option should be to recreate that issue on an integration server on a developer workstation and use the debugger locally.

The Solution
Fortunately, the Kubernetes command line includes a port forwarder that allows you to create a secure tunnel from your developer workstation into the cluster’s private network. Using this, you can connect the flow debugger to the runtime securely without the need to expose the debug port on the public network.
One of the questions we often receive is how we connect the toolkit or view the WebUI using the same mechanism so we can make changes to our deployments. This is something we do not recommend because the containers are designed to be declarative, pods are liable to be restarted for many reasons such as worker updates etc and we need to make sure that the state before the restart is the state after restart and thus why its defined in a declarative way. To view what's running on the runtime please use the Dashboard operand which is optimised to connect to runtimes running in containers.
Connecting the Toolkit debugger to the runtime
Configure the Integration Server to listen on the jvmDebugPort
To enable the runtime to list for connections an update to the server.conf.yaml needs to be made. This can be done by creating a server.conf.yaml configuration of type serverconf. Create a configuration with the following yaml and then add it to your IntegrationRuntime under `spec.configurations`
spec:
  ResourceManagers:
    JVM:
     jvmDebugPort: 80000
Attaching this configuration will result in an update to your runtime pod. Once the CR has moved out of "Updating" status check the pod logs of your runtime and you should see a log output such as
Listening for transport dt_socket at address: 8000
Run Port Forwarder
The next step is to start the port forwader so that a local port on your laptop is connected to a port inside the container. First you must find the pod that is running your integration. This pod will have the name <CRName>-ir-xxxxxxxxxx-xxxx . If you have multiple replicas we recommend scaling your runtime down to a single pod to ensure that when you process the message it goes through the runtime your debugger is connected to.
You can either use kubectl or oc CLI. The syntax is identical.
oc port-forward <your-pod-name> -n <namespace> 8000:8000
You should see the following response
Forwarding from 127.0.0.1:8000 -> 8000
Forwarding from [::1]:8000 -> 8000
Connect flow debugger
- Open your App Connect Enterprise Toolkit and go to the Debug Perspective.
- On the window menu bar, click Run > Debug Configurations.
- Right click on “IBM App Connect Enterprise Debug” and then select “New”.
- Provide a sensible name for this new configuration
- Set Host Name to
127.0.0.1
- Set Java Debug Port to
8000
- Finally, click “Apply” and the “Debug” and you should see the debugger being attached.