UPDATE: Since the release of the App Connect Operator version 10.0.0 (including from Cloud Pak for Integration 2023.4.1 onwards) the use of the Grafana Dashboard is no longer supported, as IBM Cloud Pak foundational services no longer supplies Grafana. We would instead recommend setting up Grafana or an alternative on your cluster and setting up your own monitoring views for App Connect using the available metrics.
When running production workloads, metrics are vital for monitoring the health and efficiency of the integrations that drive your business. Is that integration running? Is it performing as well as expected? When running the App Connect Operator in OpenShift, your integration servers are running in containers that consume CPU and memory, and the tools in OpenShift - or other Kubernetes-based options - can help you keep track of that. However, there is more data available about what's going on in your integration, specific information around App Connect Enterprise activity, such as the number of message flows processed, or the number of errors encountered, that can be enabled.
Enabling native OpenShift Monitoring
The OpenShift console includes a built-in Observe section (called Monitoring before OpenShift 4.9) with a Metrics view, which is configured by default to provide data such as CPU and memory usage for all the pods running in the selected project (namespace).
However, while this view displays information about the pods, it does not by default include information from inside the pods. To get this data, you need to enable monitoring for user-defined projects in OpenShift by adding the following ConfigMap if it does not already exist:
apiVersion: v1
kind: ConfigMap
metadata:
name: cluster-monitoring-config
namespace: openshift-monitoring
data:
config.yaml: |
enableUserWorkload: true
If the ConfigMap already exists, maybe because you've enabled monitoring for other applications you have deployed, you do not need to make any changes for the App Connect Operator.
With monitoring enabled, you will see data from App Connect Enterprise integration servers appearing in the Metrics view above after deployment. The emission of metrics is enabled by default when creating an IntegrationServer CR, but you can disable it with this setting:
spec:
  enableMetrics: false
And you can re-enable metrics by setting the value to true (the default value).
Building metrics queries
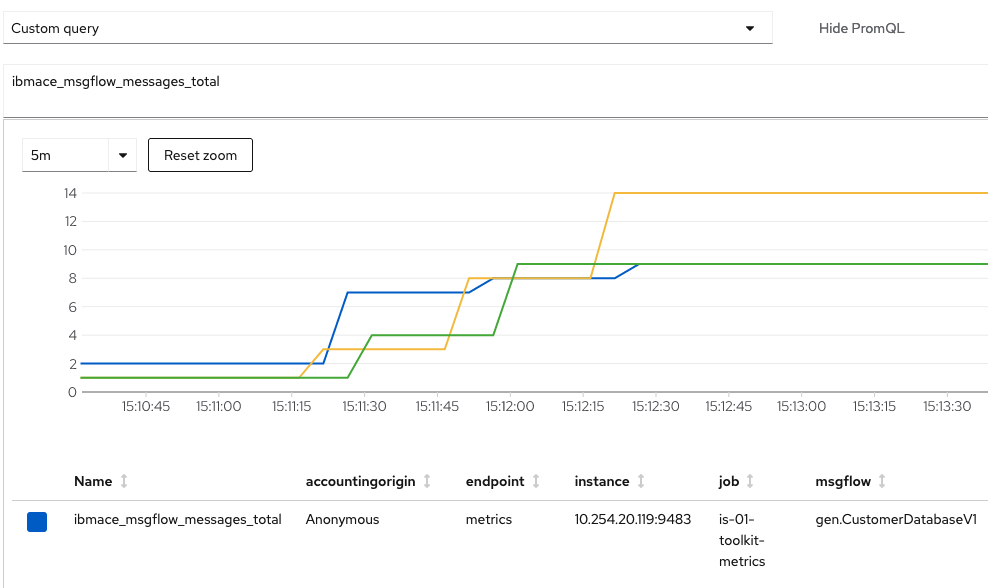
When you have a running integration server, you can go to the Metrics view and select Custom query to build your own queries using the App Connect Enterprise metrics data; all the metrics use an ibmace_ prefix, and the full list of available metrics you can use is in our documentation, although you will see suggestions when you start typing your query. The queries are constructed in a language called PromQL, which may be familiar to anyone who uses Prometheus, and can be as simple as using a desired metric. For example, ibmace_msgflow_messages_total:

You can also apply filters if you want to limit your query to a specific parameter. For example,
ibmace_msgflow_messages_total{server="is-01-toolkit"} to show metrics for only one named integration server:
Or you can alter the values if you want to re-scale them. For example, turning the number of bytes into megabytes,
ibmace_jvm_heap_user_memory_bytes/(1024*1024):
You can also apply functions to the query, or combine multiple metrics in the same query. After you've enabled metrics, there is a lot of scope in PromQL to produce the metrics that you need to monitor your integration activity with the integration server data.
Using the Grafana dashboard with IBM Cloud Pak foundational servicesAs well as supporting the native OpenShift metrics, the App Connect Operator also supports the monitoring stack in IBM Cloud Pak foundational services (previously called Common Services). This is an instance of Grafana that uses the same data we enabled above, and allows you to create reusable dashboards containing multiple graphs using the available metrics.
This monitoring stack is already enabled if you've created an instance of the Platform UI with the IBM Cloud Pak for Integration operator. If you're not using the Cloud Pak,
you'll need to request the Monitoring service by creating an OperandRequest, and can do so by supplying the following YAML either via the OpenShift console or via the command line:
apiVersion: operator.ibm.com/v1alpha1
kind: OperandRequest
metadata:
name: common-service
namespace: ibm-common-services
spec:
requests:
- operands:
- name: ibm-monitoring-grafana-operator
registry: common-service
You should do this before creating your App Connect Dashboard as doing so will allow the Operator to detect that monitoring is available and publish a pre-configured "IBM App Connect Enterprise" Grafana dashboard.
If you're using an App Connect Dashboard with one of the "CloudPakForIntegration" licenses (you'll have "IBM Cloud Pak" on the top bar of your Dashboard), you can access the Monitoring service from the menu in the upper-left corner of the banner by clicking Administration > Integration instances to view the list of integration instances. Then open the options menu for your Dashboard and click Monitoring. This will take you to Grafana, and will select the right namespace and load the "IBM App Connect Enterprise" Grafana dashboard ready for use.
When you are in Grafana, you will need to select the namespace (OpenShift project) that your Dashboard has been deployed to by using the menu in the lower-left corner of the navigation pane. Then open the
Dashboards menu from the navigation pane, click
Manage, and then select the "IBM App Connect Enterprise" Grafana dashboard that was installed for you when your App Connect Dashboard instance was deployed.
The Grafana dashboard gives a number of pre-configured graphs and other data sets to monitor the activity of the integration servers running in that OpenShift project, and can be customized to show the information you want, and saved to view later. You can also construct your own dashboards using the metrics mentioned earlier, or use Grafana to set up alerting for system admins or others who need to keep an eye on the traffic flowing through your integration servers.