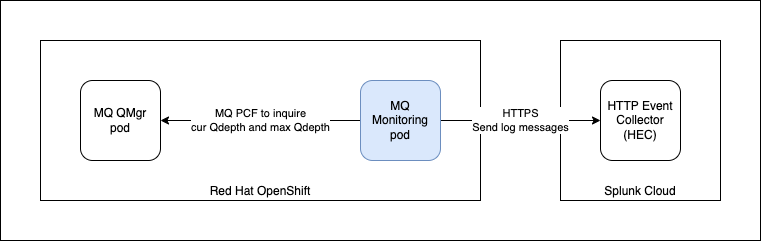
This article shows an approach to monitoring the current queue depth in relation to the max queue depth. If the current queue depth reaches a set of pre-defined thresholds, send a log message to Splunk Cloud. The diagram below shows a queue manager deployed on Red Hat OpenShift. I have an MQ monitoring pod that periodically inquires about the current queue depth and a maximum queue depth of an MQ queue manager. If it exceeds a threshold (red or amber), the MQ monitoring pod will send a log message to the Splunk Cloud via the HTTP Event Collector (HEC).
The implementation of the MQ Monitoring is in this repository. The details on how to use this is documented in the README.md.
Before we start, we need to register for Splunk Cloud. Once register, you need to add an HTTP Event Collect (HEC) - by navigating to Settings > Data inputs. You are going to use token value when we send a message to the HEC.

I will explain a few key aspects of the code.
- There is a Run Loop at periodically inquires about the attributes of the queue (current queue depth and maximum queue depth). Before the Loop starts, it tries to connect to the queue manager. Then it uses MQ Programmable Command Formats (PCF) to inquire about the attributes of the queue. You can configure the monitor period using a config map.
	public void run(String... args) throws Exception {
		log.info(mqProperties.toString());
		log.info(splunkProperties.toString());
		log.info(monitorProperties.toString());
		// MQQueueMonitor monitor = new MQQueueMonitor();
		monitor.connect();
		for(;;) {
			log.info("Start monitoring");
			monitor.doPCF();
			try { Thread.sleep(monitorProperties.getPeriod().intValue()*1000); } catch(Exception e) {}
		}
	}
- The main logic is located in the MQQueueMonitor class, which has the connect() method and doPCF() method. Let's look at the connect() method. It takes the parameters (channel name, hostname, port, queue manager name) needed to connect to an MQ queue manager (will explain later how it is passed in) and put them into a hashtable. It first creates an MQQueueManager object and from then the PCFMessageAgent object. We will use the PCFMessageAgent to send PCF commands to the queue manager.
    public void connect() {
		log.info("connect: " + mqProperties.toString());
        log.info("connect: " + splunkProperties.toString());
        log.info("connect: " + monitorProperties.toString());
        try {
            Hashtable<String,Object> mqht = new Hashtable<String, Object>();
            mqht.put(CMQC.CHANNEL_PROPERTY, mqProperties.getChannelName().toString());
            mqht.put(CMQC.HOST_NAME_PROPERTY, mqProperties.getHostname());
            mqht.put(CMQC.PORT_PROPERTY, mqProperties.getPort().intValue());
            mqht.put(CMQC.USER_ID_PROPERTY, mqProperties.getUser());
            mqht.put(CMQC.PASSWORD_PROPERTY, mqProperties.getPassword());
            queueManager = new MQQueueManager(mqProperties.getQueueManagerName()+"", mqht);
            //queueManager = new MQQueueManager("QMLAB1", mqht);
            log.info("MQQueueManager created: " + queueManager.getName());

            agent = new PCFMessageAgent(queueManager);
            log.info("PCFMessageAgent created");
            reconnect = false;
        }
        catch (MQException mqe) {
            mqe.printStackTrace();
            log.error("MQException: CC=" + mqe.completionCode + " : RC=" + mqe.reasonCode + " Msg=" + mqe.getLocalizedMessage());
        }
        catch (MQDataException mqde) {
            log.error("MQDataException: CC=" + mqde.completionCode + " : RC=" + mqde.reasonCode);
        }
    }
- In the doPCF() method, we create a PCFMessage to "Inquire the Queue". We need to add parameters to specify the Generic Queue Name (you can use an asterisk to filter a list of queues you want to inquire about, e.g. "*TEST" ) and the queue type (e.g. Local queue only). We also specify the attributes of the queue we want to inquire about (e.g. queue name, current queue depth and maximum queue depth). Finally, we use a filter for the queues that we are interested in (which are queues that have at least one message). The PCF request command will result in a list of PCF messages as a response. Each of these messages is a queue (with the attributes) that has at least one message. For each of these queues, we will check its current queue depth against a threshold (Red and Amber) that we specified - and send the (Info, Warning, Error) message to Splunk. There is a simple recovery logic here, when we have a connection error, the method will try to do a reconnection.
    public void doPCF() {
        if(reconnect) {
            connect();
        }
        try {
            // https://www.ibm.com/docs/en/ibm-mq/9.3?topic=formats-mqcmd-inquire-q-inquire-queue
            PCFMessage request = new PCFMessage(CMQCFC.MQCMD_INQUIRE_Q);
            // Add generic queue name. E.g. *TEST
            request.addParameter(CMQC.MQCA_Q_NAME, mqProperties.getGenericQueueName());
            // Add parameter to request only local queues
            request.addParameter(CMQC.MQIA_Q_TYPE, CMQC.MQQT_LOCAL);
            // Add parameter to request only queue name, current depth and max depth
            request.addParameter(CMQCFC.MQIACF_Q_ATTRS, new int [] {
                CMQC.MQCA_Q_NAME,
                CMQC.MQIA_CURRENT_Q_DEPTH,
                CMQC.MQIA_MAX_Q_DEPTH
            });
            // Add filter to only return responses with a queue depth greater than 0 (zero) i.e. non-zero queue depth
            request.addFilterParameter(CMQC.MQIA_CURRENT_Q_DEPTH, CMQCFC.MQCFOP_GREATER, 0);
            PCFMessage[] responses = this.agent.send(request);

            for (int i = 0; i < responses.length; i++) {
                if ( ((responses[i]).getCompCode() == CMQC.MQCC_OK) &&
                     ((responses[i]).getParameterValue(CMQC.MQCA_Q_NAME) != null) ) {
                    String name = responses[i].getStringParameterValue(CMQC.MQCA_Q_NAME);
                    if (name != null) {
                        name = name.trim();
                    }
                    int curDepth = responses[i].getIntParameterValue(CMQC.MQIA_CURRENT_Q_DEPTH);
                    int maxDepth = responses[i].getIntParameterValue(CMQC.MQIA_MAX_Q_DEPTH);
                    log.info("Name="+name + " : curDepth=" + curDepth + ", maxDepth=" + maxDepth + ", thresholdRed: " + monitorProperties.getThresholdRed().floatValue() + ", thresholdAmber: " + (float)monitorProperties.getThresholdAmber().floatValue());
                    if (curDepth == maxDepth) {
                        String message = "Error: Name="+name + " : current depth equals max depth ["+maxDepth+"]";
                        log.error(message);
                        sendToSplunk(message);
                    } else if (curDepth >= (maxDepth * monitorProperties.getThresholdRed().floatValue())) {
                        String message = "Warning: Name="+name + " : current depth ["+curDepth+"] is within " + monitorProperties.getThresholdRed().floatValue()*100+ "% of max depth ["+maxDepth+"]";
                        log.warn(message);
                        sendToSplunk(message);
                    } else if (curDepth >= (maxDepth * monitorProperties.getThresholdAmber().floatValue())) {
                        String message = "Info: Name="+name + " : current depth ["+curDepth+"] is within " + monitorProperties.getThresholdAmber().floatValue()*100 + "% of max depth ["+maxDepth+"]";
                        log.info(message);
                        sendToSplunk(message);
                    }
                }
            }

        } catch(IOException ioe) {
            log.error("IOException:" +ioe.getLocalizedMessage());
            reconnect = true;
        } catch (PCFException pcfe) {
            log.error("PCFException: CC=" + pcfe.completionCode + " : RC=" + pcfe.reasonCode);
            reconnect = true;
        } catch (MQDataException mqde) {
            log.error("MQDataException: CC=" + mqde.completionCode + " : RC=" + mqde.reasonCode);
            reconnect = true;
        }
    }
- There is a private method aptly named sendToSplunk() to send log messages to Splunk via HTTP Event Collector (HEC). To simplify implementation for the sample code, we disabled hostname verification and disabled TLS verification (passing in an empty SSLContext). You just need to obtain the Splunk token and HEC endpoint from SplunkCloud. We send the Splunk token in the Authorization header with the value ("Splunk " + Token).
    private void sendToSplunk(String message) {
        try {
            final Properties props = System.getProperties();
            props.setProperty("jdk.internal.httpclient.disableHostnameVerification", Boolean.TRUE.toString());

            String jsonBody = "{\"event\": \"" + message + "\"}";
            log.info(jsonBody);
            HttpRequest request = HttpRequest.newBuilder()
                        .uri(new URI(splunkEndpoint))
                        .headers("Authorization", splunkAuthorization)
                        .headers("Content-Type", "application/json")
                        .POST(HttpRequest.BodyPublishers.ofString(jsonBody))
                        .build();
            HttpClient client = HttpClient.newBuilder()
                .sslContext(this.sslContext)
                .build();
            HttpResponse<String> response = client.send(request, BodyHandlers.ofString());
            int statusCode = response.statusCode();
            if (statusCode == 200 || statusCode == 201) {
                log.info("Send to Splunk successful");
            } else {
                log.error("Send to Splunk error: " + statusCode);
            }

        } catch (URISyntaxException urie) {
            log.error("URISyntaxException: Error: "  + urie.getLocalizedMessage());
            urie.printStackTrace();
        } catch (IOException ioe) {
            log.error("IOException: Error: "  + ioe.getLocalizedMessage());
            ioe.printStackTrace();
        } catch (InterruptedException ie) {
            log.error("InterruptedException: Error: " + ie.getLocalizedMessage());
            ie.printStackTrace();
        }
    }
- There is a pom.xml for us to build the jar file, and Dockerfile for us to build the image.
- There is also a deploy.yaml file which we will explain more. There is a ConfigMap where you specify the parameters in the fields. These fields are mapped to ENV variables. In Spring Boot, these ENV variables are mapped to the properties defined in the application.properties file. We just dependencies injection capabilities of Spring Boot (@Autowired) to populate the class variables of the object. The deploy.yaml also contains a Deployment that specifies the location of the image that will be pulled. We need to push our image to our preferred image registry (I used docker.io).
apiVersion: v1
kind: ConfigMap
metadata:
  name: mqmonitor-configmap
  namepsace: mq
type: Opaque
data:
  mqQueueManagerName: SMALLQM
  mqHostname: smallqm-ibm-mq.mq.svc.cluster.local
  mqPort: "1414"
  mqChannelName: SMALLQMCHL_NOTLS
  mqGenericQueueName: "*"
  monitorPeriod: "60"
  monitorThresholdRed: "0.9"
  monitorThresholdAmber: "0.5"
---
apiVersion: apps/v1
kind: Deployment
metadata:
  name: mqmonitor
  namepsace: mq
  labels:
    app: mqmonitor
spec:
  replicas: 1
  selector:
    matchLabels:
      app: mqmonitor
  template:
    metadata:
      labels:
        app: mqmonitor
    spec:
      containers:
        - name: mqmonitor
          image: docker.io/koksing/mqmonitor:1.0.0
          imagePullPolicy: Always
          resources:
            requests:
              memory: "512Mi"
              cpu: "250m"
            limits:
              memory: "1024Mi"
              cpu: "500m"
          env:
            - name: SPLUNK_TOKEN
              valueFrom:
                secretKeyRef:
                  name: mqmonitor-secret
                  key: splunkToken
            - name: SPLUNK_ENDPOINT
              valueFrom:
                secretKeyRef:
                  name: mqmonitor-secret
                  key: splunkEndpoint
            - name: MQ_QUEUEMANAGERNAME
              valueFrom:
                configMapKeyRef:
                  name: mqmonitor-configmap
                  key: mqQueueManagerName
            - name: MQ_HOSTNAME
              valueFrom:
                configMapKeyRef:
                  name: mqmonitor-configmap
                  key: mqHostname
            - name: MQ_PORT
              valueFrom:
                configMapKeyRef:
                  name: mqmonitor-configmap
                  key: mqPort
            - name: MQ_CHANNELNAME
              valueFrom:
                configMapKeyRef:
                  name: mqmonitor-configmap
                  key: mqChannelName
            - name: MQ_GENERICQUEUENAME
              valueFrom:
                configMapKeyRef:
                  name: mqmonitor-configmap
                  key: mqGenericQueueName
            - name: MONITOR_PERIOD
              valueFrom:
                configMapKeyRef:
                  name: mqmonitor-configmap
                  key: monitorPeriod
            - name: MONITOR_THRESHOLDRED
              valueFrom:
                configMapKeyRef:
                  name: mqmonitor-configmap
                  key: monitorThresholdRed
            - name: MONITOR_THRESHOLDAMBER
              valueFrom:
                configMapKeyRef:
                  name: mqmonitor-configmap
                  key: monitorThresholdAmber
- Finally, there is also a secret.sample.yaml that you need to specify the Splunk token and Splunk endpoint. This will be mapped to ENV variables in the same way as ConfigMaps. The value needs to be in base64 encoded. There is a "funny" problem, there is a trailing newline character in the value that needs to be stripped.
---
apiVersion: v1
kind: Secret
metadata:
  name: mqmonitor-secret
  namepsace: mq
type: Opaque
data:
  splunkToken: xxxxxxxx-xxxx-xxxx-xxxxxxxxxxxxxxxxx (base64)
  splunkEndpoint: https://xxx-x-xxxxx.splunkcloud.com:8088/services/collector/event (base64)
  #mqUser: "mqadmin"
  #mqPassword: "xxxxxxxxx"
In conclusion, this is show the message looks like in Splunk Cloud.

References:
- Simple Monitoring of the Current Queue Depth (click here) - I adapted the code here into a SprintBoot microservice.
- Monitoring IBM MQ queue depth in Cloud Pak for Integration (click here)
- Different ways to get the Current Depth (CURDEPTH) for a queue in an MQ queue manager_3.pdf (click here)
#Spotlight
#automation-featured-area-2