IBM DataPower Web Services Management Agent provides excellent out-of-the-box capabilities for monitoring your transactions and integrating with external monitoring and log management platforms. Although the DataPower documentation describes the steps to enable the functionality and provides samples for the different types of subscriptions there aren't that many how-to guides available.The purpose of this blog post is to show how to configure the Web Services Management Agent, create a pull subscription and integrate the agent with a commercial monitoring product.
Step 1: Enabling the Web Services Management Endpoint
The Web Services Management endpoint setting can be found from default domain under XML Management Interface. Verify that the check box is selected and then click Cancel or if not selected click the check box and then apply and save the config.
Step 2: Enable domain Web Services Management Agent
The second step is to enable the domain specific management agent. Change to the domain that contains the services that you want to monitor and navigate to the Web Services Management Agent settings.

Change the state to enabled and define the configuration parameters that are suitable for your needs. For demonstration purposes I'll set the capturing of all messages on and buffering mode (which is by the way deprecated) to buffer so that the records are stored even if my example subscription should time out. Then apply and save the configuration changes.
Step 3: Configure your proxy service
The next step is to configure the service specific parameters. An example for a Multi-Protocol Gateway is shown in the picture below. We'll capture all messages for demonstration purposes (this comes with a performance penalty).
All the steps from one to three are straight from IBM Knowledge Center and can be easily defined using the basic documentation. So let's go to the bits that are not directly available in the documentation....
Step 4: Verify/define your monitoring endpoint
This chapter describes the steps that you'll need to perform in order to ensure that your monitoring service has an endpoint which can be used to receive the events that the DataPower monitoring agent emits. Obviously the steps vary depending on the monitoring product that you are using but as an example I'll show the configurations related to Splunk Enterprise V8.
We'll be using a Splunk HTTP Event Collector (HEC) for receiving the events so lets create a new data input. First navigate to
Settings and select
Data Inputs.
Create a new HTTP Event Collector by clicking Add New.
Next, fill in the basic information. Example is shown below.
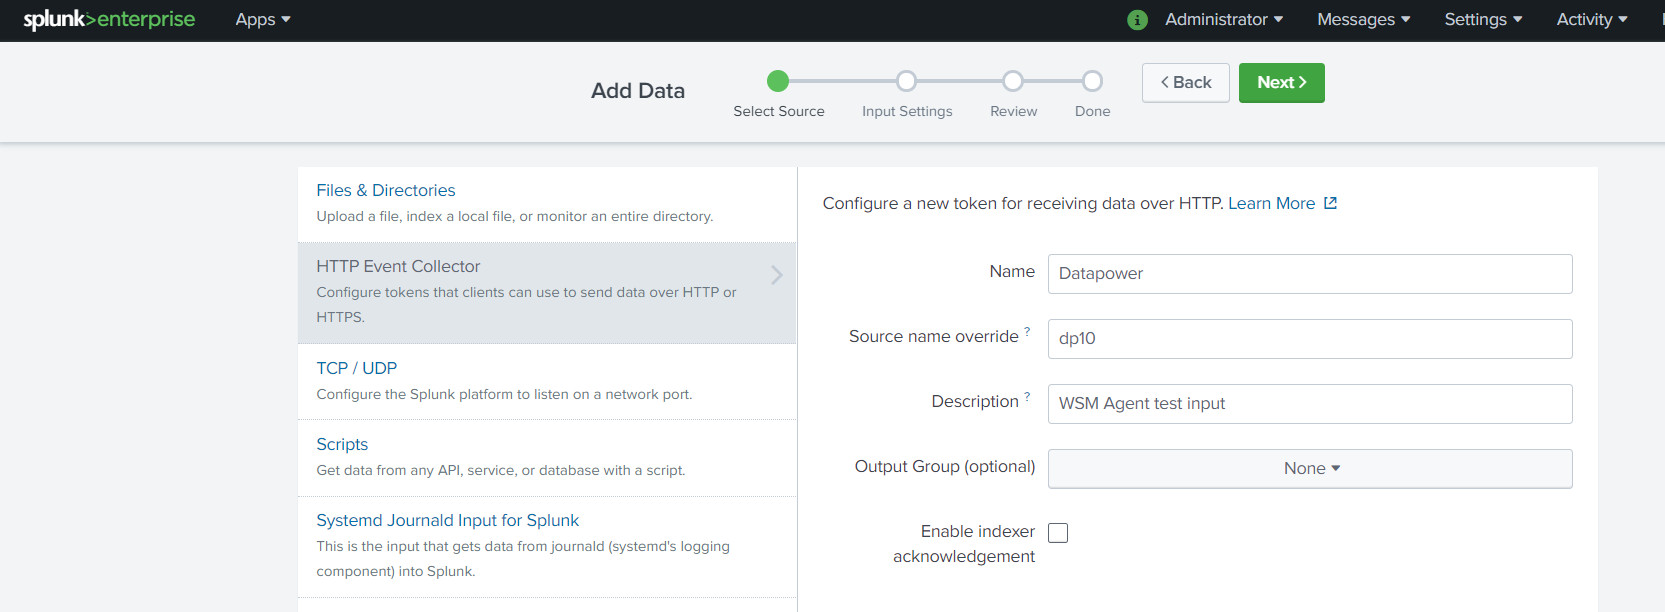
Next fill in the settings for sourcetype and indexes. These configurations are very relevant so fill them carefully. Lets select the sourcetype as
_json because even though the DataPower events come in as SOAP, we'll modify them on the fly to match the JSON format expected by the Splunk endpoint. After filling in the correct values, review and save the configuration.

After creating a new HEC input you'll have to verify that all the tokens are enabled and what are the port number and SSL settings of the HEC endpoint. From the HTTP Event Collector page open Global Settings and verify the values according the picture below.

Step 5: Create a subscription
Now that we have the connection details related to the monitoring endpoint we can create a subscription for consuming the events emitted by the DataPower. The "problem" that we first have to address is the fact that the Web Services Management Agent push subscription isn't strictly fire-and-forget even though it doesn't require acknowledgements following any specification. The DataPower agent expects to receive a SOAP response (any kind of SOAP response is ok, SOAP fault is not ok) and if your monitoring endpoint support SOAP request-response pattern you are good to go. Unfortunately, because I am using Splunk HEC endpoint to consume the monitoring events, the monitoring events and related responses are expected to be JSON messages so I have to modify the messages somewhere in the middle. There are multiple ways to achieve this, for example creating a custom input for Splunk, but because this blog post is about DataPower lets use a simple XML Firewall to do the trick.
Assuming that creating a new XML Firewall is a familiar process I am not going to include any screen captures of the steps. Please see the export of the XML FW that is included as an attachment to the end of this blog post. To summarize the processing policy follows the steps presented in the picture below.

In addition to setting up the proxy and the processing flow presented above we also need to add a client TLS profile and a basic-auth policy, because, as we saw in the previous step, HEC endpoint has SSL enabled and the authentication tokens enabled. To perform the needed configurations first navigate to the user agent, that is connected to the newly created XML Firewall, settings. First we'll add a TLS policy that matches to HEC endpoint URI(s).

Next we'll add a basic authentication policy for which we'll need the HEC token from the Splunk configuration. The token can be found from the HEC inventory page, an example is shown below.

The token can then be used to create the authentication policy as shown below. URL matching expression can be set to match Splunk HEC (*/services/collector/*) and username to Splunk. Then we'll need to create a new password alias that contains the authentication token. The end result is shown in the third picture below.


All the configurations are now ready and we can create the actual subscription using DataPower XML Management interface. Below is an example push subscription request that has been modified from the ready-made samples. The request schema follows the Web Services Eventing specification which can be found for example from
https://www.w3.org/Submission/WS-Eventing/.
<?xml version="1.0" encoding="UTF-8"?>
<env:Envelope
xmlns:wsman="http://schemas.xmlsoap.org/ws/2005/02/management"
xmlns:wse="http://schemas.xmlsoap.org/ws/2004/08/eventing"
xmlns:wsa="http://schemas.xmlsoap.org/ws/2004/08/addressing"
xmlns:env="http://www.w3.org/2003/05/soap-envelope"
xmlns:test="http://myexample.com/wsm-test">
<env:Header>
<wsa:To>/wsman?ResourceURI=(wsman:datapower.com/resources/2005/07/domain)</wsa:To>
<wsa:ReplyTo>
<wsa:Address env:mustUnderstand="true">
http://schemas.xmlsoap.org/ws/2004/08/addressing/role/anonymous
</wsa:Address>
</wsa:ReplyTo>
<wsa:Action env:mustUnderstand="true">
http://schemas.xmlsoap.org/ws/2004/08/eventing/Subscribe
</wsa:Action>
<wsman:MaxEnvelopeSize env:mustUnderstand="true">51200</wsman:MaxEnvelopeSize>
<wsa:MessageID>xsltmark:sub-push-req-001</wsa:MessageID>
<wsman:OperationTimeout>PT60.000S</wsman:OperationTimeout>
<wsman:System>wsman:datapower.com/resources/2005/07/ws-management</wsman:System>
<wsman:SelectorSet Name="dp-domain">
<wsman:Selector Name="domain">wsm-test</wsman:Selector>
</wsman:SelectorSet>
</env:Header>
<env:Body>
<wse:Subscribe>
<wse:Delivery Mode="http://schemas.xmlsoap.org/ws/2005/02/management/Events">
<wse:NotifyTo>
<wsa:Address>http://127.0.0.1:2048</wsa:Address>
<wsa:ReferenceProperties>
<test:Subscription>splunk-subscription</test:Subscription>
</wsa:ReferenceProperties>
</wse:NotifyTo>
<wsman:MaxElements>20</wsman:MaxElements>
<wsman:MaxTime>PT60S</wsman:MaxTime>
</wse:Delivery>
<wse:Expires>PT10M</wse:Expires>
</wse:Subscribe>
</env:Body>
</env:Envelope>
The relevant fields for the subscription in this case are Subscribe/Deliver/NotifyTo/Address and the Subscribe/Expires that tells how long the subscription is active (ISO 8601 format, in my case 10 minutes). For the delivery address, if your monitoring platform supports SOAP messaging you can just fill in the event sink address, but in my case I'll use a localhost address that matches the newly created XML Firewall that handles the message transformations. Once the request is sent to the DataPower XML Management interface we should get back an ok response that is described below.
$ curl -d @create-push-subscription.xml -H "Content-Type: text/xml" -u admin:xxxxx -k https://localhost:5550/service/mgmt/3.0
% Total % Received % Xferd Average Speed Time Time Time Current
Dload Upload Total Spent Left Speed
100 3050 0 1300 100 1750 3834 5162 --:--:-- --:--:-- --:--:-- 9023
<?xml version="1.0" encoding="UTF-8"?>
<env:Envelope xmlns:wsman="http://schemas.xmlsoap.org/ws/2005/02/management" xmlns:wse="http://schemas.xmlsoap.org/ws/2004/08/eventing" xmlns:wsa="http://schemas.xmlsoap.org/ws/2004/08/addressing" xmlns:env="http://www.w3.org/2003/05/soap-envelope" xmlns:test="http://myexample.com/wsm-test">
<env:Header xmlns:wsen="http://schemas.xmlsoap.org/ws/2004/09/enumeration">
<wsa:To>http://schemas.xmlsoap.org/ws/2004/08/addressing/role/anonymous</wsa:To>
<wsa:Action>http://schemas.xmlsoap.org/ws/2004/08/eventing/SubscribeResponse</wsa:Action>
<wsa:RelatesTo>xsltmark:sub-push-req-001</wsa:RelatesTo>
</env:Header>
<env:Body xmlns:wsen="http://schemas.xmlsoap.org/ws/2004/09/enumeration">
<wse:SubscribeResponse>
<wse:SubscriptionManager>
<wsa:Address>/wsman?ResourceURI=(wsman:datapower.com/resources/2005/07/ws-gateway)</wsa:Address>
<wsa:ReferenceProperties>
<dpt:Domain xmlns:dpt="http://www.datapower.com/schemas/transactions">wsm-test</dpt:Domain>
<wse:Identifier>uuid:2728e77d-817c-42c2-a261-b239e99a9a3a</wse:Identifier>
</wsa:ReferenceProperties>
</wse:SubscriptionManager>
<wse:Expires>PT5M</wse:Expires>
<wsen:EnumerationContext>uuid:2728e77d-817c-42c2-a261-b239e99a9a3a</wsen:EnumerationContext>
</wse:SubscribeResponse>
</env:Body>
</env:Envelope>
The response should contain an identifier that shows that the subscription was created successfully. The subscription can also be verified for example from the WebGUI as shown below.

Step 5: Test the subscription
Now that the subscription is active we can now run a test and see if the monitoring event is successfully consumed by Splunk. Lets send a simple JSON to the example Multi-Protocol Gateway using cURL.
$ curl -d '{"request": {"text": "This is my request"}}' -H "Content-Type: application/json" http://localhost:8080/mytestservice
  % Total    % Received % Xferd  Average Speed   Time    Time     Time  Current
                                 Dload  Upload   Total   Spent    Left  Speed
100   100    0    57  100    43    263    199 --:--:-- --:--:-- --:--:--   465
{"response":{"text":"This is a simple response message"}}
As the response indicates DataPower has successfully processed the request message and responded accordingly. Lets check the if we have a corresponding event in Splunk. Running a search against integration index shows an event that contains the automatically extracted details related to the transaction in question.

Since we defined the sourcetype as JSON and transformed the SOAP message emitted by the DataPower to match the Splunk HEC input schema all fields get automatically "parsed" and can be used as search attributes. Below is an example of a Splunk table view that makes it possible to process and visualize the transaction data even further.
 Hope this post gives you a bit more details on the Web Services Management agent and some new ideas on how to benefit from it.
As promised, here is an export of the proxy service that was used to transform the monitoring events between DataPower and Splunk HEC,
wsm-agent-proxy.zip