This article describes the recent serviceability enhancement to the ACE ActivityLog which aids in speeding up the problem diagnosis. This enhancement adds internal messageId to every transaction recorded in the ActivityLog. This is particularly useful for diagnosing performance issues as we will see in this article.
Before we start describing this new feature and how to configure it, let's look at the problem statement and the context that motivated this enhancement.
Performance issues in App Connect Enterprise (ACE) can often be caused by poorly performing backend systems. However, this is not always visible to customers or support staff because the initial symptom looks like a flow that takes a long time to run.
Diagnosing these issues generally requires a support engineer to analyse a service trace, or to analyse accounting and statistics data provided by the customer. Both of these tasks are time consuming, and some customers are reticent to enable either of these options due to the performance cost incurred. When there are 10s and 100s of message flows running, then it becomes even more difficult to isolate the problematic message flow and the node(s) within the flow that are contributing to the slowness.
Activity Logs help you to understand what your message flows are doing by providing a high-level overview of how IBM® App Connect Enterprise interacts with external resources.
Performance degradation issues often lead to cascade failures which makes a timely problem resolution even more important.
The Performance Alert feature introduced in ACE 12.0.7.0 complements the ActivityLog such that it is now it possible to correlate the performance warning to the exact message flow activity inside the activityLog using the messageId.
Analysing a performance issue using ActivityLog messageId
In ACE 12.0.8.0 , when activityLog is enabled to write the logs into the file, an internal messageId is added to the log entries as a last element on each row, as shown below:
11501,I,"2023-04-03 07:03:09.051789",25727,,"MSGFLOW=update_emp,NODE=HTTP Input,NODETYPE=INPUT,",HTTP Input,update_emp,(0000647F-642A7A2D-00000257),
Where, the last value, (0000647F-642A7A2D-00000257), is the internal messageId.
There is no special or extra configuration needed to enable messageIds in the ActivityLog. They get written by default.
Note : The messageId feature is already part of the debug service traces and performance alert message. The mesageId allows us to correlate the events in various diagnostic docs like service trace, ActivityLog, Flow thread reporter, performance alert BIP warning.
Demonstration using an example:
Let’s take a example message flow ‘update_emp.msgflow’ to demonstrate how these features, Performance alert and ActivityLog , improve the troubleshooting capability and gets quickly to the problematic area.
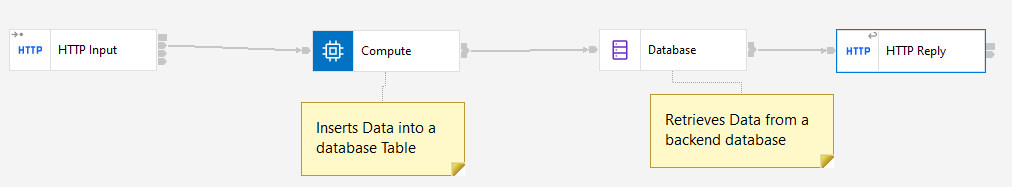
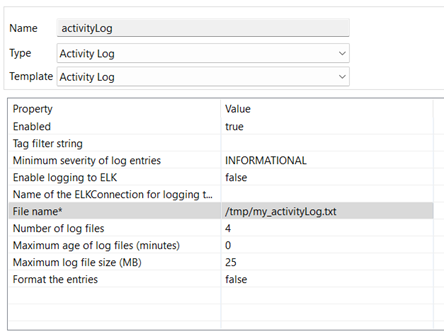
This message flow performs some operations against a backend databases through different nodes, compute node and a database node. Enable ActivityLog to write to a file (using ActivityLog policy).
We also enable performance alert feature with following properties set in server.conf.yaml
PerformanceAlert:
alertOn: true
alertInterval: 300
warmupMessageCount: 2000
alertMinNodeElapsedTime: 200
alertMinNodeElapsedTimeDeviation: 25
#startMessageFlowStatistics: false
#statisticsCollectionDuration: 10
When processing messages through this message flow we simulate some delays with database responses so as to generate the performance degradation situation. When the responses are delayed beyond the defined threshold as defined by alertMinNodeElapsedTimeDeviation property in server.conf.yaml, a performance alert message will appear is syslog as below:
2023-04-03T03:03:09.134853-04:00 lasagne ACE[25413]: IBM App Connect Enterprise v12080 (ASV1208.EG1) [Thread 25727] (Msg 1/1) BIP8514W: Message flow node 'Compute' in message flow 'update_emp' has taken '820' milli seconds which is unusually long and the associated message id is '(0000647F-642A7A2D-00000257)'. The average time taken by this node during the warmup message processing was '208' milli seconds.
When such performance alert occurs, we note down the messageId that is logged in the performance alert BIP message. Use this messageId to extract the set of activities, from the activityLog. That will give us the set of operations the message flow was performing to process that particular message.
In the above example, the performance warning message contains message id '(0000647F-642A7A2D-00000257)'
As the activityLog is enabled to write to the file, we extract the log entries by grepping (0000647F-642A7A2D-00000257) in ActivityLog file .
This give us following log lines.
11501,I,"2023-04-03 07:03:09.051789",25727,,"MSGFLOW=update_emp,NODE=HTTP Input,NODETYPE=INPUT,",HTTP Input,update_emp,(0000647F-642A7A2D-00000257),
12078,I,"2023-04-03 07:03:09.052189",25727,,"RM=ODBC,DATASOURCE=ORACLEDB,ODBCOPERATION=CONNECT,MSGFLOW=update_emp,NODE=Compute,", ORACLEDB, ,(0000647F-642A7A2D-00000257),
12079,I,"2023-04-03 07:03:09.152491",25727,,"RM=ODBC,DATASOURCE= ORACLEDB,ODBCOPERATION=CONNECT,MSGFLOW=update_emp,NODE=Compute,", ORACLEDB, Connection took 100 ms, (0000647F-642A7A2D-00000257),
12080,I,"2023-04-03 07:03:09.152624",25727,,"RM=ODBC,DATASOURCE= ORACLEDB,ODBCOPERATION=PREPARE,MSGFLOW=update_emp,NODE=Compute,", ORACLEDB,INSERT INTO EMP VALUES (?, ?),(0000647F-642A7A2D-00000257),
12081,I,"2023-04-03 07:03:09.153534",25727,,"RM=ODBC,DATASOURCE= ORACLEDB,ODBCOPERATION=PREPARE,MSGFLOW=update_emp,NODE=Compute,", ORACLEDB,INSERT INTO EMP VALUES (?, ?) Execution took 0 ms,(0000647F-642A7A2D-00000257),
12074,I,"2023-04-03 07:03:09.153901",25727,,"RM=ODBC,DATASOURCE= ORACLEDB,ODBCOPERATION=EXECUTE,MSGFLOW=update_emp,NODE=Compute,", ORACLEDB,INSERT INTO EMP VALUES (?, ?),(0000647F-642A7A2D-00000257),
12075,I,"2023-04-03 07:03:09.854483",25727,,"RM=ODBC,DATASOURCE= ORACLEDB,ODBCOPERATION=EXECUTE,MSGFLOW=update_emp,NODE=Compute,", ORACLEDB,INSERT INTO EMP VALUES (?, ?) Execution took 700 ms,(0000647F-642A7A2D-00000257),
As we can see that most of the operations have taken 0 to 1 ms execution time, the connect to database has taken 100ms but the INSERT operation has taken about 700 milliseconds out of the total 820 milliseconds time reported in the Compute Node (as per the performance alert BIP message).
12075,I,"2023-04-03 07:03:09.134483",25727,,"RM=ODBC,DATASOURCE= ORACLEDB,ODBCOPERATION=EXECUTE,MSGFLOW=update_emp,NODE=Compute,", ORACLEDB,INSERT INTO EMP VALUES (?, ?) Execution took 700 ms,(0000647F-642A7A2D-00000257),
So this suggest that there may be problem with Database server side causing the delays with INSERT query. Subsequently the problem can be debugged further with DB Admin.
Conclusion:
The combination of Performance alert feature and ActivityLog messageId feature allows the administrator and support engineer to identify the bottlenecks more quickly and provide better time-to-resolution for message flow performance issues.
This enhancement would allow ACE administrator to identify the operations with the backend system that the message flow was involved with and allow them to take pre-emptive action before cascade failures occur.
NOTE: This feature is available across all form factors of ACE v12, i.e. ACE on-prem vm based deployment, ACE in CP4I, ACEcc, ACEaaS in AWS.
Message flow Performance alert feature available in 12.0.7.0 and onward.
ActivityLog with messageId feature available in 12.0.8.0.
#AppConnect