Co-author - Anand Awasthi
In this article, we talk about the steps required for collecting some of the commonly needed diagnostic data for troubleshooting problems with IntegrationServer and the deployed resources running in the IBM Cloud Pak for Integration (CP4I) environment. For example, you may want to dynamically turn on traces in order to debug some runtime errors of your message flow or you may want to enable message flow statistics in CSV format in order to investigate a performance issue and so on. There are Admin REST APIs available to perform these tasks dynamically without needing to restart the IntegrationServer pod.
In order to connect to the IntegrationServer in a container, you will need to know few things;
- The admin port number of the Integration Server.
- The basic authentication details.
- Is the Admin Port of the IntegrationServer secured via TLS ? if yes, then the TLS certificates are needed.
1. Admin Port number :
The default admin port is 7600. However, you can also find it out by running the command
$ oc get svc -n <namespace>
It will show output similar to below ( 7800 & 7843 are for http/https traffic and 7600 is Admin port)
testserver-is ClusterIP 172.30.113.251 <none> 7800/TCP,7843/TCP,7600/TCP
2. Basic Auth details
To obtain basic auth information, run the following command by logging into the target namespace.
$ oc get secrets <int server name>-is -o template --template '{{.data.adminusers}}' | base64 -d
For example, if the integration server name is ‘testserver’ then the command would be;
$ oc get secrets testserver-is -o template --template '{{.data.adminusers}}' | base64 -d
The output will be in following format : <userid> <password>
ibm-ace-dashboard-admin 1a20b947-727f-4b21-ac14-13215447d243
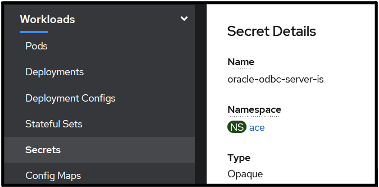
You can also obtain it via the OCP console
OCP Console → Workloads → Secrets → Int Server Name

In the Data Section, get the user id and password for the admin user by clicking on Reveal values


3. Is the Admin Port secured via TLS?
To check if the Admin Port on the Integration Server is secured via TLS , run the following command :
$ oc describe IntegrationServer <int server name>
And search for the following Spec;
Spec:
Admin Server Secure: true
If the Admin Server Secure value is ‘true’ then it means the Admin server is secured via TLS certificates.
If the Admin Server Secure value is ‘false’ then you require only basic authentication to connect to the Admin Server.
Case 1 : Admin Server Secure is ‘true’.
In this case you will require client certs in order to connect over the admin port to run the Admin REST APIs in addition to the basic authentication.
Extracting client certs
- Obtain name of the Integration server using
$ oc get IntegrationServer -n namespace
- Extract the certificates from the container
export ISNAME=<int server name>
echo $(oc get secrets $ISNAME-is-admincert -o template --template '{{index .data "tls.crt"}}') | base64 -d > tls.crt
echo $(oc get secrets $ISNAME-is-admincert -o template --template '{{index .data "tls.key"}}') | base64 -d > tls.key
- Extract basic auth information
oc get secrets $ISNAME-is -o template --template '{{.data.adminusers}}' | base64 -d
- Port forward the admin port of Integration server pod
$ oc port-forward pod/<pod name of IS> 7600:7600
- Run the REST Admin API. For example, To list all the deployed applications using curl command
$ curl --cert tls.crt --key tls.key -k https://localhost:7600/apiv2/applications -u <basic auth>
Case 2 : Admin Server Secure is ‘false’
In this case you will require only basic authentication to be able to run Admin commands.
How to obtain basic auth information is explained in point (2) above.
You can run the Admin APIs as shown in the example here :
$ oc port-forward pod/<pod name of IS> 7602:7600
$ curl -u ibm-ace-dashboard-admin:a9ca8cde-518f-4951-9957-73bd3d9f7c88 -X GET http://localhost:7602/apiv2/applications
Collecting Diagnostic docs
We will cover information on collecting the following set of docs;
- Service trace
- User trace
- Accounting & Statistics
- aceDataCollector
Service Trace
- Enable port forwarding
$ oc port-forward pod/<pod name of IS> 7600:7600
- To enable the service trace at ‘debug’ level and default trace size (1GB) :
$ curl --cert tls.crt --key tls.key -k -X POST https://localhost:7600/apiv2/start-service-trace -u ibm-ace-dashboard-admin:a9ca8cde-518f-4951-9957-73bd3d9f7c88
- To disable the service trace
$ curl --cert tls.crt --key tls.key -k -X POST https://localhost:7600/apiv2/stop-service-trace -u ibm-ace-dashboard-admin:a9ca8cde-518f-4951-9957-73bd3d9f7c88
You need to pass the tls cert and key if Admin Security is enabled. In the previous section we discussed how to extract these certificates.
If Admin Security is disabled on the Integration server then you can enable the traces using just basic auth information.
curl -X POST http://localhost:7600/apiv2/start-service-trace -u ibm-ace-dashboard-admin:a9ca8cde-518f-4951-9957-73bd3d9f7c88
To disable the service trace
curl -X POST http://localhost:7600/apiv2/stop-service-trace -u ibm-ace-dashboard-admin:a9ca8cde-518f-4951-9957-73bd3d9f7c88
User Trace
- To enable the user trace at ‘debug’ level and default trace size (1GB).
curl -X POST http://localhost:7600/apiv2/start-user-trace -u ibm-ace-dashboard-admin:a9ca8cde-518f-4951-9957-73bd3d9f7c88
- To disable the user trace
curl -X POST http://localhost:7600/apiv2/stop-user-trace -u ibm-ace-dashboard-admin:a9ca8cde-518f-4951-9957-73bd3d9f7c88
User trace and Service trace can be copied out of container from the following location using oc copy or oc rsync commands:
/home/aceuser/ace-server/config/common/log/*trace*.txt
/home/aceuser/ace-server/config/common/log/*userTrace*.txt
Message Flow Accounting and Statistics
- Enable port-forwarding:
$ oc port-forward pod/<pod name of IS> 7600:7600
- To start message flow statistics collection:
curl -X PATCH https:// localhost:7600/apiv2/statistics/snapshot -u <Basic Auth> -H Content-Type:application/json -H Accept:application/json -d '{ "properties": { "nodeDataLevel": "advanced", "outputFormat": "json,csv", "publicationOn": "active", "threadDataLevel": "basic", "type": "Snapshot" } }'
curl -X POST https://localhost:7600/apiv2/statistics/snapshot/start-collection -u <Basic Auth>
- To Stop Statistics Collection :
curl -X POST https://localhost:7600/apiv2/statistics/snapshot/stop-collection -u <Basic Auth>
d. Reset the Statistics to default logging format- json
curl -X PATCH https:// localhost:7600/apiv2/statistics/snapshot -u <Basic Auth> -H Content-Type:application/json -H Accept:application/json -d '{ "properties": { "nodeDataLevel": "basic", "outputFormat": "json", "publicationOn": "active", "threadDataLevel": "none", "type": "Snapshot" } }'
If Admin Security is enabled, specify the tls certificate details on the curl options as shown below :
curl --cert tls.crt --key tls.key -k -X PATCH https://$ip:7600/apiv2/statistics/snapshot -u $CREDS -H Content-Type:application/json -H Accept:application/json -d '{  "properties": { "nodeDataLevel": "basic",    "outputFormat": "csv",    "publicationOn": "active",    "threadDataLevel": "basic",    "type": "Snapshot"  } }'

curl --cert tls.crt --key tls.key -k -X POST https://$ip:7600/apiv2/statistics/snapshot/start-collection -u $CREDS
Statistics can be copied out of the container from the following location using oc copy or oc rsync commands:
/home/aceuser/ace-server/config/common/stats/*.csv
Passing Env variables to an Integration Server
There may be a situation when you want to set some env variables for debugging purposes or to alter the behaviour. You can do so by passing them via the Deployment object.
Using Command Line:
oc set env deployment/<deployment name> <env var>=valueUsing OCP Console :
Workload → Deployment → Environment → Add Value → SaveThe Integration Server pod will restart when you add and save the env variables.

aceDataCollector
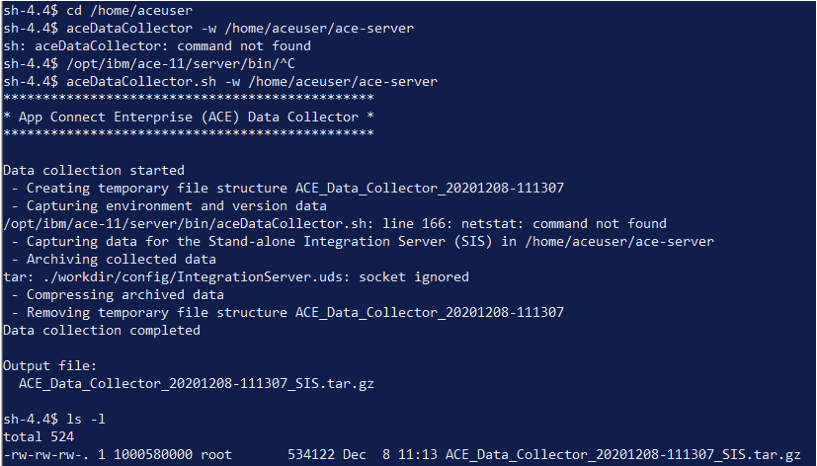
Another utility shipped with the IBM App Connect Enterprise product is the aceDataCollector which collects mustGather information for any problem determination. Following are the steps for running aceDataCollector inside a running IntegrationServer container.
- oc rsh <ace pod>
- Run mqsiprofile from following location
$ . /opt/ibm/ace-11/server/bin/mqsiprofile
- cd /home/aceuser
- Run ACE DataCollector as:
$ aceDataCollector.sh -w /home/aceuser/ace-server
- Copy the file out of the container using the command:
$ oc rsync <pod name>:<Complete path of the datacollector zip output> <local path to store the file>
For example:
$ oc rsync oracle-odbc-server-is-978db479-q9xpp:/home/aceuser/ACE_Data_Collector_20201208-111307_SIS.tar.gz c:\temp
