A place for Apptio product users to learn, connect, share and grow together.
Hello,
I am having issues duplicating some of the out-of-the-box reports from Apptio in a custom report I am working on. We want to generate a trailing 12 month IT spend as a % of net revenue. This would help my CIO see how his spend relates to NR without incorporating highs and lows in revenue or spend. I want this to go on a trend graph. I see similar reports when I drill in to Trend in IT Tower reports (see screenshot). Is there any way to do this in report builder or is this something that is not available for custom reports?
Thanks,
Mark
A chart can contain a trailing (rolling lookback) trend for any metric or numeric-type column.
From Time perspective, drag Months (Yr) to Axis (or Columns) area.
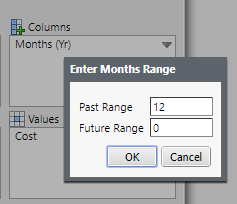
Right-click Months (Yr) > Range.
Past Range: 12
Future Range: 0
Thank you so much, worked perfectly!