I'm new to SPSS. In Six Sigma and Quality Control we often use a Multi-Vari Chart Multi-vari chart basics
I cannot find a way to create this type of chart in SPSS. Is it possible?
| Minitab |
remove preview |
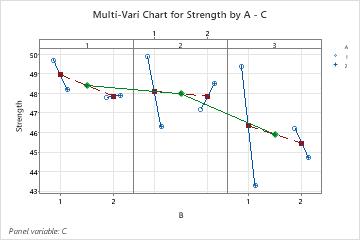 |
| Multi-vari chart basics |
| Two factors interact if the effect of one factor on the response depends on the level of the other factor. An interaction between factors A and B would be denoted AB. For example, suppose there are two routes you can drive home. One is the expressway and the other is a side road. |
| View this on Minitab > |
|
|
------------------------------
Alan Leduc
------------------------------