Hi Molly,
I assume that your time tracking data has been modeled. Thus, you can create a new metric for the actual hours and the percentage coloumns you need.
1. Make a calculated metric by clicking on new in the top menu ribbon and choosing metric.
2. Make the formula in that metric = the actual hours from the coloumn in your time tracking dataset.
3. You will need to make a metric for the percentages as well or you can make a formula coloumn. You would take the the actual hours for the attribute and divide it by the sum of the actual hours for all attributes. ensure your number format is a percentage and it should work.
4. Ad that metrics to a table along with the attributes you want it broken up by.
5. You can then add a time dimension to the table by clicking on time in the explorer on the far left of your screen. It should be the last option.
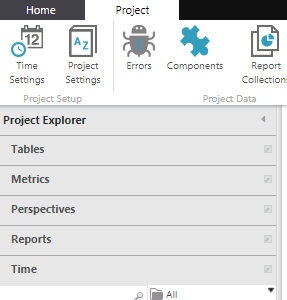
6. You will want to Choose current month, YTD and current quarter to get the values you are looking for. The system will automatically calculate them for you. Drag those time dimensions into the ad hoc query configuration as columns or rows depending how you want it displayed. You can also drag a time period in, right click on it and create a range for it if you want to see multiple months or quarters side by side.
I hope that addresses everything you are looking for. I can add more screenshots if things are not clear. Please ask questions!
Thanks,
Lauren Griessel