Hi, I hope someone can shed some light of what is happening with the Integration managing its memory.
We have an intermittant issue where the used memory increases sharply for a reason as yet to be identfied, but at the same time the total memory available reduces.
We are running IS 9.5 on a RedHat Linux 64bit VM machine with the following memory settings
JAVA_MIN_MEM=3072M
JAVA_MAX_MEM=3072M
JAVA_MAX_PERM_SIZE=256M
Normally the IS runs happliy consuming no more than 50% of memory most of the time.
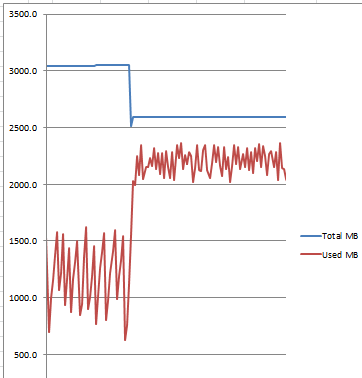
Then periodically, which can be once every few days or once a month or twice a day even an as yet unknown event occurs which causes the memory used to increase significantly, by nearly a gig sometimes, but to make matters worse the Total Memory available drops at the same time, making the used percentage quite high.
Once this happens, the used and total memory never recover to their original state and if a 2nd unknown event occurs, the memory consumptions becomes so high it will causes the server to restart. Normally though we restart it before it gets to the stage.
Any help to understand what sort of issue would cause the total memory reduce like that would be much appreciated.
See the figures taken from the stats.log below.
Time Total MB Used MB(Converted from Free memory)
12:44 3047.0 977.1
12:45 3047.0 1215.3
12:46 3047.0 1413.7
12:47 3047.0 1596.7
12:48 3050.5 986.7
12:49 3050.5 1194.1
12:50 3050.5 1333.0
12:51 3050.5 1546.0
12:52 3050.0 628.5
12:53 3050.0 755.6
12:54 3050.0 1122.4
12:55 2516.5 1552.6
12:56 2589.0 2029.7
12:57 2589.0 1993.7
12:58 2589.0 2247.9
12:59 2589.0 2079.6
13:00 2589.0 2348.7
13:01 2589.0 2047.7
13:02 2589.0 2153.3
13:03 2589.0 2151.7
13:04 2589.0 2231.2
13:05 2589.0 2158.8
13:06 2589.0 2316.3
The attached screen shot demonstrates the issue better.
Many thanks in advance,
Mark
#webMethods-General#Integration-Server-and-ESB#webMethods