Platform

Platform

A place for Apptio product users to learn, connect, share and grow together.

 View Only
Expand all | Collapse all

Explaining TBM in a Picture

Apptio Community Member

Apptio Community MemberSat September 26, 2020 11:21 PM

Jenny Franklin

Jenny FranklinMon September 28, 2020 01:56 PM

Apptio Community Member

Apptio Community MemberMon September 28, 2020 04:22 PM

Jenny Franklin

Jenny FranklinMon September 28, 2020 05:24 PM

Jenny Franklin

Jenny FranklinTue September 29, 2020 10:41 AM

Jenny Franklin

Jenny FranklinFri November 06, 2020 10:15 AM

  • 1.  Explaining TBM in a Picture

    Posted Sat September 26, 2020 01:38 PM
      |   view attached

    The TBM Community is full of smart and creative folks and so I want to pick your brains!  #notazombie


    Do you have pics you've created to explain TBM to a non-TBM person?  Looking for something in one or two pages.


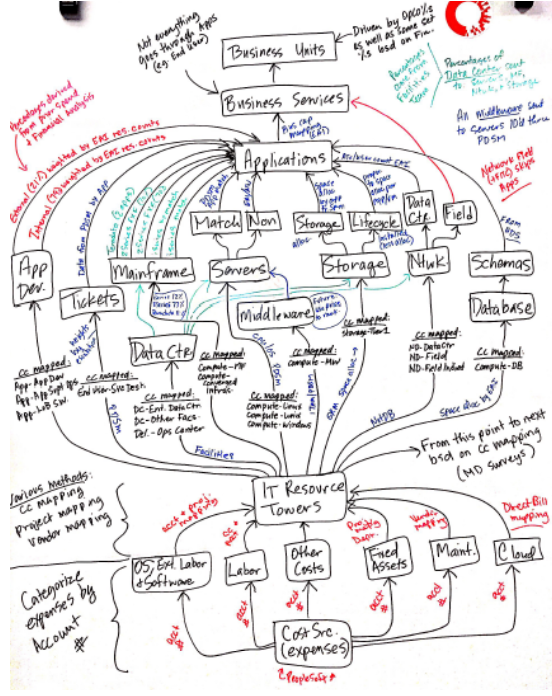
    I've seen the Happy Meal (attached) and the Spaghetti Bolognaise versions, but looking for something specific to the actual model.


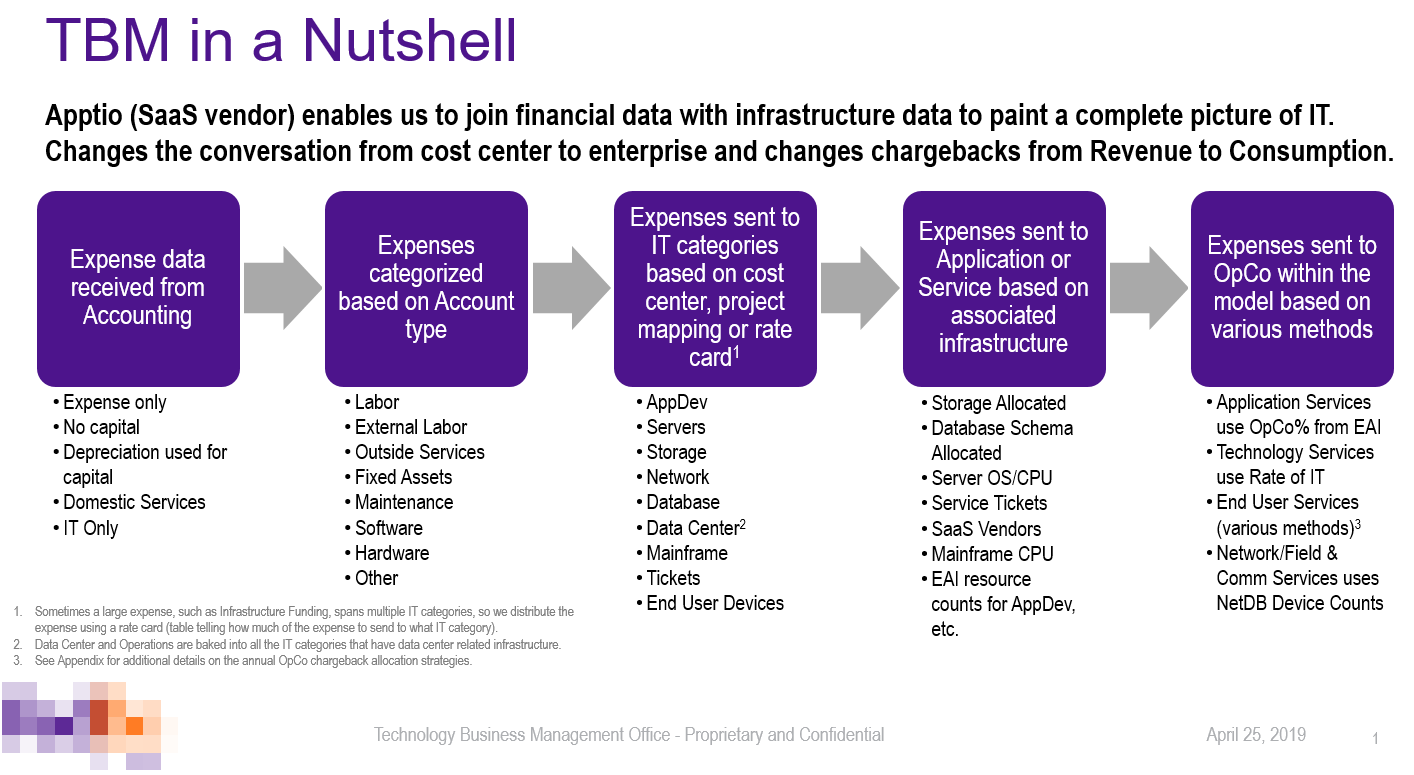
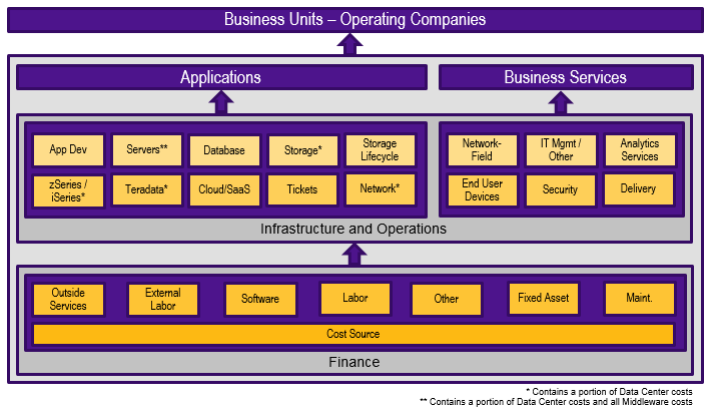
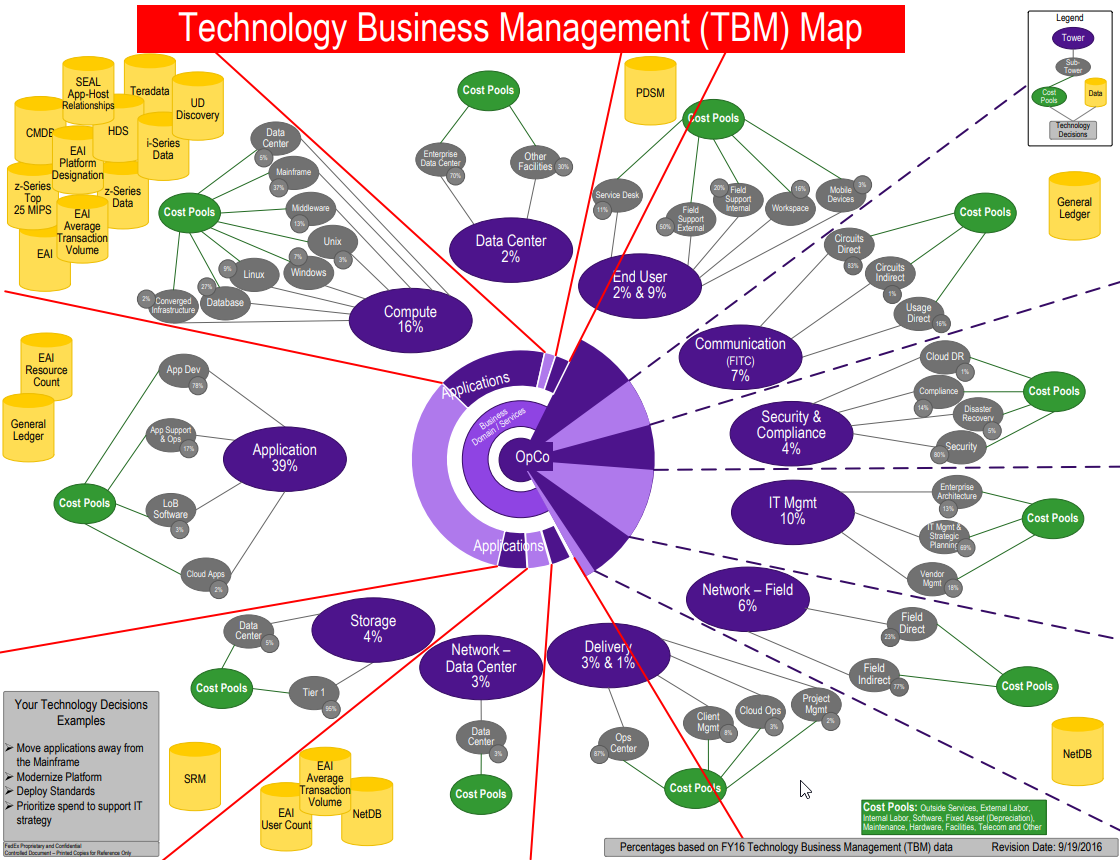
    Here's some I've created in the past...


    This one is kinda close...  It's really cool, but not sure I could use it with our model - way more puts/takes.  (I didn't create this one, just supplied info.)


    Maybe I need to revisit this one I drew a long time ago and just update it with the new model (different company) - since it shows the data sources and the towers/sub-towers... ?


    But still looking for a new and different way to explain things.  Something that showcases the fact that we use IT data to stand the whole thing up (well, the guts in between the cost source and apps/services).  Something that would really resonate with a CIO type. 


    I swear I remember seeing some pics like that on here a while back, but cannot find them to save my life.


    If you have a pic like that, would you mind sharing?  THANK YOU SO MUCH!!!


    #Platform


  • 2.  Re: Explaining TBM in a Picture

    Posted Sat September 26, 2020 04:41 PM
      |   view attached

    Hi Jenny – I’m attaching a page from a deck that we use to explain what the TBM model is and the value it provides.  We’ve found from experience to try to keep it simple for non-TBM people.


    (we borrowed some icons from Apptio materials to create this, so it’s only fair I provide it back to you   ).


    But seriously, hope it helps!


    #Platform

    Attachment(s)

    pptx
    TBM Model Illustration.pptx   120 KB 1 version


  • 3.  Re: Explaining TBM in a Picture

    Posted Sat September 26, 2020 05:18 PM

    @Carol St. Claire YOU ROCK - thank you so much!!  Yes, this definitely helps!!!


    #Platform


  • 4.  Re: Explaining TBM in a Picture

    Posted Sat September 26, 2020 07:59 PM

    Awesome!  I'm so glad I could finally help you with something, after all the help you've provided to me over the years!


    #Platform


  • 5.  Re: Explaining TBM in a Picture

    Posted Sat September 26, 2020 11:20 PM

    @Carol St. Claire, this is awesome.


    #Platform


  • 6.  Re: Explaining TBM in a Picture

    Posted Sat September 26, 2020 11:21 PM

    @Jenny Franklin, you rock as always.


    #Platform


  • 7.  Re: Explaining TBM in a Picture

    Posted Sat September 26, 2020 11:23 PM

    @Jenny Franklin, any idea which tool was used to built the TBM Map? I really liked the idea. it is very good for a quick reference.Would love to build one for myself.


    #Platform


  • 8.  Re: Explaining TBM in a Picture

    Posted Sun September 27, 2020 10:44 AM

    First off, you're entirely too kind  So the first two that I posted were PowerPoint, the second was done in Visio, and the third was done on a grease board.  I may try redrawing the grease board version using Flowchart Maker & Online Diagram Software (it's free!).


    #Platform


  • 9.  Re: Explaining TBM in a Picture

    Posted Mon September 28, 2020 10:04 AM

    Haven't gone through the entire post in full detail, but I definitely like the one-pager views you've posted here, @Jenny Franklin !

    I've had to create a one-pager summary slide for the model specific to our organization, but it's more of a sankey diagram view (i.e. flow of ideas = left to right). The idea is to prime users for viewing the Visual R12 Model Reports.


    The one published in the Technology Business Management book (seen below) is definitely very useful, and I always include a version of that in my slides as a reference. Similar to the 3rd diagram in your post, I added a color code scheme for the different layers of the model:


    • Finance Layer = Green

    • IT Layer = Orange

    • Business Layer = Blue/Purple


    This color scheme pervades through our different reports and slicers to convey which part of the model the data is coming from.


    #Platform


  • 10.  Re: Explaining TBM in a Picture

    Posted Mon September 28, 2020 10:28 AM

    Thank you, @Kyle Castro!


    #Platform


  • 11.  Re: Explaining TBM in a Picture

    Posted Tue September 29, 2020 10:11 AM

    @Kyle Castro I remember this from the early days.  I recall one manager referring to them as 'cake layers'


    #Platform


  • 12.  Re: Explaining TBM in a Picture

    Posted Mon September 28, 2020 12:22 PM

    All these great pics remind me of the stages you go through when you try to explain the obvious to someone else!

    No 4 is my absolute favourite! Great work!!!

    Here one of my intents which worked out quite well. Not directly spaghetti-type but somewhat in that direction...  


    #Platform


  • 13.  Re: Explaining TBM in a Picture

    Posted Mon September 28, 2020 01:01 PM

    @Bettina Dase - this looks great - another unique view!  Thank you so much!!


    #Platform


  • 14.  Re: Explaining TBM in a Picture

    Posted Mon September 28, 2020 01:21 PM
      |   view attached

    See if this helps. Got it this from an Apptio resource – Jason Lam, who got it from another resource.


    Thanks


    Dhivya Shyam


    #Platform

    Attachment(s)


  • 15.  Re: Explaining TBM in a Picture

    Posted Mon September 28, 2020 01:56 PM

    @Dhivya Shyam Cool beans!  Very nice!  Thank you so much!


    #Platform


  • 16.  Re: Explaining TBM in a Picture

    Posted Mon September 28, 2020 04:22 PM

    @Jenny Franklin - welcome

    You can thank - Jason @Jason Lam


    #Platform


  • 17.  Re: Explaining TBM in a Picture

    Posted Mon September 28, 2020 05:24 PM

    Thank you both!!


    #Platform


  • 18.  Re: Explaining TBM in a Picture

    Posted Tue September 29, 2020 10:08 AM

    @Jenny Franklin We used many in the pas and still do, including the Services described using Spaghetti Bolognaise version.  Our latest has taken on a simpler form, one recognisable by budget holders which is working well.TBM Model


    #Platform


  • 19.  Re: Explaining TBM in a Picture

    Posted Tue September 29, 2020 10:41 AM

    This is excellent, @Sasha Dunford - thank you!!


    #Platform


  • 20.  Re: Explaining TBM in a Picture

    Posted Tue September 29, 2020 10:17 AM

    I have been using the following for years:
    Conceptual description of the TBM model


    • It allows me to explain the flow of money from the bottom to the top, towards the Business Units.
    • It classifies the cost drivers in a way that a TBM layman can easily understand.
    • Gives an overview of the data sources.
    • It has enough detail in the diagram for me to explain the various paths (labor, hardware, software, Cloud, etc.), without getting bogged down with the IT infrastructure more than absolutely necessary.

    #Platform


  • 21.  Re: Explaining TBM in a Picture

    Posted Tue September 29, 2020 10:47 AM

    Very nice, @Guillermo Cuadrado


    So many brilliant and creative folks on Community - y'all are awesome!!


    #Platform


  • 22.  Re: Explaining TBM in a Picture

    Posted Thu October 08, 2020 07:25 AM

    May be late to the party but we have a few versions that we use in customer training based on their level of experience


    We use a relatable example such as a food delivery service - this is the Level 1 view


    For those that are more aware of cost allocations (Level 2) we provide the below view - second to that we show the data sources in the same format:


    For our more experience users based on direct/in-direct costs (Level 3) we provide the below:


    #Platform


  • 23.  Re: Explaining TBM in a Picture

    Posted Thu October 08, 2020 10:22 AM

    Very neat set of diagrams you have here, @Julie Batty - very soothing for my slight OCD and soul hehe


    #Platform


  • 24.  Re: Explaining TBM in a Picture

    Posted Thu October 08, 2020 11:57 AM

    Evidenced again by the presentation yesterday, I spend way too many hours aligning boxes although I can't take credit for all of these as very much a team effort


    #Platform


  • 25.  Re: Explaining TBM in a Picture

    Posted Thu October 08, 2020 10:28 AM

    Very nice!!  Thank you so much, @Julie Batty!  And you have a kindred OCD spirit over here, @Kyle Castro


    #Platform


  • 26.  Re: Explaining TBM in a Picture

    Posted Fri October 30, 2020 01:58 PM

    Hi Jenny, I can't share anything specific, but I have resorted (a few times) to what's recently been called the "spaghetti diagram". It's a simplified view of the Cost Model, from Cost Source to Business Units, which runs left to right on the page (rather than the Apptio bottom to top model view) ... so that I can fit more in.


    Colour coding of the Cost Model is one things that I try to establish as a standard in any organisation I work with. I usually start (for no particular reason) with

    • Cost Source and Cost Pools (fairly pure Finance layer) - Orange
    • IT Resource Towers - Red
    • Inventory to Applications - Blue
    • Services - Green
    • Business Users - Grey


    The one view of TBM which I'm hoping to one day find the graphical skill to draw is of the TBMO at the centre of a spiders web, with silk strands into Finance, Technology Infrastructure, App Dev, Enterprise Architecture, Business Process Management, Project Management, etc. That's an idea which has legs :-)


    #Platform


  • 27.  Re: Explaining TBM in a Picture

    Posted Thu November 05, 2020 06:30 PM

    Can't seem to figure out how to attach a file.  Darn.....  Love the feedback on this one though everyone!


    #Platform


  • 28.  Re: Explaining TBM in a Picture

    Posted Thu November 05, 2020 06:38 PM

    Answer the who, what, when, where and why...  I use the below 3 slides for the allocation bit!


    This seems to be the issue that most users are confused about so I spell it out...


    #Platform


  • 29.  Re: Explaining TBM in a Picture

    Posted Fri November 06, 2020 10:15 AM

    Thank you @Michelle McGuire!!


    #Platform