SPSS Statistics

 View Only
Expand all | Collapse all

Trying to create two boxplot in one chart: GPL translation error: Could not resolve identifier

  • 1.  Trying to create two boxplot in one chart: GPL translation error: Could not resolve identifier

    Posted Fri September 10, 2021 08:09 AM
    Dear community,

    I want to create a box plot with the data for two treatment groups next to each other. I found a code and adjusted the variable names for my data (and triple-checked them). However, I always get the following error message:

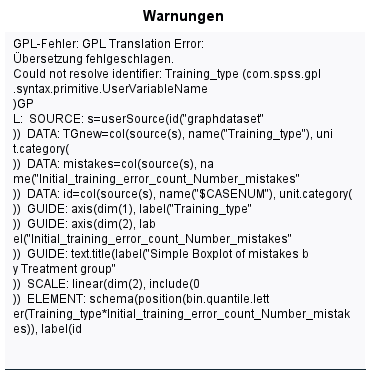
    However, the variable "Training_type" definitely exists in the dataset I use. Do you have any other ideas that could explain this behavior?

    This is the code I use which throws the error:

    DATASET ACTIVATE DataSet1.
    USE ALL.
    EXECUTE.


    /*TG on Error Count Analysis (Hypothesis H1)

    DATASET ACTIVATE DataSet1.

    /*Boxplot for Outliers
    * Chart Builder.
    GGRAPH
    /GRAPHDATASET NAME="graphdataset" VARIABLES=Training_type Initial_training_error_count_Number_mistakes MISSING=LISTWISE REPORTMISSING=NO
    /GRAPHSPEC SOURCE=INLINE.
    BEGIN GPL
    SOURCE: s=userSource(id("graphdataset"))
    DATA: TGnew=col(source(s), name("Training_type"), unit.category())
    DATA: mistakes=col(source(s), name("Initial_training_error_count_Number_mistakes"))
    DATA: id=col(source(s), name("$CASENUM"), unit.category())
    GUIDE: axis(dim(1), label("Training_type"))
    GUIDE: axis(dim(2), label("Initial_training_error_count_Number_mistakes"))
    GUIDE: text.title(label("Simple Boxplot of mistakes by Treatment group"))
    SCALE: linear(dim(2), include(0))
    ELEMENT: schema(position(bin.quantile.letter(Training_type*Initial_training_error_count_Number_mistakes)), label(id))
    END GPL.

    Thank you in advance for your help!

    ------------------------------
    Alexander Farr
    ------------------------------

    #SPSSStatistics


  • 2.  RE: Trying to create two boxplot in one chart: GPL translation error: Could not resolve identifier

    Posted Fri September 10, 2021 08:54 AM
    Try this:

    GGRAPH
    /GRAPHDATASET NAME="graphdataset" VARIABLES=Training_type Initial_training_error_count_Number_mistakes MISSING=LISTWISE REPORTMISSING=NO
    /GRAPHSPEC SOURCE=INLINE.
    BEGIN GPL
    SOURCE: s=userSource(id("graphdataset"))
    DATA: Training_type=col(source(s), name("Training_type"), unit.category())
    DATA: Initial_training_error_count_Number_mistakes=col(source(s), name("Initial_training_error_count_Number_mistakes"))
    DATA: id=col(source(s), name("$CASENUM"), unit.category())
    GUIDE: axis(dim(1), label("Training_type"))
    GUIDE: axis(dim(2), label("Initial_training_error_count_Number_mistakes"))
    GUIDE: text.title(label("Simple Boxplot of mistakes by Treatment group"))
    SCALE: linear(dim(2), include(0))
    ELEMENT: schema(position(bin.quantile.letter(Training_type * Initial_training_error_count_Number_mistakes)), label(id))
    END GPL.


  • 3.  RE: Trying to create two boxplot in one chart: GPL translation error: Could not resolve identifier

    Posted Mon September 13, 2021 08:54 AM
    I think Rick is right.  Here the issue is that the ELEMENT statement is looking for variable names on the left of the equals sign in the DATA statement.  You were using the names on the right-side.  By changing them both to be the same, you no longer need to worry which side.

    ------------------------------
    LOUIS Kittock
    ------------------------------