Algorithm Introduction
The IBM SPSS linear regression model can be used to analyze the predictive relationship between a continuous target and one or more predictors (features or feature variables) which can be continuous or categorical. The SPSS Linear Engine (LE) covers:
- Linear regression
- Analysis of variance
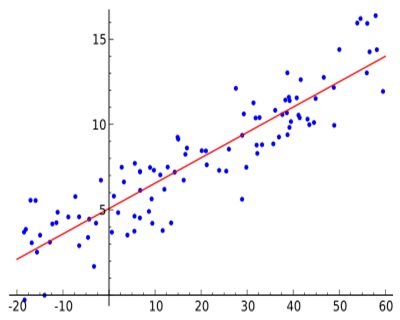
Linear regression is a linear model, i.e. a model that assumes a linear relationship between the input variables (x) and the single output variable (y). More specifically, that y can be calculated from a linear combination of the input variables (x). The linear regression of a single target variable y and a design matrix X has the following formula:
y=Xβ + ε
where ε follows a normal distribution with its mean = 0 and variance σ2D-1 (the covariance matrix).
When there is a single input variable (predictor), the method is simple linear regression. When there are multiple input variables (predictors), the method is multiple linear regression. The following model selection methods are supported (by default we use forwardStepwise).
- bestSubsets
- forwardStepwise
- lasso
- ridge
- elasticNet
Linear regression models are relatively simple and give an easily interpreted mathematical formula for generating predictions. Linear models are also typically very fast to train. The IBM SPSS LE can be used for regression analysis, including the following:
- Automatically detects interaction terms
- Executes model selection and the regularization process
- Performs model diagnostics and generates valuable insights
IBM SPSS LE cannot be used for classification analysis.
SPSS LE Features
The IBM SPSS LE model supports features including the following:
automatic interaction effect detection, forward stepwise model selection, diagnostic checking, and unusual category detection based on Estimated Marginal Means (EMMEANS), etc.
for which details can be checked from figure below:

Special Features in SPSS LE
The IBM SPSS LE model supports post estimations to evaluate the model quality, including:
-
Test of Model Effects:
ANOVA, including followings:
- Sum of squares for corrected model, effects, residual and corrected total
- Mean square
- F-test value
- Degrees of freedom
- p-values
-
Model Quality Measure:
The squared multiple correlation coefficient (R square) or coefficient of determination is to measure of how much of the variation in the data is explained by the model.
-
Predictor Importance:
Predictor importance does not relate to model accuracy. It just relates to the importance of each predictor in making a prediction, not whether the prediction is accurate.
-
EMMEANS:
Estimated Marginal Means, for the significance of effects.
-
Model Diagnostics:
The model diagnostics check whether these assumptions hold, and how serious the consequences are if one or more assumptions are found to be violated and what should be done in this situation. Currently, the focus is on testing the assumptions of normality and homoscedasticity.
-
Effect Size Measure for Model Effects and Coefficients
Use Cases
The following two use cases show how the IBM SPSS LE model can perform predictions in the Watson Studio notebook using kernel Scala 2.11 with Spark 2.1. Similar predictions could also be done with IBM SPSS Modeler or IBM SPSS Statistics; details can be found from the link in the "SPSS LE Available in" section below.
Use Case 1: Forced entry linear modeling
Descriptions for Use Case
Tony is a data analyst in a company. He wants to analyze the factors affecting the salary of their employees in order to help the HR department to build a more reasonable compensation evaluation. He selects the IBM SPSS Linear Engine model for this analysis(Employee_data.csv)
Data Preparation
He uses the “enrich” utility for data preparation (generation of metadata, statistics). The enrich method can be used to discover more metadata information for each field from the original DataFrame.
import com.ibm.spss.ml.utils.DataFrameImplicits._
val df_enriched = df.enrich

df_enriched.show(5)
df_enriched.printSchema
Input Data Schema
The data(Employee_data.csv) includes following fields.
id: Employee Code, long
gender: Gender, string
bdate: Date of Birth, string
educ: Educational Level (years), long
jobcat: Employment Category, long
salary: Current Salary, long
salbegin: Beginning Salary, long
jobtime: Months since Hire, long
prevexp: Previous Experience (months), long
minority: Minority Classification, long
Build the LE Model
The following code shows how to build an LE model with Scala. He selects "salary" as the target, selects several predictors which he thinks are important in affecting the salary. See InputFieldList in the source, including: "salbegin", "jobtime", "jobcat", "gender", "educ", "prevexp".
import com.ibm.spss.ml.classificationandregression.LinearRegression

val le = LinearRegression().
  setTargetField("salary").
  setInputFieldList(Array("salbegin", "jobtime", "jobcat", "gender", "educ", "prevexp"))

val leModel = le.fit(df_enriched)
The Linear Engine generates PMML and StatXML files containing model information, estimation results, and output related information. Use the following code to get PMML and StatXML:
val PMML=leModel.toPMML
val StatXML=leModel.statXML
Evaluate the Model
Tony uses the Model Viewer API of Watson Studio to evaluate the effectiveness of the model. Before invoking ModelViewer, a project token need to be inserted.
import org.apache.spark.sql.SQLContext;
import com.ibm.spss.ml.classificationandregression.LinearRegression;
import com.ibm.spss.scala.ModelViewer;

val html = ModelViewer.toHTML(pc,leModel)
kernel.magics.html(html)
From the Model Viewer output, Tony can see the model accuracy, residuals and other model related information to check if the model is good or not requiring him to rebuild model if necessary.

Predictor Importance
He uses the predictor importance API to check which predictors impact the target the most:
import com.ibm.spss.ml.utils.PredictorImportance

val pmml=leModel.toPMML()
val pi = PredictorImportance(pmml)
val piModel = pi.fit(df_enriched)
val piPMML =  piModel.toPMML()

print(piPMML)
Then from the PMML for predictor importance, he can find that "salbegin" has the biggest impact on the target "salary".

Prediction
Tony makes predictions with the following source code. Here we use the same training data to create an example, actually it will be the new data to be predicted.
val predictions = leModel.transform(df_enriched)

predictions.show(5)
predictions.printSchema
We can see the prediction results from the scoring output:

Details can be checked from the notebook LE-use-case1.
Use Case 2: Automatic linear modeling
Descriptions for Use Case
Richard is a data scientist in an airport. He wants to analyze the factors affecting the overall satisfaction of the customers, thus he builds a linear model using a particular set of predictors for a satisfaction survey data set (SFO_Survey.csv).
He is an experienced data scientist and will use Watson Studio notebook for analysis, which is based on the SPSS Linear Engine Scala APIs in Spark.
Data Preparation
He uses the “enrich” utility for data preparation and sets the target/input.
import com.ibm.spss.ml.utils.DataFrameImplicits._
val inputs = Array("TERMINAL","AIRLINE","FLIGHT", "FORMOFTRANSPORTATION", "AIRPORTCLEANLINESS", "BOARDINGAREACLEANLINESS", "RESTAURANTCLEANLINESS", "RESTROOMCLEANLINESS", "RESTAURANTPURCHASE", "RETAILPURCHASE", "OverallCleanliness")
val target = "OverallSatisfaction"
val df_enriched = df.enrich.setRole(Array("OverallSatisfaction"), "target", true).
setRole(inputs, "input", true)
df_enriched.printSchema
df_enriched.schema.foreach { x => println(x.metadata.toString()) }
Input Data Schema
The data(SFO_Survey.csv) contains more than fifty fields. He selects a subset of the following fields as inputs which may impact satisfaction.
TERMINAL: terminal, string
AIRLINE: airline, string
FLIGHT: flight, long
FORMOFTRANSPORTATION: form of transportation, string
AIRPORTCLEANLINESS: airport cleanliness, string
BOARDINGAREACLEANLINESS: boarding area cleanliness, string
RESTAURANTCLEANLINESS: restaurant cleanliness, string
RESTROOMCLEANLINESS: restroom cleanliness, string
RESTAURANTPURCHASE: restaurant purchase, string
RETAILPURCHASE: retail purchase, string
OverallCleanliness: overall cleanliness, double
Build the LE Model
Richard specifies the “forward stepwise” option in the model selection (default) setting and uses "OverallSatisfaction" as the target field:
import com.ibm.spss.ml.classificationandregression.LinearRegression

val le = LinearRegression().
  setTargetField(target).
  setInputFieldList(inputs)

val leModel = le.fit(df_enriched)
Evaluate the Model
He evaluates the model from the Model Viewer output below:

Predictor Importance
From the output PMML of the predictor importance below, the input predictor "RESTAURANTPURCHASE" has the biggest impact on "OverallSatisfaction".

Prediction
Richard makes predictions with the following source code. Here he uses the same training data for scoring.
val predictions = leModel.transform(df_enriched)

predictions.select("TERMINAL","AIRLINE","FLIGHT", "FORMOFTRANSPORTATION",
                   "AIRPORTCLEANLINESS", "BOARDINGAREACLEANLINESS",
                   "RESTAURANTCLEANLINESS", "RESTROOMCLEANLINESS",
                   "RESTAURANTPURCHASE", "RETAILPURCHASE", "OverallCleanliness","OverallSatisfaction","Prediction").show(5)
predictions.printSchema
He can see the prediction results from the scoring output:

Details can be checked from the notebook LE-use-case2.
SPSS LE Available in
Product Integration with UI
Spark and Python API
Learn More
Micro-class video of Linear Regression introduction to University channel, main contents
-
SPSS Linear Regression extended introduction.
-
Usage case demo for employee salary analysis and customers satisfaction analysis.
#GlobalAIandDataScience#GlobalDataScience