In the last blog, Alex obtained the causal relationships and potential impact predictors for the metrics of interest among all of the KPIs in his company through the TCM modelling algorithm in IBM SPSS Statistics. Based on the causal models, Alex found that KPI_25(cost) and KPI_4(sales) are valuable to make decisions for the target field KPI_2(profit). However, he found that it was not enough to just do that deep analysis, Alex also wants to know how KPI_2(profit) will trend in the future, which is also called Forecasting. Determining how KPI_2(profit) will change with changes in KPI_4(sales) and KPI_25(cost) is also known as “what-if” analysis. The IBM SPSS TCM algorithm provides both Forecasting and Scenario Analysis to perform these analyses.
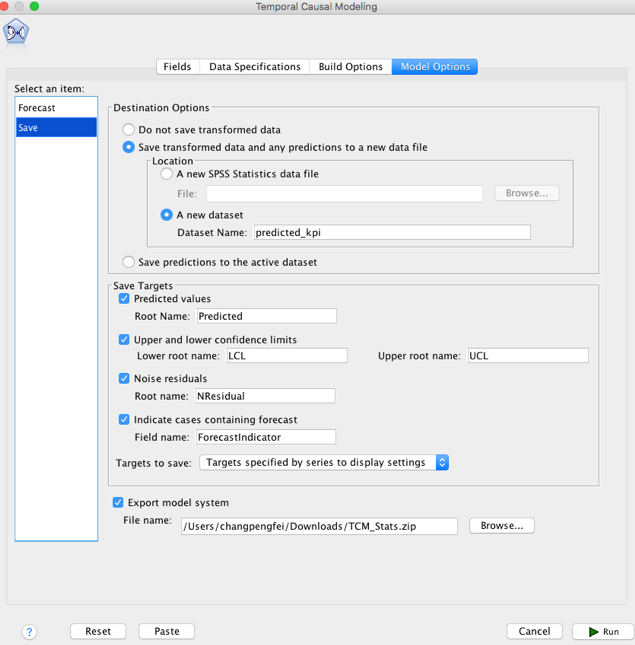
Alex still uses IBM SPSS Statistics to continue his analysis. First, he saves the built model to TCM_Stats.zip in the “Model Options” tab which will be used to do the prediction and the scenario analysis in the next step. Meanwhile, Alex also saves the predicted values with the upper and lower confidence limits to a new dataset named predicted_kpi, which helps him to review the detailed fit results.
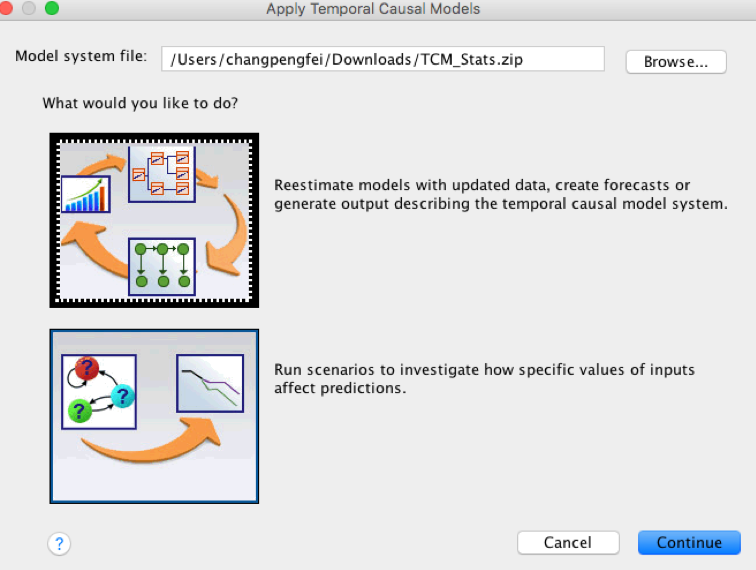
After saving the TCM modes, Alex selects “Apply”-> “Forecasting” ->“Apply Temporal Causal Models” and inputs the saved “TCM_Stats.zip” file.
 Here, there are two options to do the next analysis. The first one is used for forecasting and the next one is for scenario analysis.
Forecasting
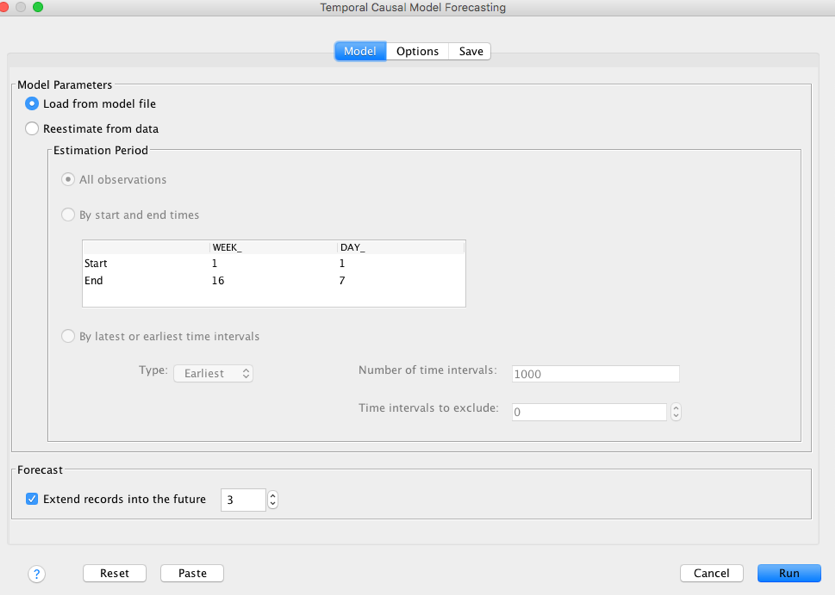
First, Alex chooses the forecasting option to see the predicted KPI_2(profit) values for the next 3 days. For simplicity, the kpi data from the model building is still used to do the prediction. In the Model option, Alex sets the “Extend records into the future” to be 3 which means TCM will forecast the next 3 days into the future.
After saving the predicted data, Alex gets all the fitted values and predicted values for KPI_2, which is helpful for the report and visualization.
 WEEK_ and DAY_ are two time variables generated by the date and time definition function. It means the data has a Weekly time interval where there are 7 days in a week. The next 3 days are WEEK_ 17 and DAY_ 1,2,3 respectively.
Scenario Analysis
The next step is to do the scenario analysis for these 3 predicted values to see how the predictors will affect them. In this step, Alex chooses the option to see how the KPI_4(sales) and KPI_25(cost) will affect the prediction. In scenario analysis, there are two required settings, “Scenario Period” and “Scenarios”.
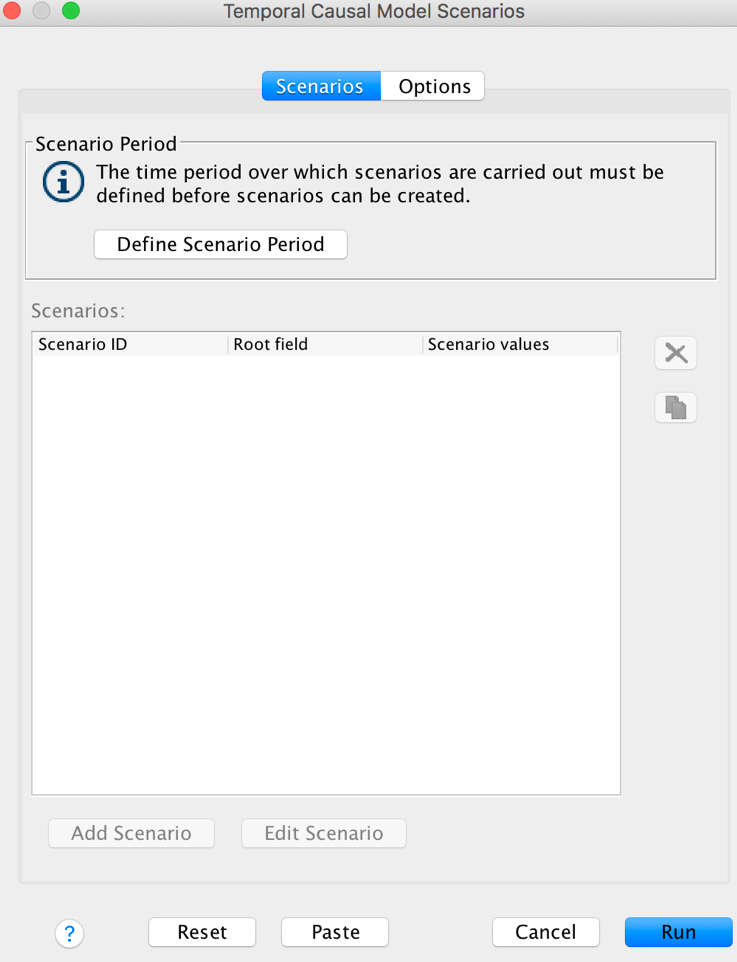
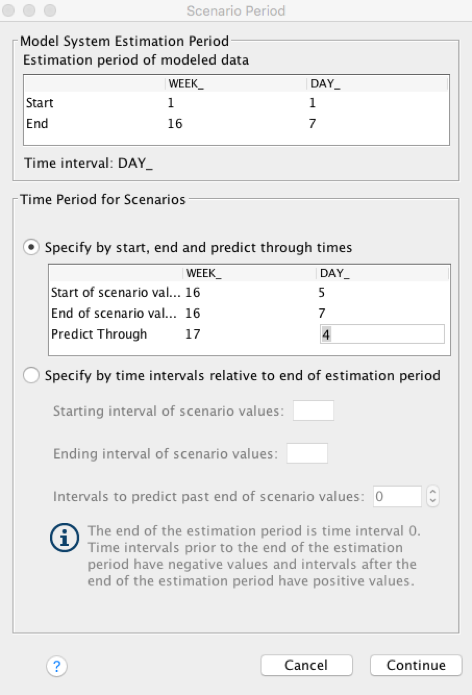
There are 3 basic settings that should be set in the scenario period. The start and end define a time interval where the values will be changed to the specific values. The “Predict Through” specification means the furthest affected time point by the changed values.
Here, Alex sets the last three time points to be the scenario interval, that is to say the start time of the scenario interval is 16 WEEK_ and 5 DAY_. Meanwhile, the end time is 16 WEEK_ and 7 DAY_. Because in the TCM algorithm, the furthest affected time point is exclusive, to see the scenario analysis for the next three time points, Alex sets the predict through to be 17 WEEK_ and 4 DAY_.
Scenario definition is used to configure the scenario. The root field is used as the root cause which will be changed in the scenario period. First, Alex wants to see how the KPI_2(profit) will change with KPI_4(sales) increasing. He sets KPI_4(sales) to be the root field and KPI_2(profit) to be the affected target.
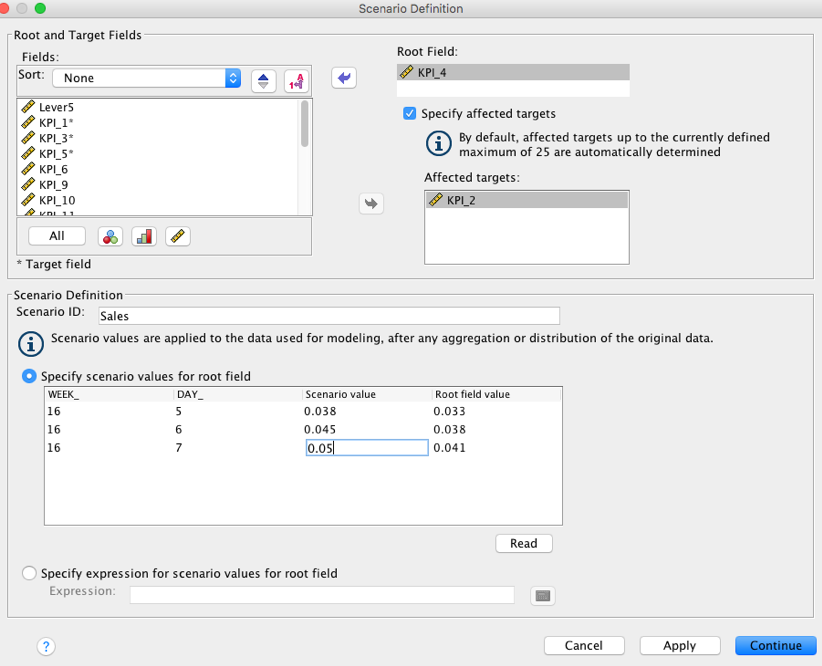
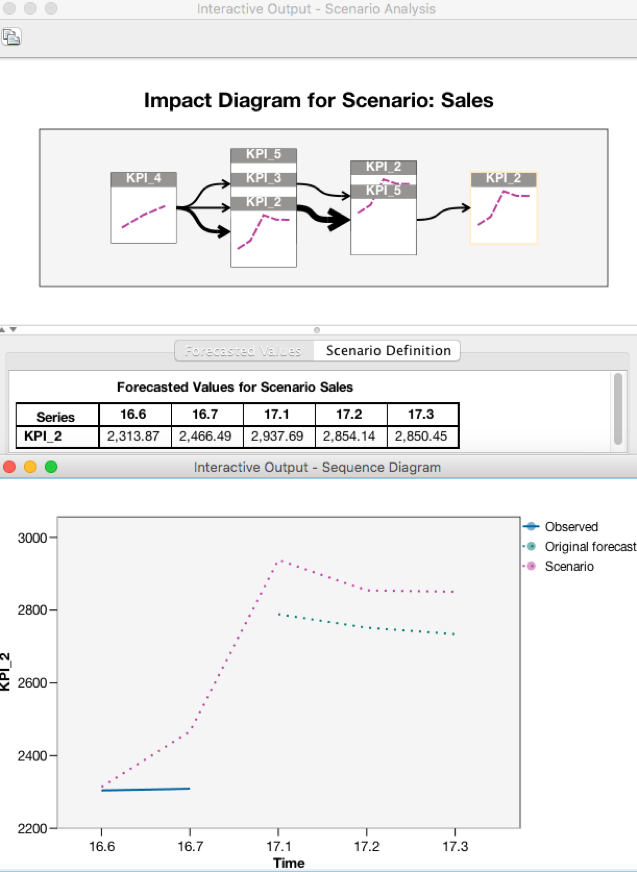
In "scenario value", Alex increases the value from 15% to 22% compared with the root field value. Now, the values in the scenario time interval have been changed to these increased values. After the scenario process for the KPI_4(sales), Alex gets the forecasted values in the whole scenario time period. From the impact diagram, Alex finds that KPI_4(sales) will not only affect the KPI_2(profit) directly but will also affect KPI_2 through KPI_5 and KPI_3.
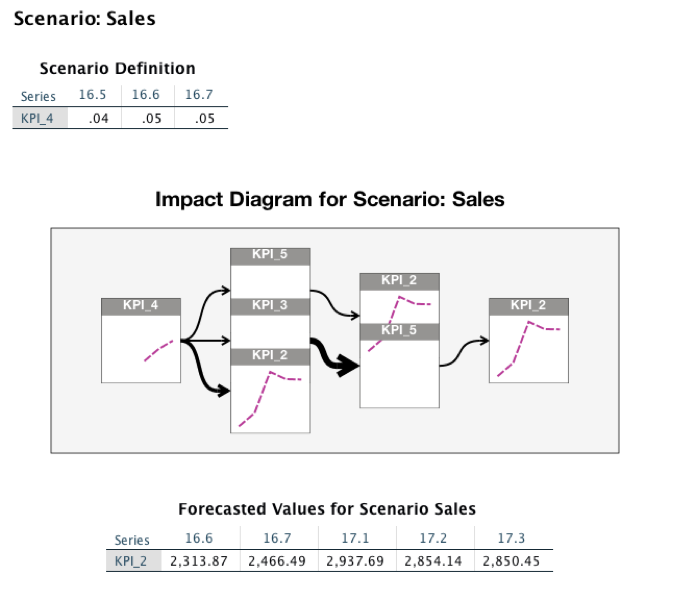
In the interactive output window, Alex sees the forecast values for the scenario’s Sales increases compared with the observed and original forecasted values, which means the KPI_2(profit) will increase with increasing KPI_4(sales).
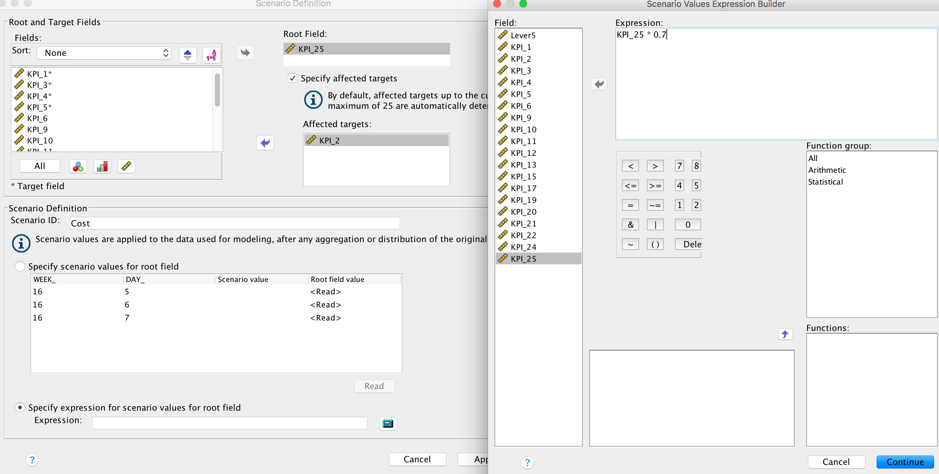
Next, Alex defines another scenario to see how the KPI_2(profit) will change with KPI_25(cost) decreasing. He sets KPI_25(cost) to be the root field and KPI_2(profit) to be the affected target. Here, Alex uses the expression to set the scenario values for the root field. He decreases the KPI_25(cost) by 30% to see how profit will change.
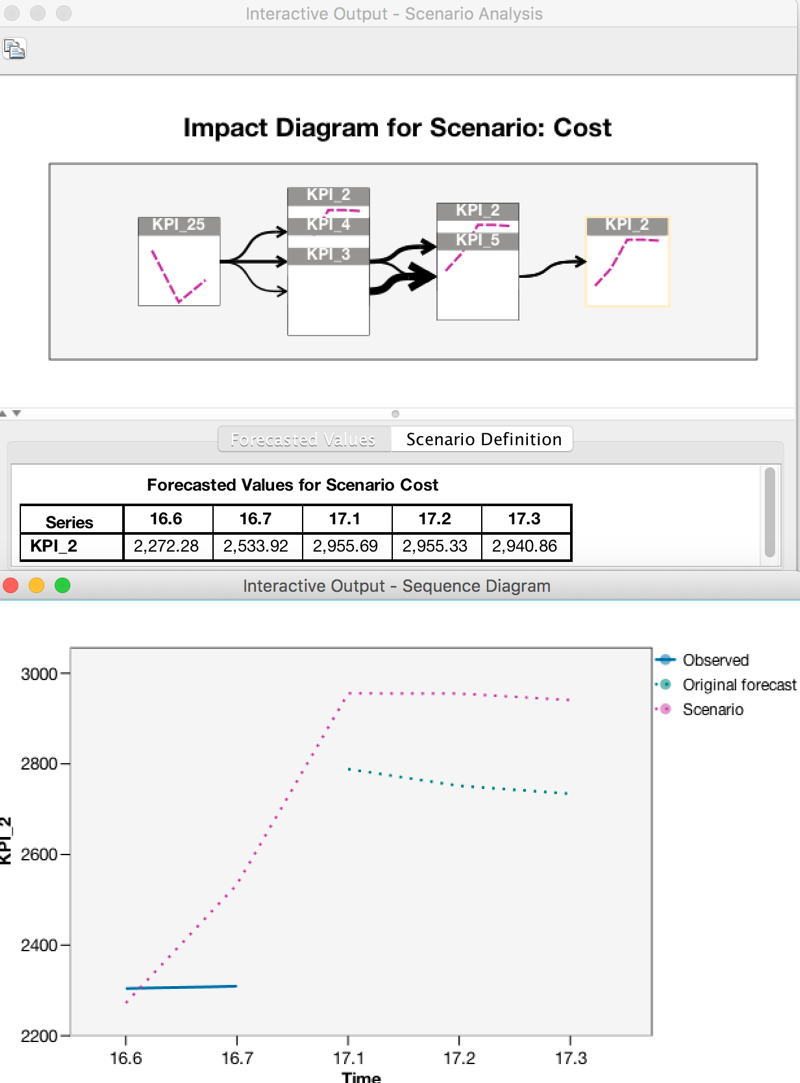
After the scenario process for the KPI_25(cost), Alex finds that KPI_25(cost) will not only affect KPI_2(profit) directly but also affect KPI_2 through KPI_4, KPI_5 and KPI_3.
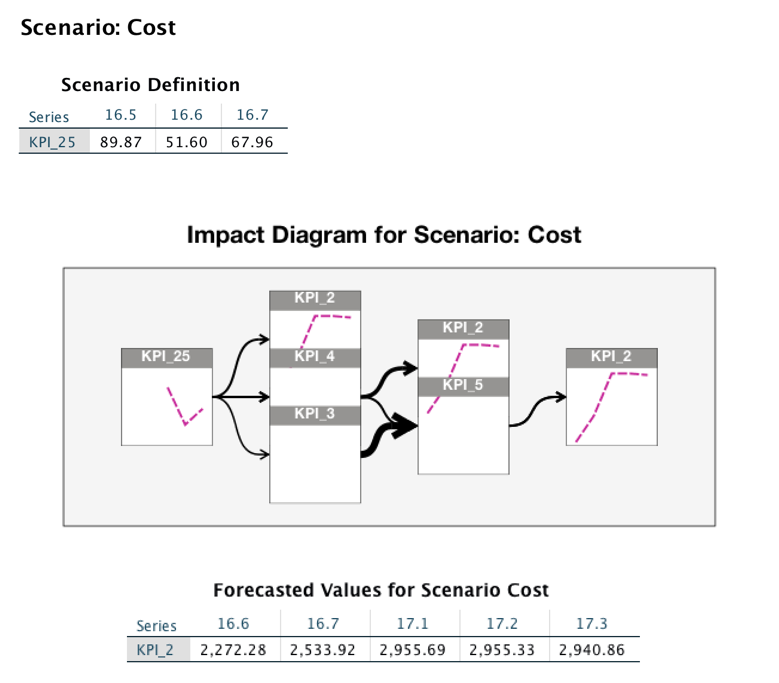
In the interactive output window, Alex sees the forecast values for the scenario’s Cost increases compared with the observed and original forecasted values, which means that KPI_2(profit) will increase with decreasing KPI_25(cost).
At this point, Alex has finished all of his analysis by the use of the IBM SPSS TCM algorithm. He gets all of the causal relationships among all of the time series he is interested in and finds all the potentially impacting predictors for the target KPI_2. Based on the causal models, Alex found that KPI_4 and KPI_25 are the two most important predictors for KPI_2. In addition, he obtained the predicted future values which will be bery helpful in achieving his business plan as well as avoiding risk with this foresight. Through the powerful scenario analysis of TCM, Alex gets valuable projections in order to make prudent decisions. On one hand, the profit will increase with increasing sales. On the other hand, profit will increase with decreasing cost by 30% . Alex can now focus on how to increase sales and decrease cost in the company.
Where can you get the SPSS TCM?
Product Integration with UI
Harvested in the Product
- IBM Watson Studio, all the SPSS algorithms are available in the Watson Studio (DSX). To do so, follow the Watson Studio (DSX) access policy.
API Documentation for Spark and Python
- You can get the API Documentation for Spark and Python Here.
Notebook
I also wrote a notebook using Scala for this use case, you can try it in the IBM Watson Studio .
#GlobalAIandDataScience#GlobalDataScience