Today we are proud to announce the general availability of IBM SPSS Statistics 28. This release introduces new statistical tests, enhancements to existing procedures and functional enhancements that will improve everyday usability. As part of the release, we will be holding a Tech Talk series which will cover some of the new features and functionality.
Below is an overview of What’s New in SPSS Statistics 28:
- New Statistics: Meta-analysis
- Procedure Enhancements: Power Analysis, Ratio Statistics, and more
- Data Visualization: Relationship Maps
- Everyday Usability Improvements: Statistics Workbook, Search, Table Side-Pane Editor, High Contrast Support
New Statistics
Meta-analysis
- Meta-analysis of continuous outcomes: Raw data, pre-calculated effect size data
- Meta-analysis of binary outcomes: Raw data, pre-calculated effect size data
- Meta-regression
Meta-analysis constitutes a scientific process to synthesize and combine results across different research studies. It can provide systematic reviews on the magnitude of the effect sizes as well as the causes of potential variation. The methods of meta-analysis have also been expanded to the heterogeneity tests, publication bias assessment, evaluation of small study effects, and meta-regression. Various charts and plots available in meta-analysis are broadly used in data visualization, result summary, and bias illustration.
Procedure Enhancements
Power Analysis
IBM SPSS Statistics 28 includes an enhancement to the Power Analysis procedures to create a graphical representation of results. Power analysis plays a pivotal role in a study plan, design, and conduction. The calculation of power is usually before any sample data have been collected, except possibly from a small pilot study. The precise estimation of the power may tell investigators how likely it is that a statistically significant difference will be detected based on a finite sample size under a true alternative hypothesis.
All of the Power Analysis procedures now allow the user to enter a series of power values rather than a single one. These can take the form of separate (point) values, a series of values incremented by a specific amount, or a combination of both. This enhancement now results in a table of power values and, optionally, an accompanying power curve graph.
Ratio Statistics
The RATIO STATISTICS procedure in IBM SPSS Statistics has long been a convenient option for obtaining descriptive statistics on ratios of two variables, as well as the go-to procedure for property assessment professionals, whose work involves working with ratios of property assessment values to sales prices. In the time since the original procedure was implemented, changes in thinking about the use of some statistics in property valuation have occurred, and in Version 28, the RATIO STATISTICS procedure has been enhanced to make it more consistent with the current thinking, as described in the Standard on Ratio Studies document published by the International Association of Assessing Officers.
The most important change to the procedure is the addition of the coefficient of price-related bias (PRB) and an associated confidence interval. The PRB is an index of whether assessment to price ratios are systematically higher or lower for higher-priced properties. It is calculated by regressing percentage differences in assessment ratios from the median ratio on the base 2 logarithms of value proxy measures calculated as the averages of sales prices and the ratios of assessed values to the median ratio, and gives the percentage change in assessment ratios for a 100 percent change in value. This newly available measure is selected by default in the Statistics dialog when using the graphical user interface to the procedure, which is accessed via Analyze>Descriptive Statistics>Ratio.
Other changes include removing the coefficient of variation based on the median ratio from the Statistics dialog options, relabeling the remaining coefficient of variation option based on the mean ratio as COV, as is common usage, and adding the option in the main Ratio Statistics dialog to include the number of cases or properties on which statistics are based in the output table, instead of only offering that in a saved output file.
Other Procedural Enhancements
A new graphical user interface control was designed GLM and UNIANOVA. Specifically, an additional checkbox "Compare simple main effects" was added to the "EM Means..." sub-dialog to support the specification of comparisons among the main effects nested within the levels of other factors.
Adjustments were made to "Change Contrast" in the LOGISTIC REGRESSION and COXREG dialogs in terms of:
- Changed from Last to First for the default reference category specification for contrast types that use reference category specifications (Indicator, Simple, and Deviation).
- Swapped the positions of the Last and First buttons
- Added "(last)" to the listing of variables in the Categorical Covariates target list.
In prior versions users were able to run a two-sided T-Test, but additional calculations were necessary to get output for a one-sided T-Test. Users often were left to reference an IBM Tech Note to get the results they required for a one-sided T-Test. Starting with V28 Beta, users will be able to run a one-sided T-Test through the dialogs.
Data Visualizations
Relationship Maps
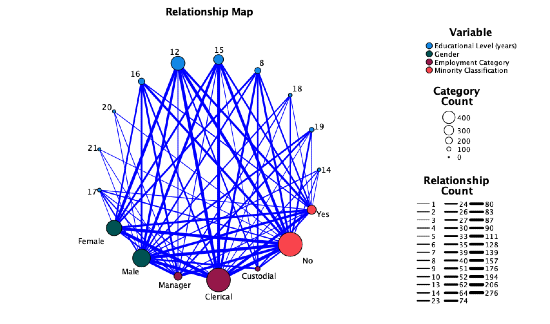
Relationship Maps are introduced as a new data visualization in SPSS Statistics 28. Users are now able to visually inspect the relationship across multiple variables as shown by the thickness of the connections and size of the categories indicator. This function can be found in the Graphs dropdown menu and will reference data within the active dataset.
Usability Improvements
Statistics Workbook
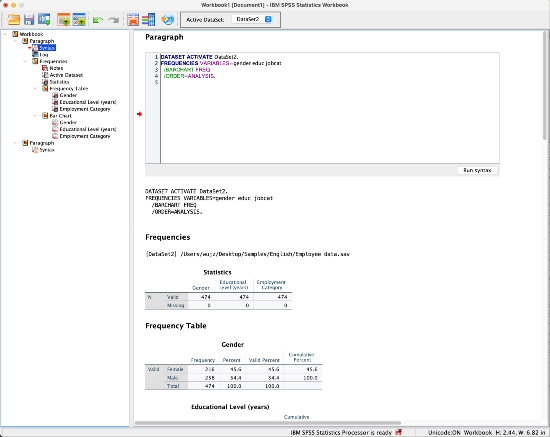
The Statistics Workbook combines multiple file types into one. Users will be able to write syntax, create output, and edit that output all in the Workbook for an interactive way to run data analysis.
Accessing the Workbook: After the initial installation of the product, the view will be in 'Classic (Syntax & Output)' mode. This can be seen in Edit -> Options -> Application Mode located at the top of the Options view. To switch the mode, select 'Workbook' and click 'OK'. There will be a warning dialog to remind users to close all open syntax and output documents before switching modes. To create a new Workbook, go to File -> New and select 'Workbook'.
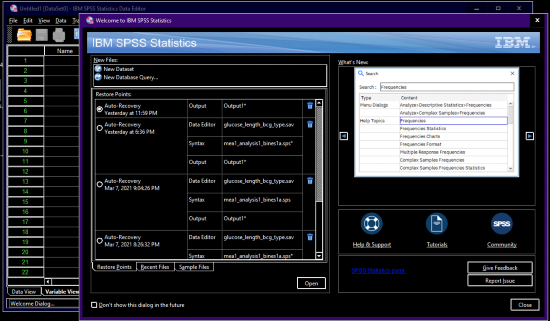
Search Enhancements
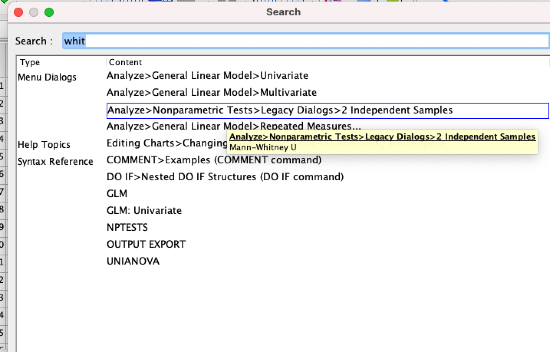
Search functionality first introduced in version 27 is enhanced in SPSS Statistics 28. A search icon is in the upper right corner of the Data, Syntax and Output windows. Click the icon to enter search terms. Search results will include links to menu dialogs, help topics, case studies and syntax references. Clicking a search result will take you directly to the relevant procedure dialog, help topic, case study, or syntax reference topic. Deeper levels are now extracted via robust alias search terms and text from within dialogs.
Side-Pane Table Editor
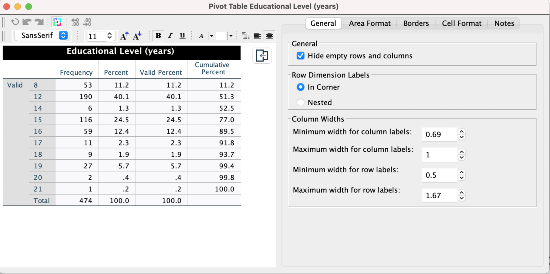
Table editing in V28 now introduces a more efficient process for users to get the output they desire in their tables. Upon double click on output the editor mode now displays a side panel that brings in functionality found in the Cell Properties and Table Properties drop downs from the Format menu. In a reduced number of clicks, users can now edit their tables using the side pane, and those changes will be reflected in the table view to the left of the pane.
High Contrast Accessibility
Accessibility support for high contrast was added in SPSS Statistics 28. On Windows, after a user selects High Contrast mode and opens SPSS Statistics, the view in SPSS Statistics will automatically display a high contrast mode. For Mac, if you want to use high contrast mode, open System Preferences, click Accessibility, then drag the Display contrast slider to adjust the display contrast.
Additional Product Information || Free Trial Offer
More information on SPSS Statistics, pricing and purchasing options. Access our no cost 30-day trial offer
If you'd like to purchase, or upgrade to SPSS Statistics 28 through an IBM Business partner please contact a partner from the following list: IBM SPSS business partner.
#Featured-area-1-home
#In-the-know-feature
#Highlights-home#News-DS#SPSSStatistics