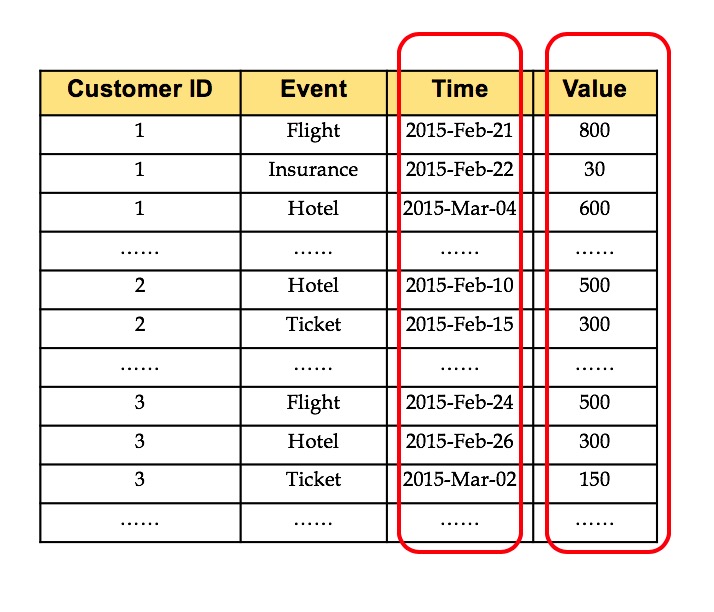
Advances in data collection and data storage technologies lead to the increasing availability of complex temporal data sets. Data instances are traces of entity behaviors that are characterized by the time series of events with single or multiple variables. This kind of data is event-based time series. The analysis of these temporal data is one of the most challenging topics in data mining research.
What is Event-Based Time Series
The event-based time series consist of one or more sequences of events that occurred at different time points. Each event is optionally linked to a numeric value. The time points are unevenly spaced, that is to say, the time spaces between consecutive events are of arbitrary length.
 Event-based time series data can be collected from many industrial or scientific domains. In the previous data example, it shows online travel agency data. Each transaction record includes a customer ID number and the type of product booked online. A time stamp shows when a booking event happened, and a numeric value shows how much money this booking spent. Data with such characteristics can also be found in other cases. For a bank, customers can conduct different activities at different time points: withdraw, deposit, transfer, and so on. For a gas station, customer activities might include top-up, refilling, shopping, and so on. All these customer activities or events of can be represented in event-based time series data. So event-based time series pattern analysis might benefit enterprise in the gaining insight and understanding behavior, such as behavior prediction, demand shaping, personalized promotion.
Compared with traditional time series or sequence data, there are some challenges for event-based time series pattern analysis that is listed as the following:
- Different from sequence analysis in which only orders of events are mined. Event-based time series pattern analysis also needs to mine the time intervals between consecutive events.
- Event-based time series pattern analysis is interested in the values that are linked with events and their adjacent relationship rather than mining the events themselves.
To solve those challenges, IBM provides a Rare Pattern Identifier(RPI) Analysis algorithm that tries to discover rare temporal patterns in event-based time series data.
IBM SPSS RPI Analysis
IBM SPSS Rare Pattern Identifier(RPI) Analysis algorithm can discover rare temporal patterns in event-based time series data by accounting for two elements for each event: time interval and event value, which reveal the sequential relationship among adjacent events. Rare temporal patterns are discovered across all the entities, which might be used as a feature for customer segmentation or behavior prediction.
RPI Analysis can handle the following data:
- Consist of one or more series of events that occurred at different time points.
- Each series is unequally spaced time series.
- Each event might link with a numeric value.
RPI Analysis can provide the following information:
- Discretization rule for the linked values and time interval.
- Temporal patterns whose vertical support is below predefined threshold.
- Temporal patterns whose horizontal support and rate are above predefined threshold.
- Temporal features to characterize each entity.
- Interestingness for identified rare patterns, and entities with identified rare patterns.
Use Case
Bill administers a large website and he wants to detect potential network attacks targeted at his website. He learned from previous experience that rare patterns of user activity in the website might indicate network attacks.
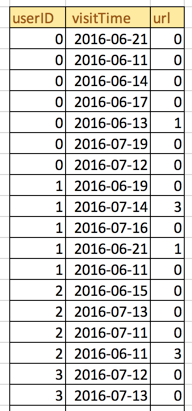
The data that he extracted from web server log file include the following information:
- There are millions of users to be analyzed.
- Each user has a sequence of transactional events.
- Each event data includes:
- userID: Identifier of user
- visitTime: the time user visit a URL
- url: encoded value of the URL

The characters of the data match the property of the event-based time series data.
Bill heard from his friend that RPI Analysis in IBM Watson Studio can help analyze this kind of data. He opened IBM Watson Studio site to start the analysis by using the following steps:
Step 1. Load Data
First Bill specified the data type for each field of the data, and loaded the data rpi_data.csv.
val schema = StructType(
StructField("CustomerID", StringType, true) ::
StructField("EventTime", DateType, true) ::
StructField("EventType", StringType, true) ::Nil)
val df = sparkSession.
read.
format("org.apache.spark.sql.execution.datasources.csv.CSVFileFormat").
option("header", "true").
schema(schema).
load("rpi_data.csv")
Step 2. Set Parameters and Run RPI Analysis
Then, Bill sets the entity id, event time, and event type field. He also sets the minimal level of pattern to 3 and maximal level of pattern to 5. He also sets the threshold of vertical support to 0.1, minimal frequency of rare pattern to 2, and minimal rate of rare pattern to 0.3.
import com.ibm.spss.ml.frequentpatternmining.rarepatternidentifier.RarePatternIdentifier
val rpi = new RarePatternIdentifier().
setEntityIDField("userID").
setEventTimeField("visitTime").
setEventTypeField("url").
setMaxVerticalSupport(0.1).
setMinPatternLength(3).
setMaxPatternLength(5).
setMinFreqOfRarePatternInEntity(2).
setMinRateOfRarePatternInEntity(0.3).
fit(df)
val patternXML = rpi.patternXML
In the setting, vertical support is the percentage of users that have a rare pattern. Rate is the percentage of the length of the rare pattern in all the events of a user.
Step 3. Check Result
Bill got the results as a pattern XML file. In the output pattern XML, he found the discretization information and rare patterns from the data.
- Discretization rule of time interval:

Time interval was split to 2 categories:
- Category 1: time duration within 1 day.
- Category 2: time duration greater than 1 day.
- Patterns with vertical support, confidence, maximal rate, and interestingness:

For pattern with id 1, it described a user who visits URL 1 four times within one day.

For user with ID 8:
- There is a rare pattern 0, the horizontal support (frequency of the pattern) of this pattern is 2. The rate of this rare pattern is 50%, and the interestingness of this rare pattern for user 8 is 0.25.
- There is a rare pattern 1, the horizontal support (frequency of the pattern) of this pattern is 3. The rate of this rare pattern is 60%, and the interestingness of this rare pattern for user 8 is 0.3.
- ……
With all these information, Bill can combine rare patterns and the structure of his website to do further analysis for potential network attacks.
Locating IBM SPSS RPI Algorithm
#GlobalAIandDataScience#GlobalDataScience