SAP systems, such as ECC and S4, contain a wealth of data that can be used for business intelligence and decision making. SAP tools and other classical BI tools are used to provide Business Intelligence. However, we would like to use data fabric and innovative technologies to show how to enable the power of the data we have in our source systems even more. Extracting, exploiting, and visualizing this data can be a daunting task for many organizations. In this article, we will show how IBM Cloud Pak for Data (CP4D) and OpenAI's ChatGPT can be used to simply move basic SAP reports into stunning and insightful visualizations.
For our example, we will use SAP purchasing data from an international automotive company and display the expenses and insights per zone and country on a world map.
1. The first step in this process is to extract data from SAP. IBM Cloud Pak for Data offers several options for connecting to and extracting data from SAP systems, such as exposing data from SAP ODP or tables or CDS using oData, directly connecting to database using SAP HANA connector or using ODBC. Other options include extracting tables via an ETL process or an ABAP job. For this proof of concept, we will be using a simple extraction of SAP tables as flat files csv - the main vendor and order header tables (LFA1 and EKKO).
2. The second step is to store the extracted data. IBM Cloud Pak for Data provides several options for storing data, such as Cloud Object Storage, DB2 and Neteza or to connect to other storage like Amazon S3 and more. In this proof of concept, we will be using Cloud Object Storage and storing the data in a bucket, which acts as a data lake.
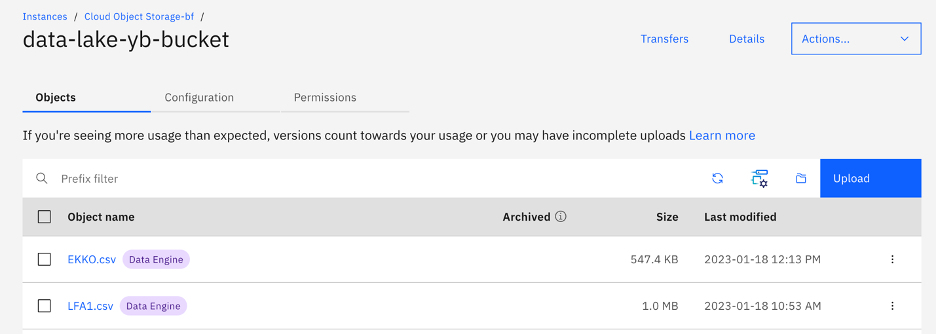 Figure 1 - Cloud Object storage bucket
3. The third step is to give the possibility to data scientists to query the data in a simple SQL way. For that we are using the Cloud Data Engine (SQL query engine) on IBM Cloud Pak for Data. This feature allows simple and efficient querying of data from a variety of sources such as databases, flat files, APIs, and more, regardless of the format or location of the data. Additionally, this step also includes the option to directly virtualize data, such as by connecting to the HANA database, using the Virtualization feature of Cloud Pak for Data. This allows to access and analyze data without replication. Bellow, an example of query using the Engine.
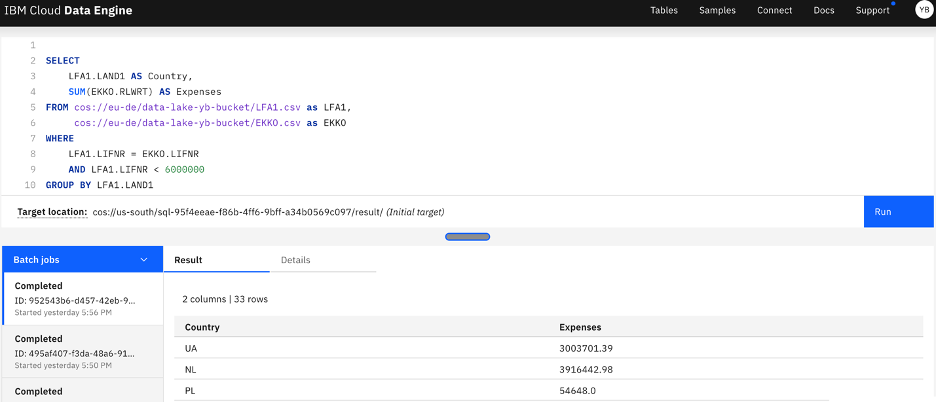 Figure 2 - Cloud Data Engine query and result
4. Next, we create a project on IBM Cloud Pak for Data that includes a connection to the Cloud Data Engine and the ability to query any data in the bucket thru SQL queries. This allows users to easily access and analyze the data stored in our data lake.
 Figure 3 - CP4D project
We then create a Jupyter notebook within the project on CP4D Python environment, to query data via the connection to the Cloud Data Engine and display it on a dynamic Folium map. This step also includes the use of the python libraries like folium, geopy and pycountry to enhance the map visualization. This enables a more intuitive and user-friendly way to visualize and interact with the data.
Do you need to be a python guru for this step? Not at all, if you don't have much experience with Python... use the technology in the title .
So first bellow, we query the purchase expenses per country:
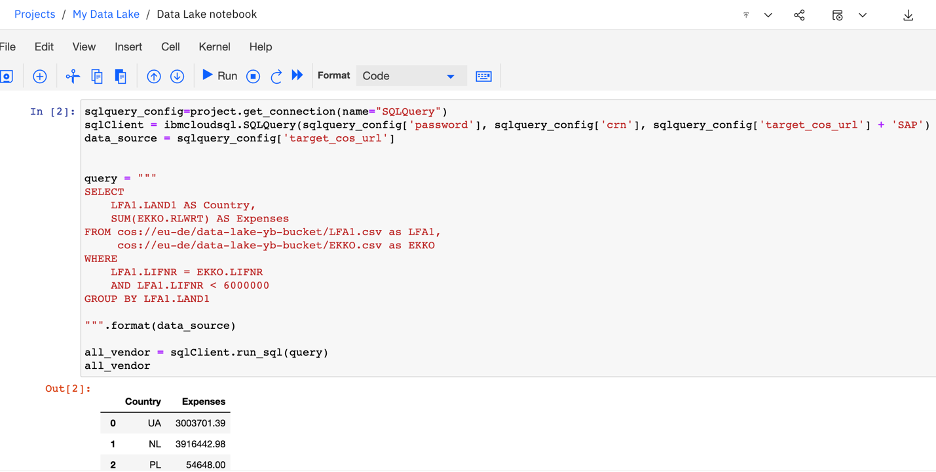 Figure 4 - Jupyter Notebook using cloud engine to query any data in the bucket
And then we display the expenses per countries on a dynamic world map using folium and this is the result, colors representing the expense level:
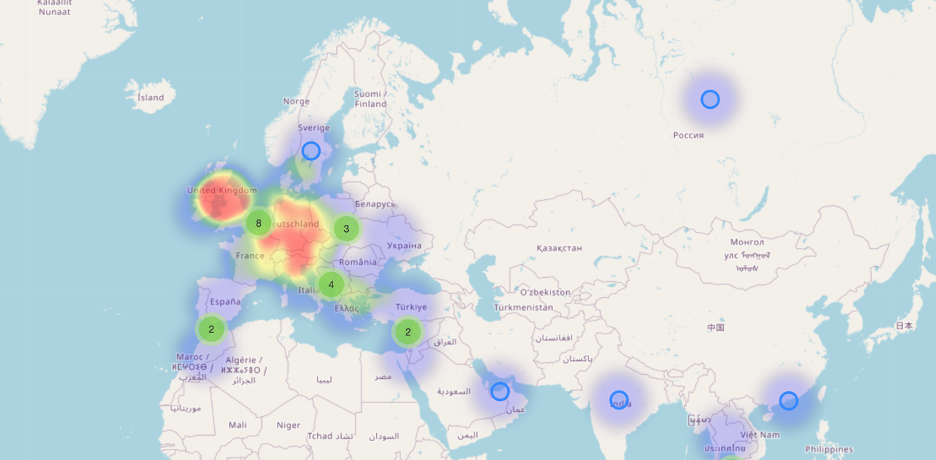 Figure 5 - Folium Heatmap based on company expenses
Now for more Insights!
We will add a simple text summary of the data in natural language on the Folium map. In our case, the summary is of an automotive company's purchases per country division, highlighting certain information that we ask ChatGPT. This step is achieved by using OpenAI's API, which takes the purchase data from the query on our data lake and generates the summary. This allows for a more comprehensive understanding of the data in natural language. Bellow, the API request.
 Figure 6 - OpenAI API to provide summary of our query results into natural language
And finally the response result on the map.
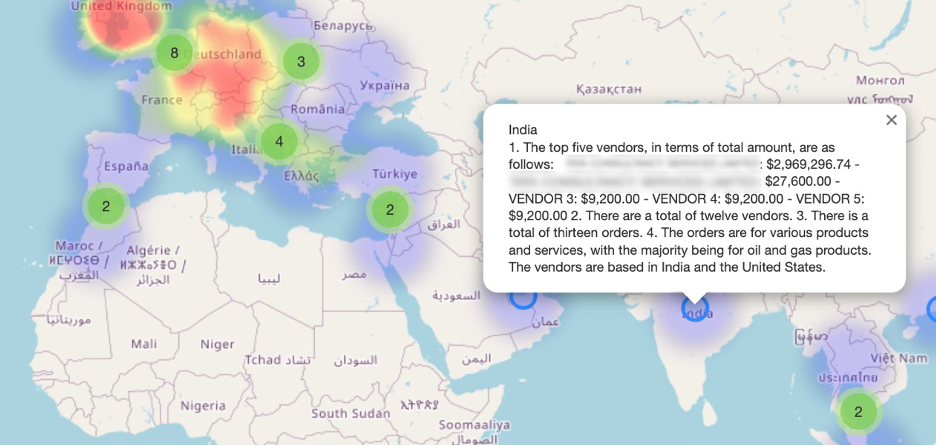 Figure 7 - Folium Map showing OpenAI ChatGPT query result
Instead of using Jupyter notebook, we could have also used other services like IBM Dashboards, Cognos, and others available on Cloud Pak for Data.
In conclusion, we demonstrates how IBM Cloud Pak for Data and OpenAI can be used to turn SAP data into stunning visualizations with great insights.
With the ability to connect and extract data from SAP systems, store the data in a data lake, and query and visualize the data using various features of Cloud Pak for Data, organizations can gain valuable insights from their SAP data.The data lake created in this process allows for more efficient querying and visualization of data, making it easier for organizations to understand and act on their SAP data. The use of Python libraries and OpenAI API also add an additional layer of user-friendliness and comprehensive understanding to the data.
Overall, this proof of concept showcases the potential for IBM Cloud Pak for Data and OpenAI to revolutionize the way organizations handle and utilize their SAP data.
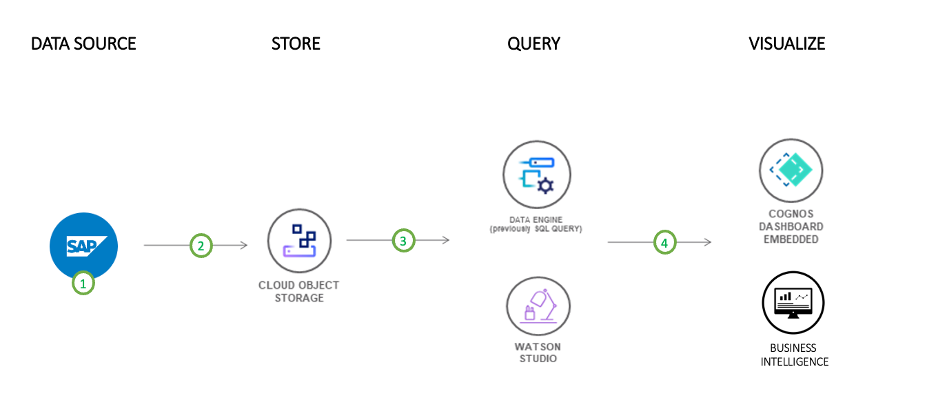 Figure 8 - Full Process
Some Interesting links:
Build your data lake with IBM CP4D - https://cloud.ibm.com/docs/solution-tutorials?topic=solution-tutorials-smart-data-lake
Expose SAP ODP via Odata - https://blogs.sap.com/2020/11/02/exposing-sap-bw-extractors-via-odp-as-an-odata-service/
IBM CP4D free trial - https://dataplatform.cloud.ibm.com/registration/stepone?context=cpdaas&apps=all
#datalake #SAP #openAI #chatGPT #SQL #S4HANA #dataFabric #businessanalytics #CloudPakforData #dataextraction
#Highlights-home#Highlights