- Confirm whether it’s a true performance problem
- Cloud Pak for Data Application level analysis
- Infrastructure level analysis
As the subsequent of it, we'll introduce the
Advanced cluster-level analysis in details in this article.
Advanced cluster-level analysis
Cluster-level metrics under monitor from the OpenShift Container Platform (OCP) console
- Additional level of details from the Grafana dashboards via OCP console
- Targeted monitoring using customized queries from Prometheus UI.
In the use case about 30 concurrent users running 30 Notebooks in a workshop. For Notebook to run, there will be dynamic pods allocated along the run. So, the monitoring of the resource reservation and resource usage per node level is needed. And the key part for dynamic pod allocation are resource reservation. This requires advanced cluster-level analysis as follows.
- Whether cluster has sufficient idle resource for 30 notebook dynamic pods to start
- Monitor node level Request vs Capacity %
- Whether cluster has sufficient resource to allow 30 concurrent user to run
- Monitor node level Usage vs Capacity %
- Whether there are sufficient CPU & memory from static pods which are shared by the 30 concurrent users.
- Monitor pod level CPU usage vs limit and Memory usage vs limit
- Whether namespace quotas are configured properly.
- Monitor namespace level CPU request vs limit and Memory request vs limit
- Monitor namespace level CPU usage vs limit and Memory usage vs limit
There are Prometheus queries which could quickly get information for the above cluster-level analysis.
Monitor node level Request vs Capacity %
Per Node level : CPU request vs capacity %
100*(
sum by (node) (
(sum by (node, pod,namespace) (kube_pod_container_resource_requests_cpu_cores))
* on (pod,namespace) group_left()
(sum by (node, pod,namespace) (kube_pod_status_phase{phase=~"(Running).*"} == 1))
)
/
sum by (node) (kube_node_status_allocatable_cpu_cores)
)
Per Node level: Memory request vs. capacity %
100*(sum by (node) (
(sum by (pod, node,namespace) (kube_pod_container_resource_requests_memory_bytes))
* on (pod,namespace) group_left()
(sum by (pod, node,namespace) (kube_pod_status_phase{phase=~"(Running).*"} == 1))
)
/
(sum by (node) (kube_node_status_allocatable_memory_bytes)))
Monitor node level Usage vs Capacity %
Per Node level: CPU usage vs capacity %
100*(sum (node_namespace_pod_container:container_cpu_usage_seconds_total:sum_rate) by (node)/(sum(kube_node_status_allocatable_cpu_cores) by (node)))
Per Node level: Memory usage vs capacity %
100*(sum(container_memory_usage_bytes{container!=""}) by (node)/sum (kube_node_status_allocatable_memory_bytes) by (node))
Note:
If the workloads are unevenly distributed within the cluster, and some balancing work should be done to allow effective use of the full cluster capacity.
Monitor pod level CPU usage vs limit and Memory usage vs limit
CP4D Pod level CPU usage vs. limit
100*(sum by (pod) (pod:container_cpu_usage:sum{namespace="zen"}) / (sum by (pod) (kube_pod_container_resource_limits_cpu_cores{namespace="zen"})))
Note: zen is the namespace for CP4D application. Change it accordingly based on your deployment
CP4D Pod level Memory usage vs. limit
100*(sum by (pod) (container_memory_working_set_bytes{image!="", namespace="zen"})
/
sum by (pod) (kube_pod_container_resource_limits_memory_bytes{namespace="zen"}))
Note: zen is the namespace for CP4D application. Change it accordingly based on your deployment
OOMKilled Pod
kube_pod_container_status_last_terminated_reason{namespace="zen", reason ="OOMKilled"}==1
Note: zen is the namespace for CP4D application. Change it accordingly based on your deployment
Restarted pods
(kube_pod_container_status_restarts_total{namespace='zen'}>0)
To evaluate whether the cluster has sufficient resource or not
Run single user of the notebook, and find out how many new pods are created and how much resource are reserved and used during the notebook run.
Check new pods
oc get pod -o wide -n namespace
Describe new pods to check Request/Limit of the new pods:
oc describe pod-name -n namespace
Monitor pod usage:
oc adm top pod --all-namespaces | grep pod-name
Or use prometheus query to check usage and limit.
CPU usage vs limit.
100*(sum by (pod) (pod:container_cpu_usage:sum{namespace="zen",pod=~".*(podnames-substring).*"}) / (sum by (pod) (kube_pod_container_resource_limits_cpu_cores{namespace="zen"})))
Note: zen is the namespace for CP4D application. Change it accordingly based on your deployment
MEM usage vs limit.
100*(sum by (pod) (container_memory_working_set_bytes{image!="", namespace="zen",pod=~".*(podnames-substring).*"}) / sum by (pod) (kube_pod_container_resource_limits_memory_bytes{namespace="zen"}))
Monitor namespace level quota settings
oc get quota -A -o yaml
Sample output:
cpd-01 quota:
Name: compute-resources
Namespace: cpd-01
Resource Used Hard
-------- ---- ----
limits.cpu 354700m 600
limits.memory 566884Mi 1600Gi
requests.cpu 44155m 400
requests.memory 212112Mi 1200Gi
requests.nvidia.com/gpu 0 4
cpd-02 quota:
Name: compute-resources
Namespace: cpd-03
Resource Used Hard
-------- ---- ----
limits.cpu 123750m 200
limits.memory 317716Mi 699Gi
requests.cpu 31045m 133
requests.memory 63222Mi 466Gi
cpd-03 quota:
Name: compute-resources
Namespace: cpd-04
Resource Used Hard
-------- ---- ----
limits.cpu 430550m 600
limits.memory 1133166Mi 1500Gi
requests.cpu 147425m 300
requests.memory 483474Mi 2000Gi
requests.nvidia.com/gpu 0 4
……….
In the case where the total capacity of the cluster is less than the sum of the quotas of the namespaces, there may be contention for resources. This is handled on a first-come-first-served basis.
Neither contention nor changes to quota will affect already created resources
See: https://kubernetes.io/docs/concepts/policy/resource-quotas/
Basically this is legally / technically allowed, that we can understand for similar reasons allowing overcommit on total limit.
Check if there’s CPU throttling problem
On OpenShift with hard cpu limits we noticed applications were not be allowed to use their entire quota. In other words - Pods running with CPU limits CPU throttling despite the CPU limit is not hit. This particularly affected massively threaded applications. For example if you assign 1 cpu to an application, it only ever maxed out at using .1 cpu while also hitting throttling the entire time it was running. Here’s an example of the CPU throttling issue https://www.linkedin.com/pulse/kubernetes-make-your-services-faster-removing-cpu-limits-eric-khun.
Even with OCP 4.6, sometimes we could see CPU throttling in high concurrency use scenarios even though we are running an updated kernel as mentioned in the Red Hat Knowledge Base 5285071.
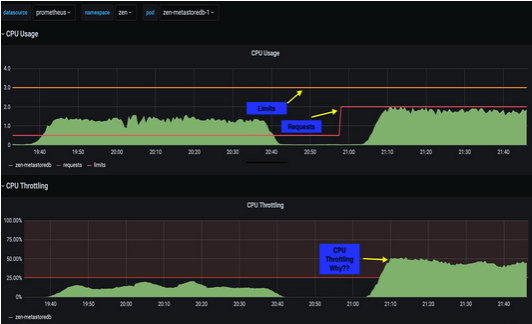
Below is a testing using zen-metastoredb to demonstrate the impact. This Promethus dashboard shows CPU throttling even though CPU usage does not touch its limit.
To workaround this CPU throttling problem, we can try the following workaround .
Step 1: Run desired workload and monitor pods CPU status
If CPU throttling problem found then follow below steps.
Step 2: Remove the resource constraint and find the max CPU usage, say X
Step 3: Set CPU limit to a value three times the CPU request, eg. 3X
Note:
This is just an example and lesson learnt. As there are different factors and variables impacting the performance, you shouldn't expect this workaround or solution can resolve your performance problem.
Contact IBM about the performance problem
Apart from the above analysis from the perspective of capacity or resource utilization, you can contact IBM for seeking help.
And to engage IBM more efficiently for resolving the performance problem, you can start from the following information.
- Collect the HAR files during the UI operation
https://support.zendesk.com/hc/en-us/articles/204410413-Generating-a-HAR-file-for-troubleshooting#h_2598b2df-ca9f-49bc-8166-054c9e5e665a
- Collect the diagnostics
- https://www.ibm.com/docs/en/cloud-paks/cp-data/3.5.0?topic=platform-gathering-diagnostic-information
Summary
In this article. we introduced some useful Prometheus queries for the performance monitoring and troubleshooting. And the workaround for the CPU throttling problem is also introduced.
Thanks to Chen, Yongli and Eling for the expertise sharing and help!
Cloud Pak for Data: Performance Monitoring Best Practices
https://medium.com/ibm-data-ai/cloud-pak-for-data-36ba41d6dd80