QMF Analytics for TSO
When QMF 12 was released it came with a new component called QMF Analytics for TSO. This component gives QMF enhanced graphing and statistical analysis features.
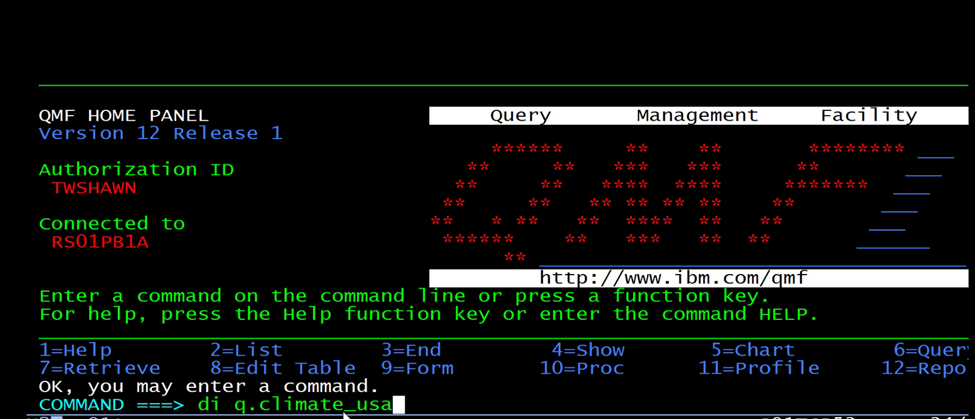
Here is QMF for TSO. The Q.CLIMATE_USA table is about to be displayed
Here is the data
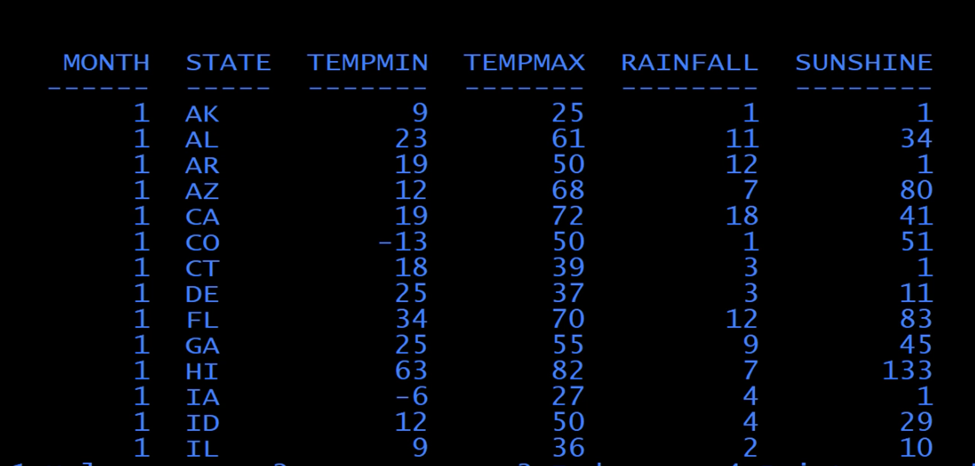
We will primarily be using the MONTH, STATE, RAINFALL in the following demos.
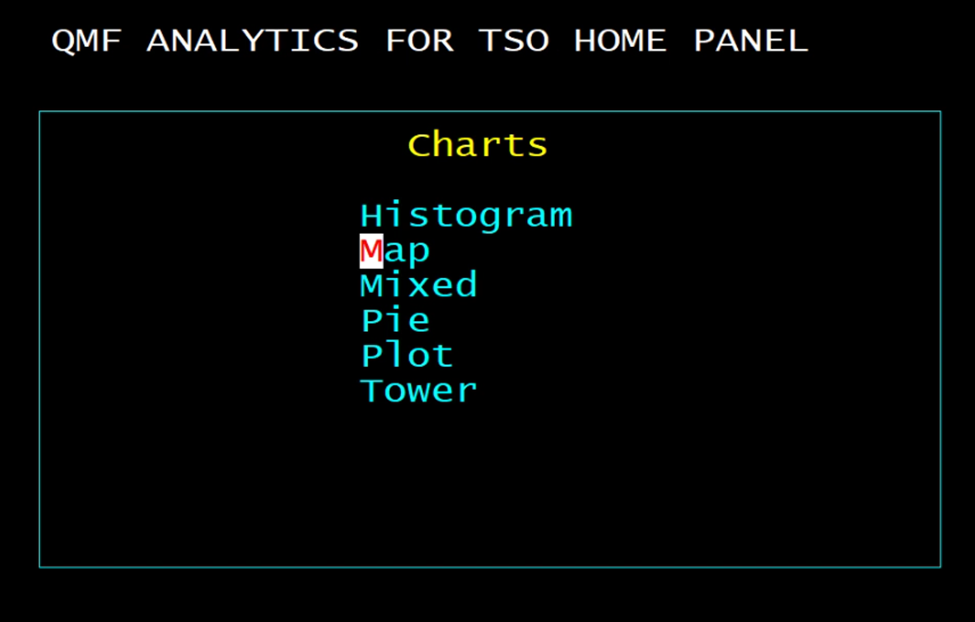
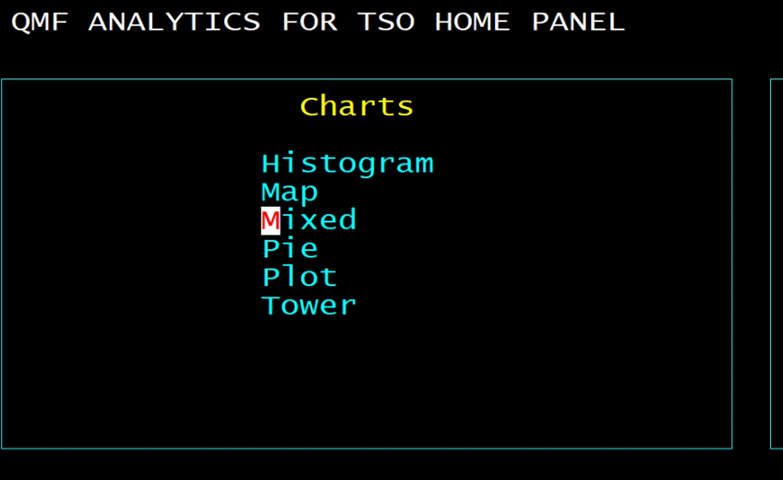
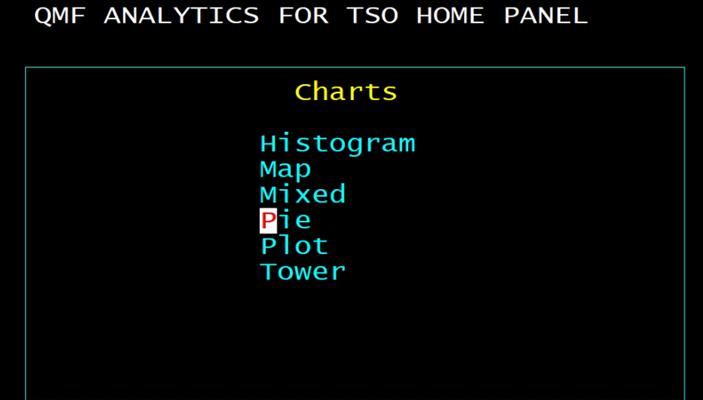
Now when the command SHOW ANALYTICS is issued, the following interface is brought up
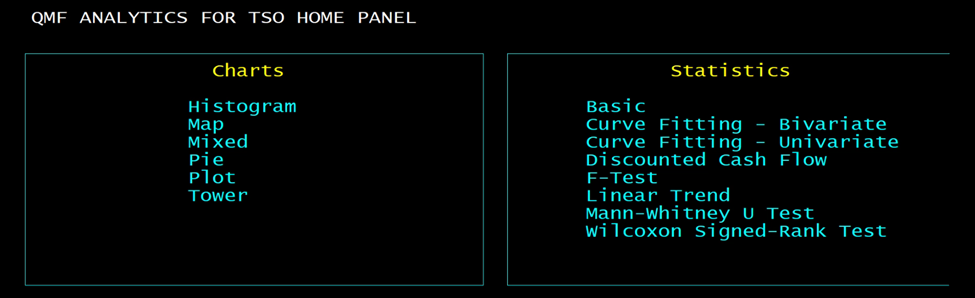
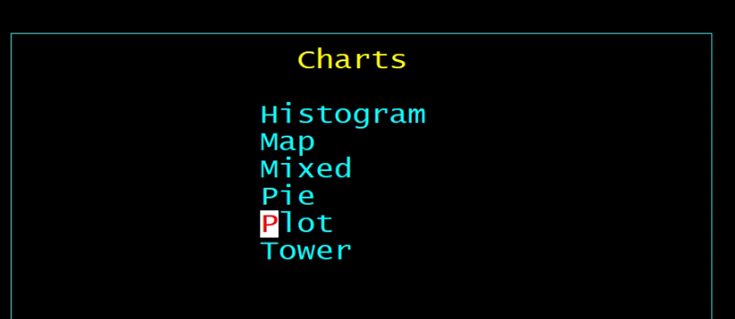
First, we will look at the charts
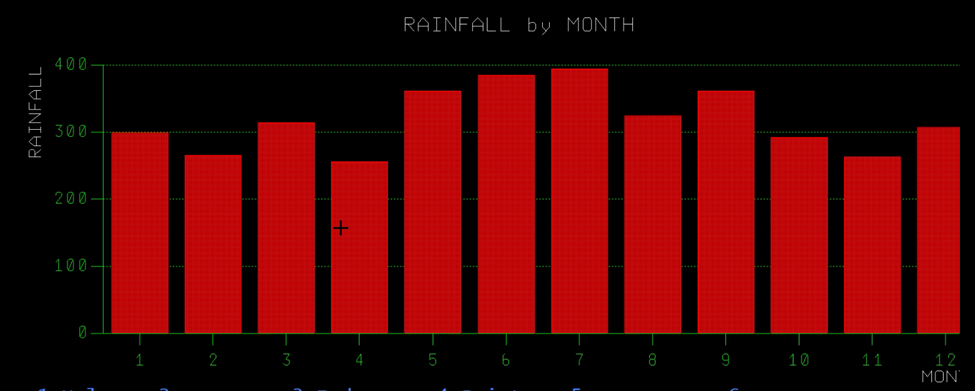
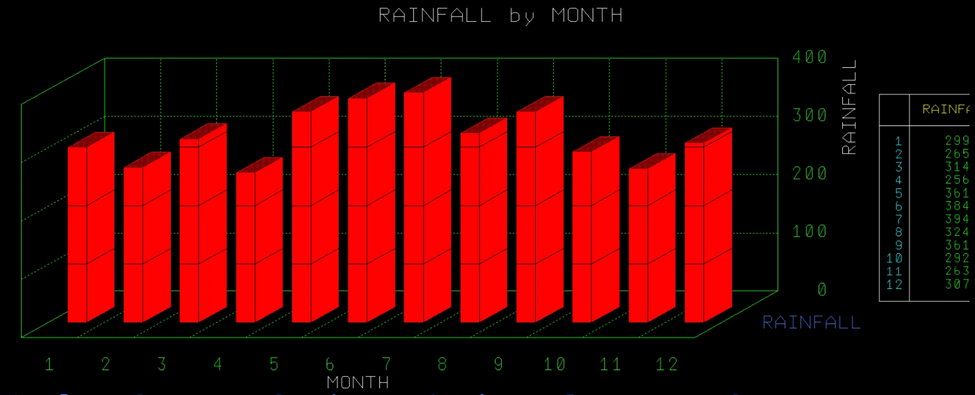
1) Histogram
You may fill in the column names if you can remember them. If you can’t remember them then click in the field where you would type them, and a list will appear:
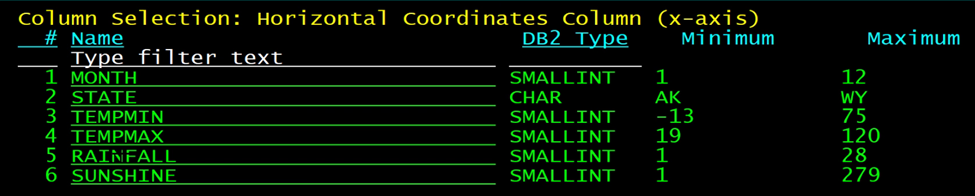 Now you can select the column by clicking on it
Now fill in the grouping column and a Title
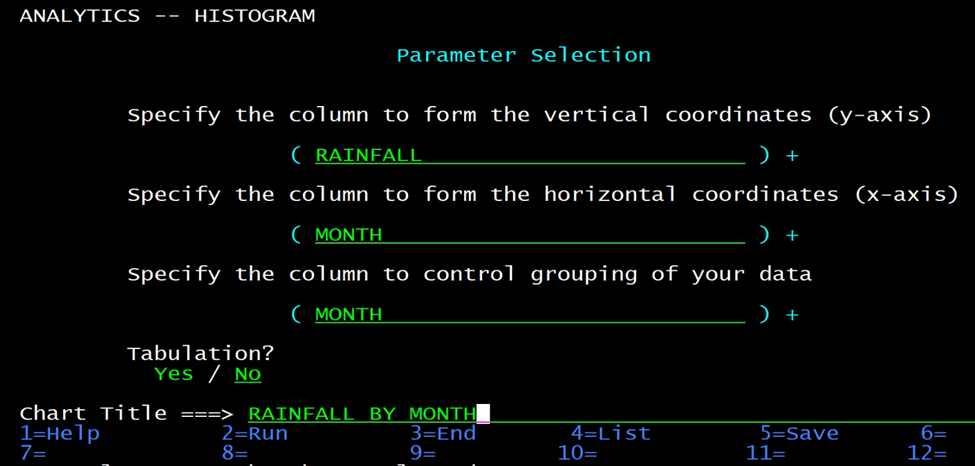
You may save all these settings with F5 or press F2 to run it.
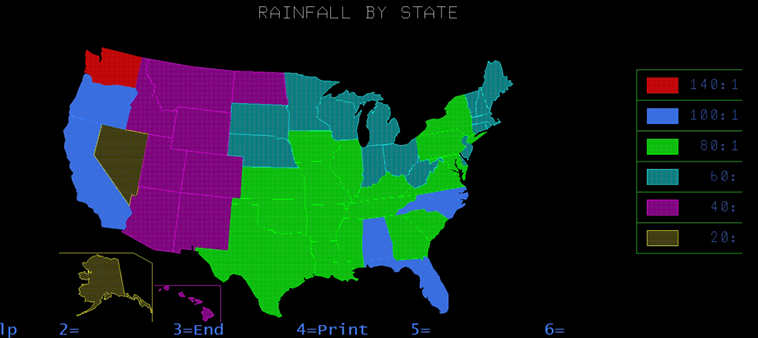
2) MAPS
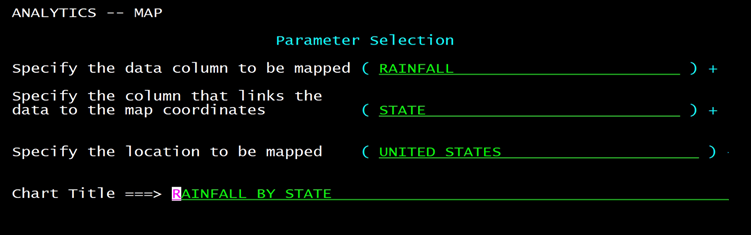
Fill out the Panel and press F5 to save or F2 to Run
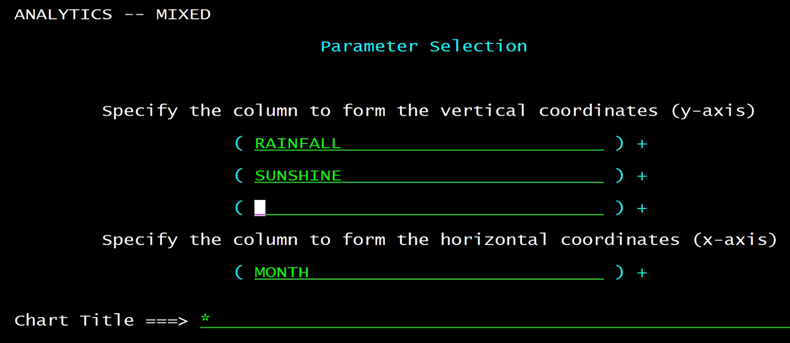
3) Mixed
With Mixed you may plot more than one column at a time
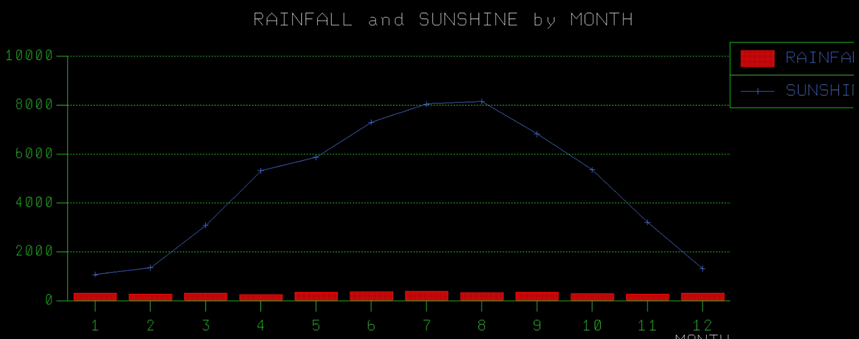
Because they are on the same scale it may be difficult to read the values of the Rainfall.
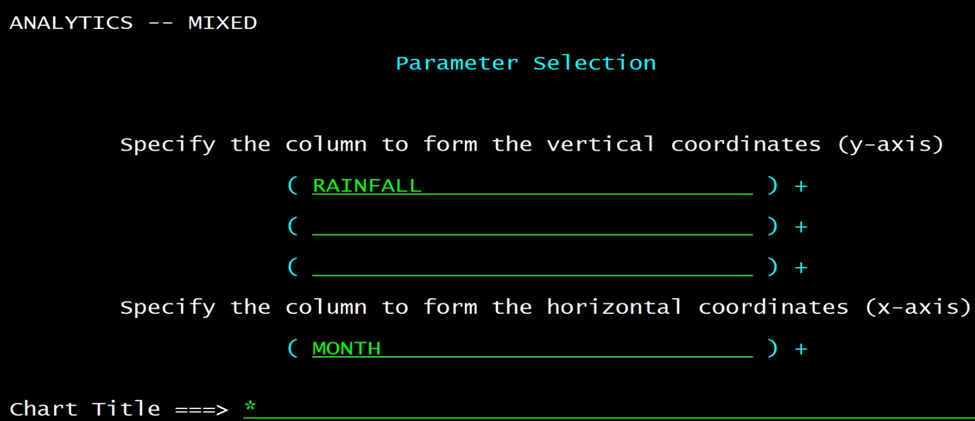
Removing Sunshine will make it easier to read the Rainfall.
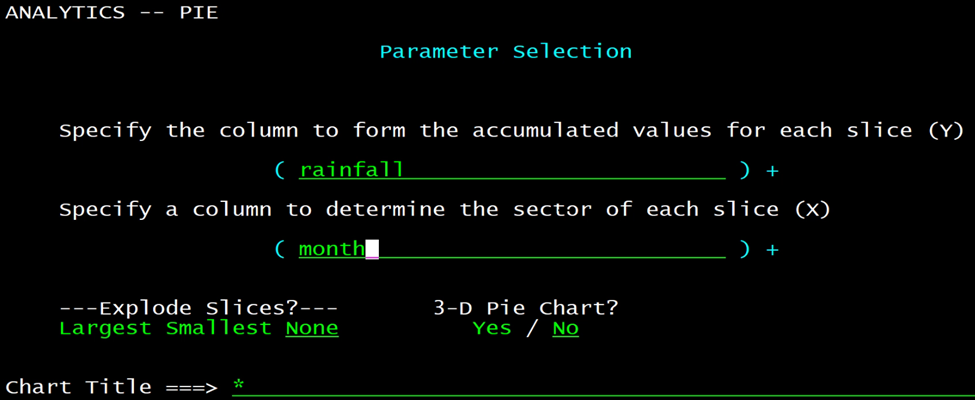
4) PIE
In the Pie panel you fill out the values for Y and X
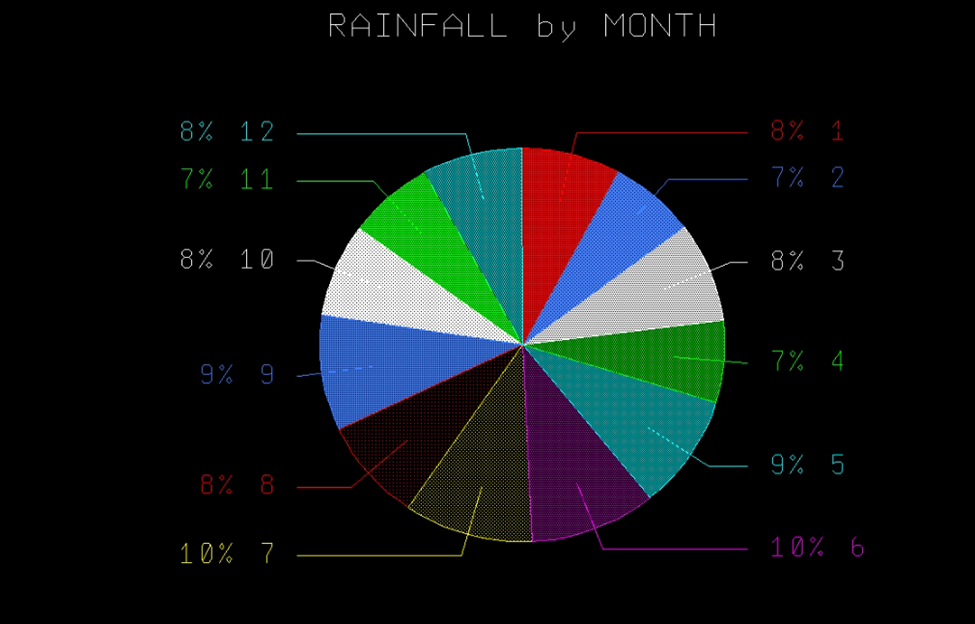
When it is run you get the percentages of the total for each wedge
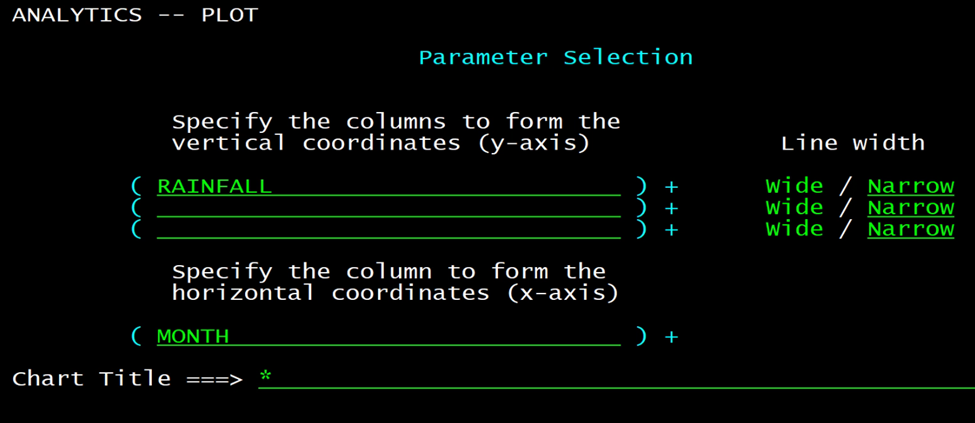
5) PLOT
Fill out the panel, again clicking on the spaces will show a list of columns to choose from.
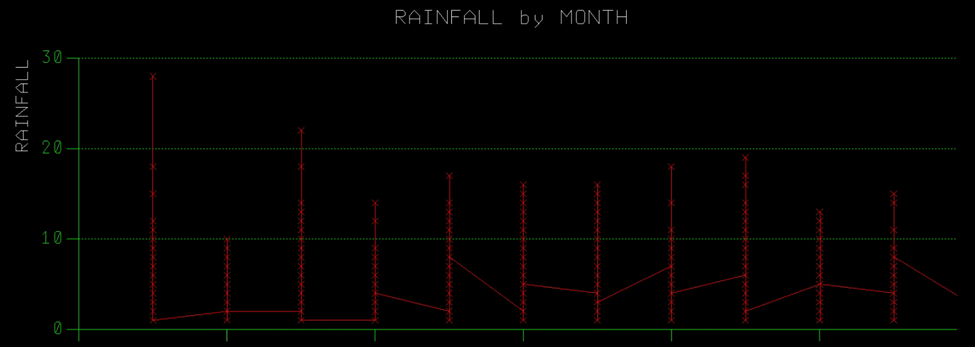
When it is run you get a chart like this
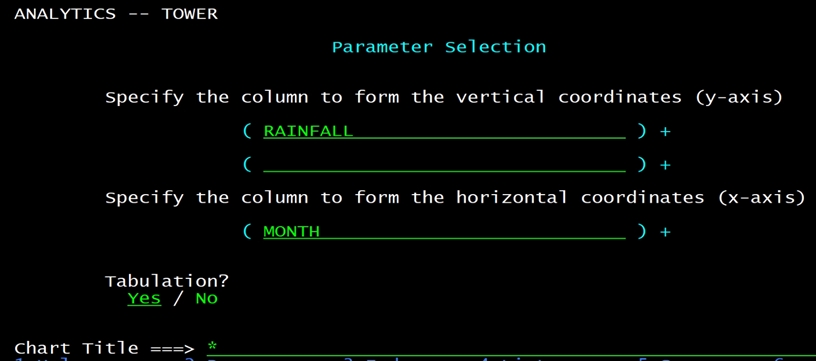
6) Finally, the TOWER

Again, click on the fields for a list or fill in the blanks yourself.
When run it gives a chart like this
#Db2Toolsforz/OS#Db2QMF#QMF