Written by James Cancilla.
Overview
This lab uses the Streams toolkit com.ibm.streams.rproject to execute an R script on tuples flowing through a Streams application. The lab is based on a fairly simple network flow data (NetFlow) example.
This lab requires the R Project be installed on the same host where Streams instance is installed. To get the R Project go to:
www.r-project.orgAn R script has been created that predicts the expected number of packets in the netflow based on the time at which the network transaction occurs.
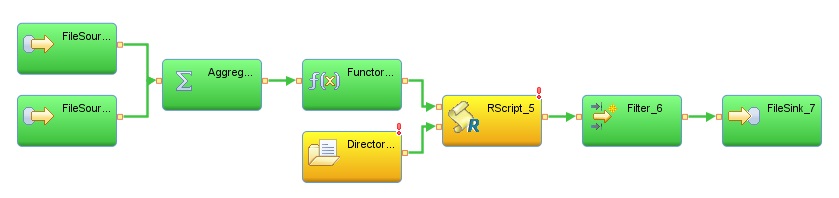
A Streams application has been created that simulates network activities. The data is analyzed using the R-script to predict the expected number of network packets. An alert is issued if the actual number of network packets exceeds the prediction by more than 10%. The alerts are logged in a file. The Streams application is shown below.
In the Streams application, we have two operators that simulates both normal and abnormal network behavior. Data from the two input sources are aggregated to simulate real-time network activities. The RScript operator uses the predictive model to predict the expected number of packets based on the time of the network flow. If the actual number of packets exceed the expected number of packets by more than 10%, an alert will be raised and logged in the file.
Data
In this lab, we will be working with simulated NetFlow data.
NetFlow data has the following format:
type NetflowType =
uint32 sourceIP, // source IP address
uint16 sourcePort, // source port
uint32 destIP, // destination IP address
uint16 destPort, // destination port
uint64 packets, // number of packets transmitted during the flow
timestamp ts ; // timestamp of the netflow
We have two files in the workspace that simulate NetFlow data:
- data/SimulatedNormalBehavior.csv – represents normal Netflow data
- data/SimulatedAbnormalBehavior.csv – represents abnormal Netflow data
The R model was trained using normal netflow data stored in the following csv file:
com.ibm.streams.rproject toolkit
com.ibm.streams.rproject toolkit provides Streams support for the R project. The R project is an open source system for statistical analysis. For more information on the R-project go to: www.r-project.org. The toolkit contains a single operator, RScript. This operator allows you to run an R-script in a Streams application.
Downloads
RScript Operator
The RScript operator executes the customer provided R script code. The operator converts the stream’s input tuple to the inputs required in the R script and converts the R script output to the streams output tuple.
Parameters
- rScriptFileName: name of the R script to run
- streamsAttributes: list of SPL expressions that produce a value that will be passed to the R Script.
- rObjects: list of the objects required by the R Script
- initializationScriptFileName (optional): name of an R Script that is run during operator initialization.
The streamsAttributes list and the rObjects list create a one-to-one mapping between streams and R. Each list element in the streamsAttributes produces a value which is assigned to the corresponding element in the rObjects list. These form the inputs to the R Script.
Input Ports
- Port 0: input tuple whose attributes are used to provide input to the RScript as specified in the streamsAttributes parameter.
- Port 1: this is optional and is used to provide the name of an R Script to run. This script is executed once and is typically used to dynamically update the model. See the documentation for more information on the toolkit or the RScript operator.
Output Ports
- Port 0: input tuples are passed to the output tuple if they exist and and extra attributes can be populated by using the output function
- Port 1: an optional port that can submit a tuple when an error occurs while the operator is running the script
Setup for the Lab
- Install R if it is not on your system.(http://www.r-project.org/)
- Import the R project from R_SPLProject.zip into Streams Studio
- In Streams Studio, using Streams Explorer, add the com.ibm.streams.rproject toolkit so that it can be used to compile the samples. Follow the steps in this article under "Procedure". The toolkit is found in <streams_install>/toolkits/com.ibm.streams.rproject.
Exercise 1 – Running R Script and Dynamic Model Update
Problem Statement
In this lab, we are going to use the RScript operator to execute an R script in our Netflow analysis application. In addition, we are going to demonstrate how you can dynamically update the predictive model in R without having to restart your Streams application.
Step By Step Instructions
- Expand the “RProject” twisty, and the application twisty
- Highlight the “Rsample” file, right click, and select Open With>SPL Graphical Editor
- Right-click on the RScript operator and select “Edit”
- In the Properties view that opens, click on the “Param” tab
- Select “Add…” button, select the “initializeScriptFileName”, “rObjects”, “rScriptFileName” and “streamAttributes” parameters, then click OK
- Update each of the parameters with the following values.
initializeScriptFileName: "initialize.r"
rObjects: "hourTime", "minTime"
rScriptFileName: "process.r"
streamAttributes: hour, minute
Note: You can use the above to copy and paste into the Studio parameters page. When finished the values should match the ones below.
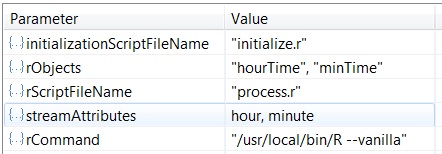
Important: If R is not installed in /usr/bin/R, you can use the “rCommand” parameter to specify the location.
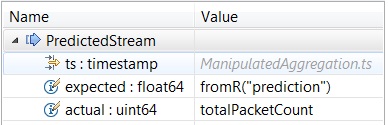
- Click the “Output” tab and expand “PredictedStream”
- Update the “expected” and “actual” attributes with the following values:
Note: You can use the above to copy and paste into the Studio parameters page. When finished the values should match the ones below.
- Save the changes (press Ctrl+S) and ensure that it compiles without error
Run
- In the Project Explorer, right-click “RSample” and select “Launch”.
- In the “Edit Configuration” dialog, click “Apply” and then “Continue”
- Switch to the Streams Explorer view
- Expand “InfoSphere Streams 3.2.0.0″>”Instances”
- Right-click on the default instance (i.e. “default:LabInstance@streamsadmin”) and select “Show Instance Graph”
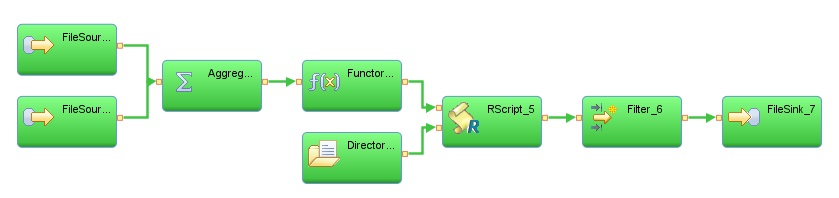
- The Instance Graph view will open in the bottom panel, showing a similar graph as in the graphical editor. The instance graph view shows what is currently running in the instance. You can play with the options in the Instance Graph view to monitor health, flow rate and other metrics.
Allow the job to run for 5 minutes. You will see the FileSink operator turn from yellow to green, which indicates that an alert has been raised due to the simulated abnormal behaviour. The alert is logged in the “Results.csv” file under the “data” folder from the RProject project.
Exercise 2 – Dynamic Model Update
In this exercise, you will dynamically update the model. The application is configured to monitor the RProject/rscripts directory in the RProject in the workspace. When a new R script is copied into this directory, the directory scan will discover the new file and send the R script filename to the RScript operator. The operator will read the new R script and update the model dynamically.
To update the model used by the RScript operator:
- In the Project Explorer, expand the “Resources/data”
- Under the data folder, select file: “newModel.r”
- Right click and select “Copy”
- In the Project Explorer, expand and select “Resources/rscripts”
- Right click and select “Paste”
If the model is updated successfully, the DirectoryScan operator in the Instance Graph will turn from yellow to green.
Resources
This article was written by James Cancilla.#CloudPakforDataGroup