Red Hat OpenShift includes a Prometheus-based monitoring stack out of the box, which can be easily extended to enable users to configure their own application monitoring and alerting. Cloud Pak For Data also has a builtin monitoring capability however for scenarios where single monitoring framework is desired Cloud Pak for Data supports Prometheus metrics end point. In this article we'll discuss steps for ingesting the Cloud Pak for Data metrics to OpenShift Prometheus for monitoring and alerting.
Software Pre-requisties
Openshift 4.6 and later
Cloud Pak For Data 4.x
Configure OpenShift to Monitor User Defined Projects
Following links from the OpenShift documentation has instructions for configuring the monitoring stack ,
1.
Configure Monitoring Stack2.
Enable Monitoring for user define projectsIf configured properly , the following pods i.e prometheus-operator, prometheus-user-workload and thanos-ruler-user-workload
will be running within the openshift-user-workload-monitoring project. We can verify the same using the following oc command
oc -n openshift-user-workload-monitoring get pods
Setting up Cloud Pak for Data Endpoint Scraping.
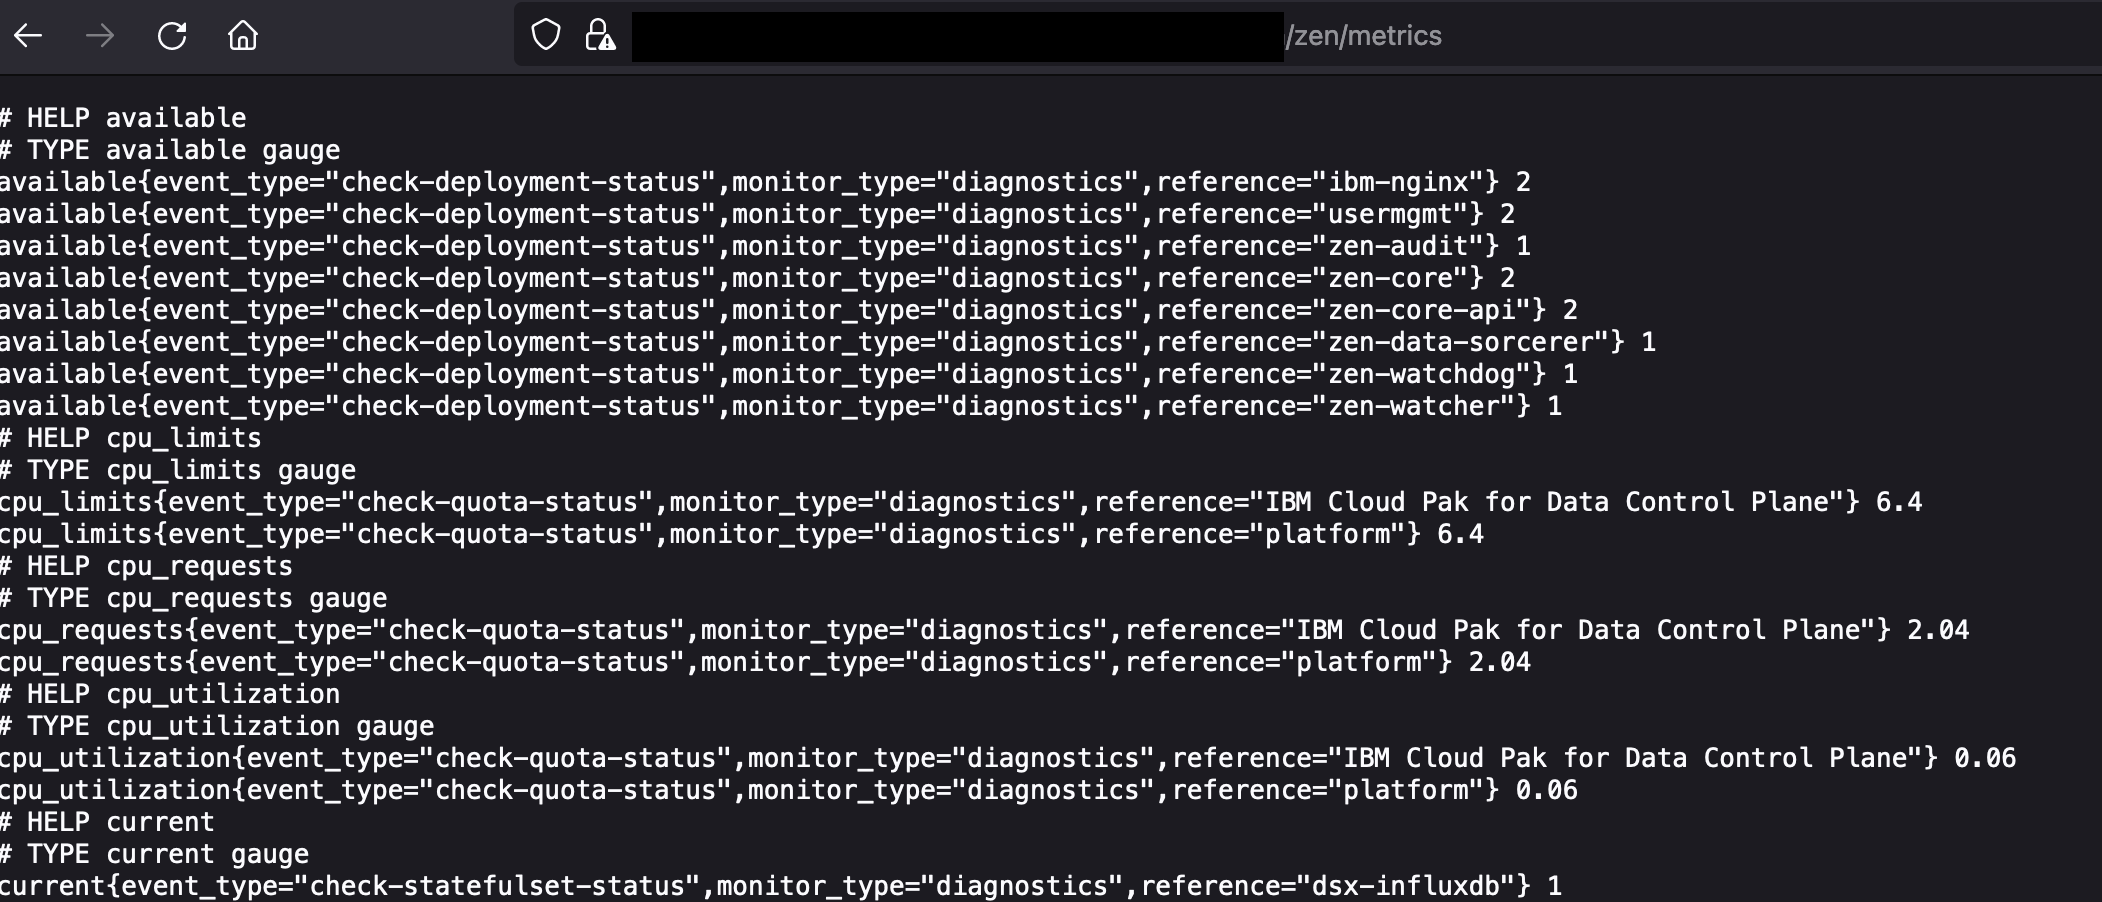
1. Cloud Pak for Data metrics endpoint is running within the zen-watchdog pod, we can view all the supported metrics by accessing the following CPD URL ,
https://<CPD Route>/zen/metrics
Here is an example output from the web browser showing various published metrics,
2. Configure a ServiceMonitor on the Cloud Pak for Data control plane namespace, ServiceMonitors help Prometheus locate and monitor the metrics end-points.
On our test cluster Cloud Pak for Data control plane is installed within the zen namespace, hence we will be using the following ServiceMonitor specification, unique port id where the metrics endpoint is running needs to be specified which is zenwatchdog-notls
apiVersion: monitoring.coreos.com/v1
kind: ServiceMonitor
metadata:
name: cpd-monitor
namespace: zen
spec:
endpoints:
- interval: 30s
port: zenwatchdog-notls
scheme: http
selector:
matchLabels:
app: zen-adv
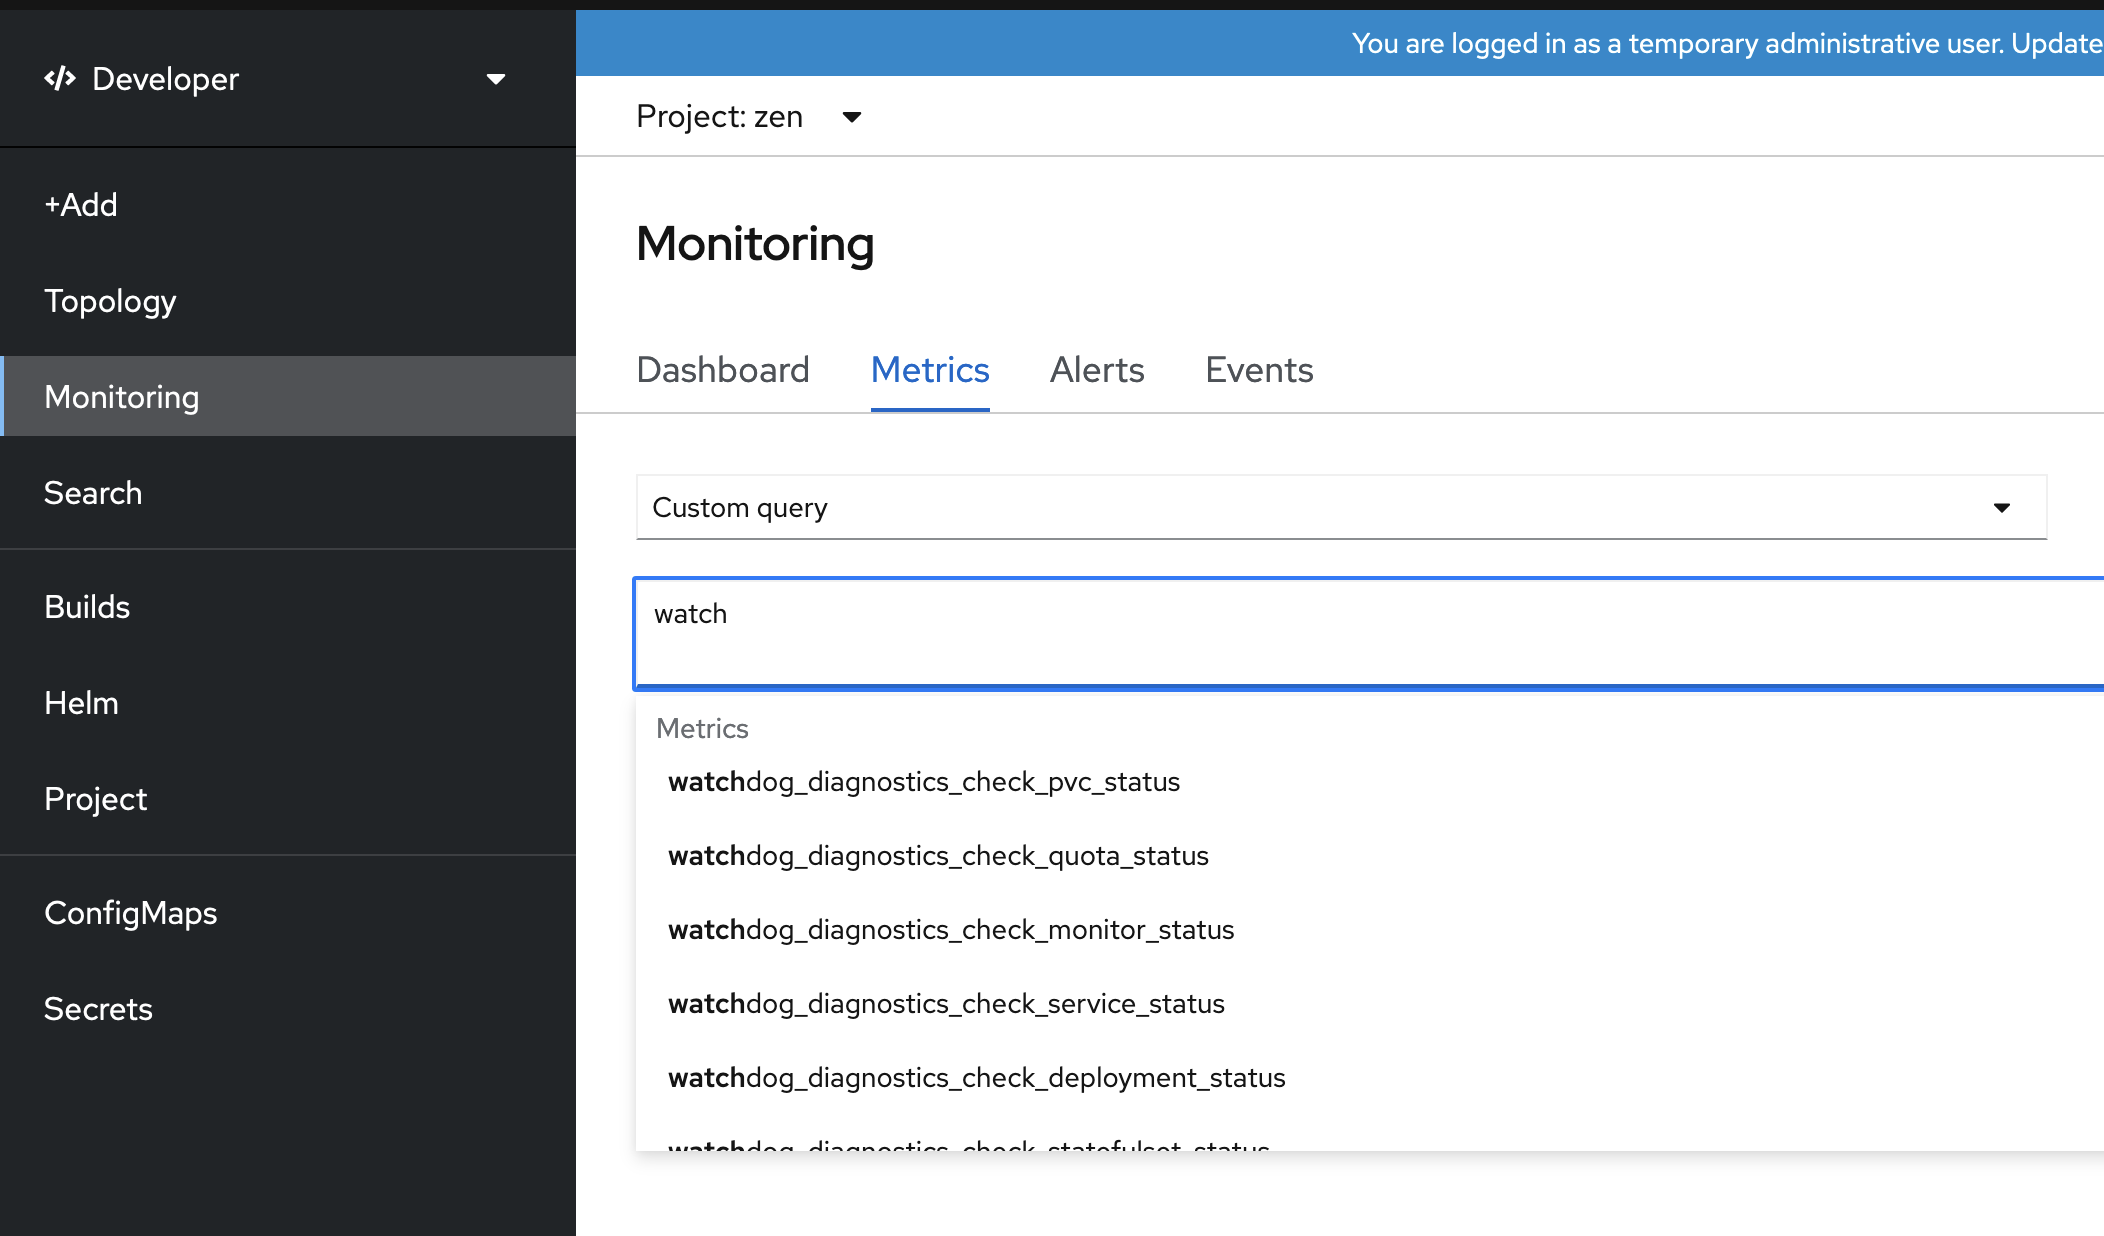
3. If the ServiceMonitor is configured properly we can start querying the CPD Metrics using the OpenShift Monitoring Dashboard. Within the OpenShift UI , switch to Developer perspective and open the Monitoring page , select the zen project, switch to the metrics tab and choose Custom query. Start typing the name of any CPD metrics and the framework will suggest a list of matching metric names as shown following
Create and Test a Prometheus Alert for one of the published CPD Metric.
1. Configure Prometheus alerts by creating an alert rule. In the following example we are configuring an alert rule using zen-metastoredb replicas metric, anytime the metastoredb replicas fall below 3 we will raise an alert called 'metastoredb-down'
apiVersion: monitoring.coreos.com/v1
kind: PrometheusRule
metadata:
name: cpd-alert
namespace: zen
spec:
spec:
groups:
- name: cloudpak
rules:
- alert: metastoredb-down
expr: 'replicas{reference="zen-metastoredb"} < 3'
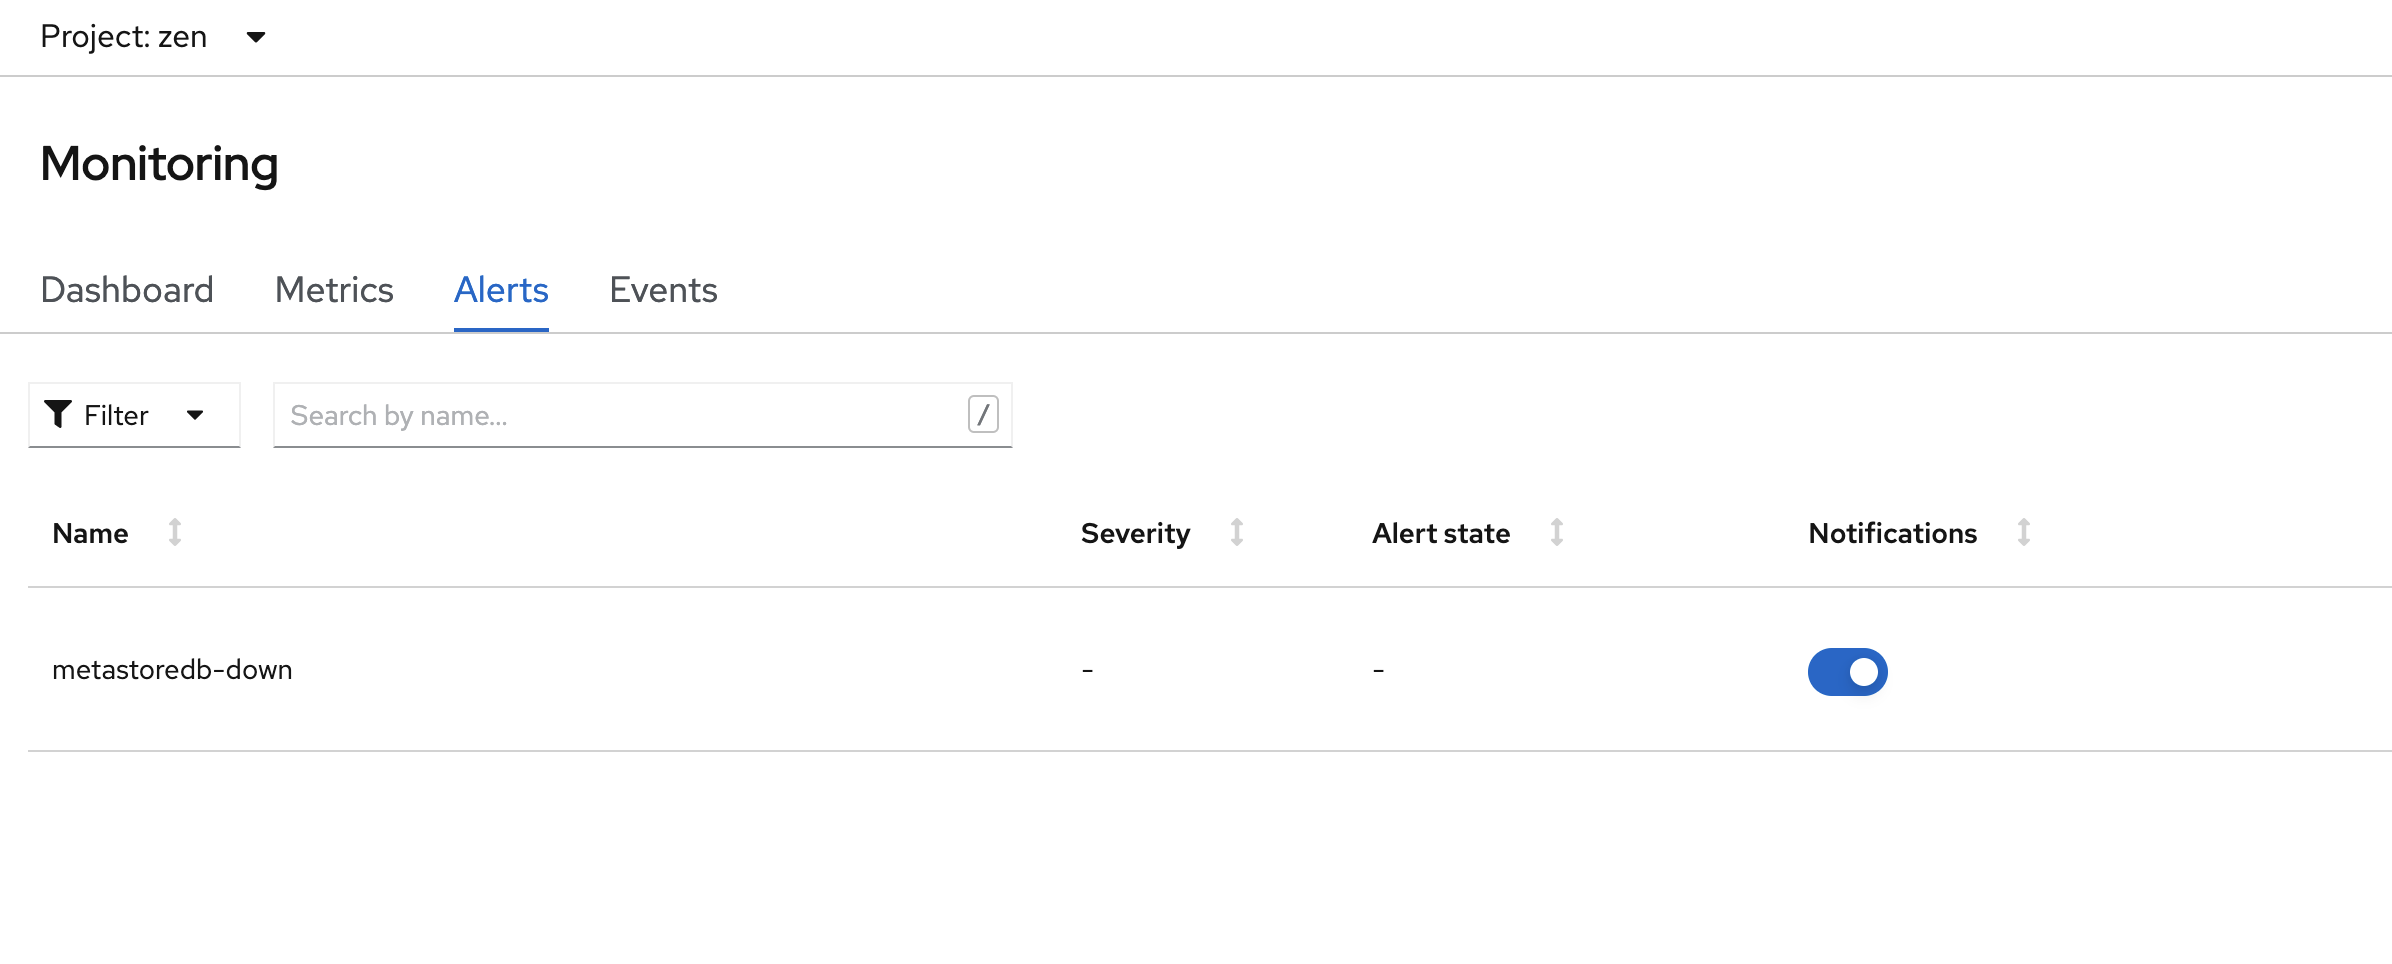
2. Once the alert is configured, it should appear within the OpenShift monitoring dashboard,
3. We will simulate the alert scenario by scaling down the zen-metastoredb statefulset using oc scale command,
oc scale sts zen-metastoredb --replicas=2
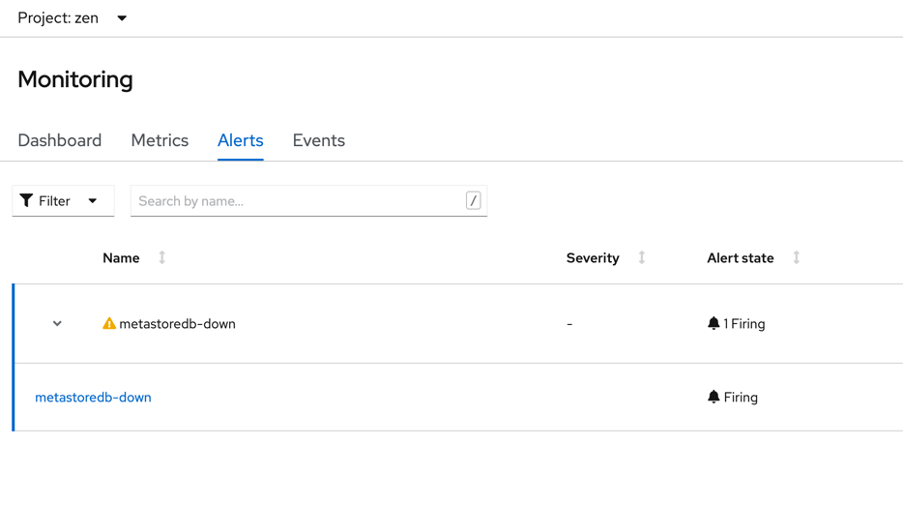
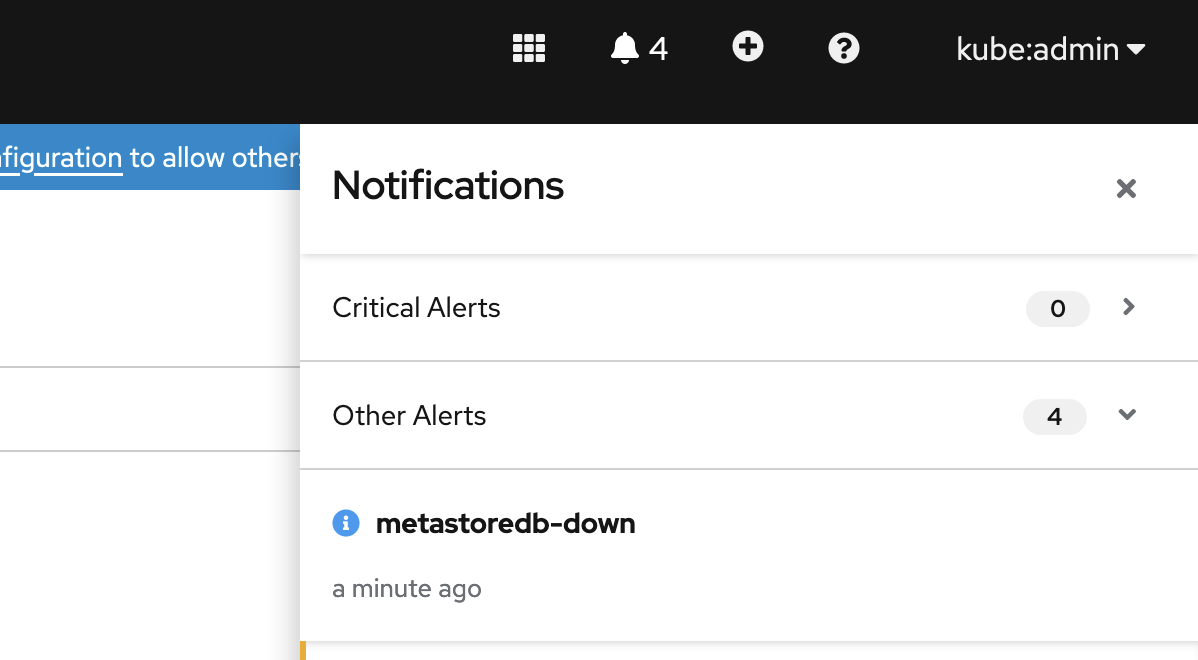
4.Once the metastoredb cluster is scaled down, an alert will be raised which can be viewed on both the monitoring page and OpenShift Home page as shown following, if the alerts don't show up immediately wait for sometime, since by default CPD gathers diagnostics data every 10 mins,
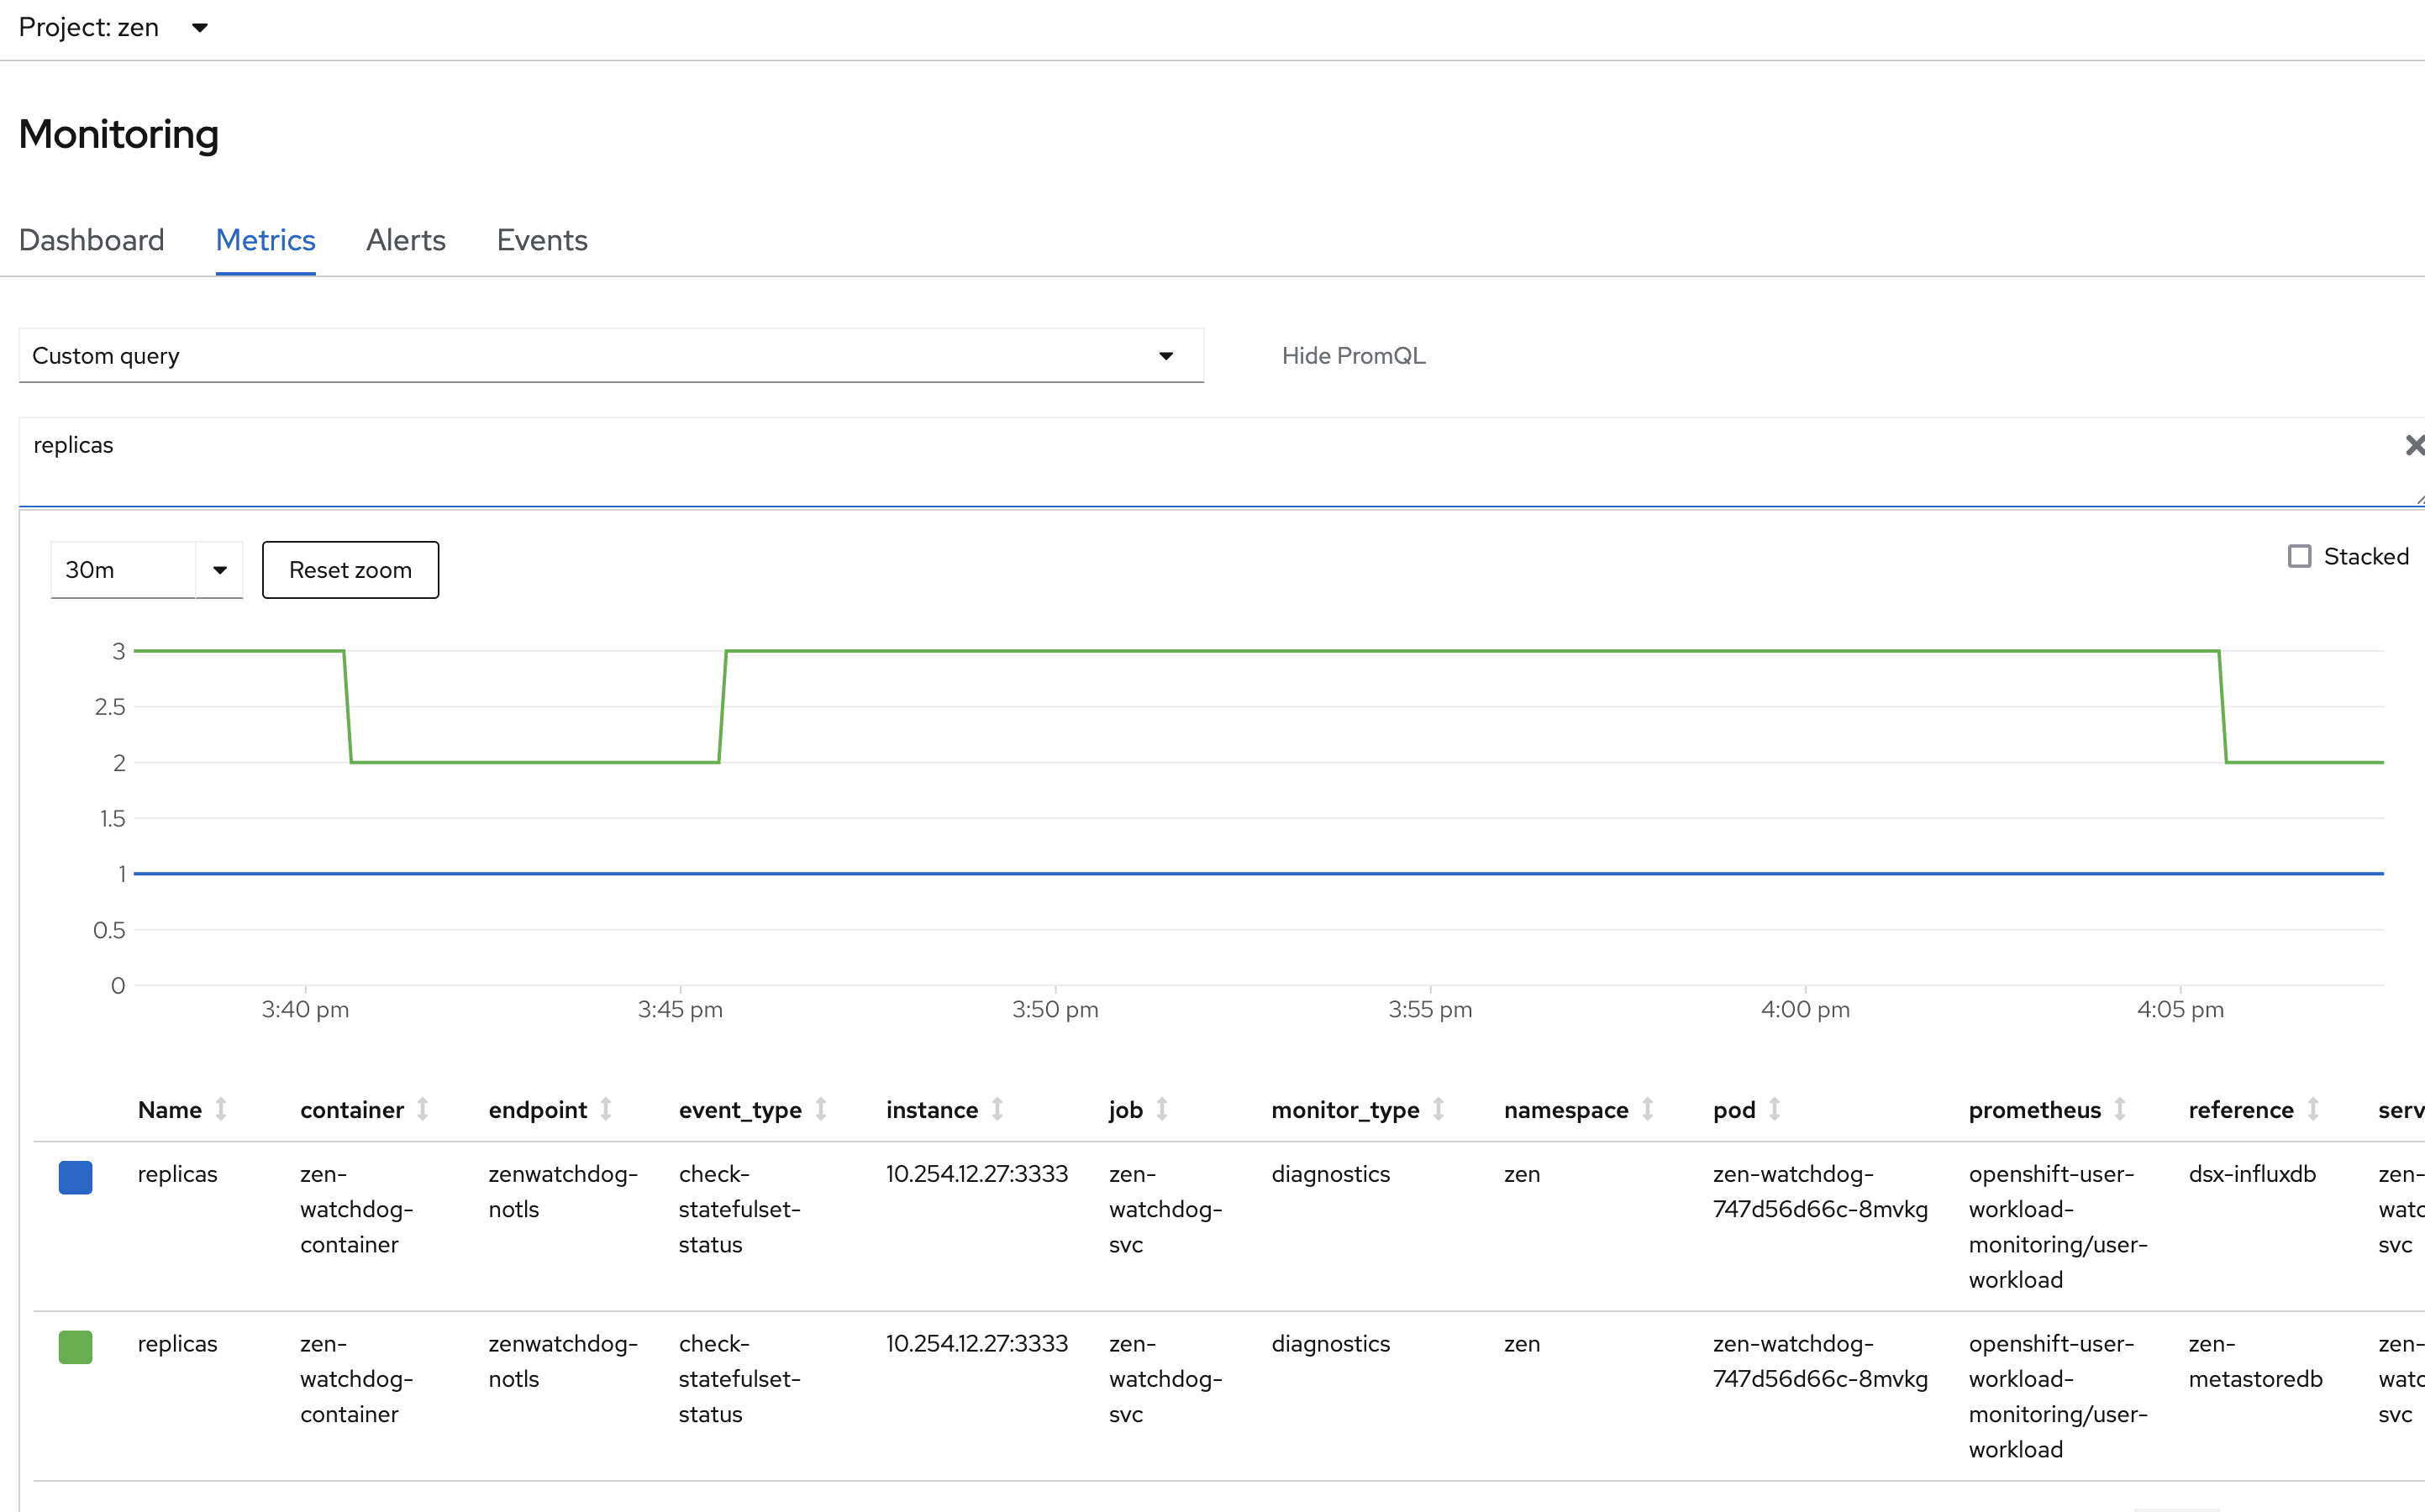
5. Users can query the replicas metric to monitor the number of instances currently running ,
6. To resolve the alert, scale the zen-metastoredb replicas back to 3
oc scale sts zen-metastoredb --replicas=3
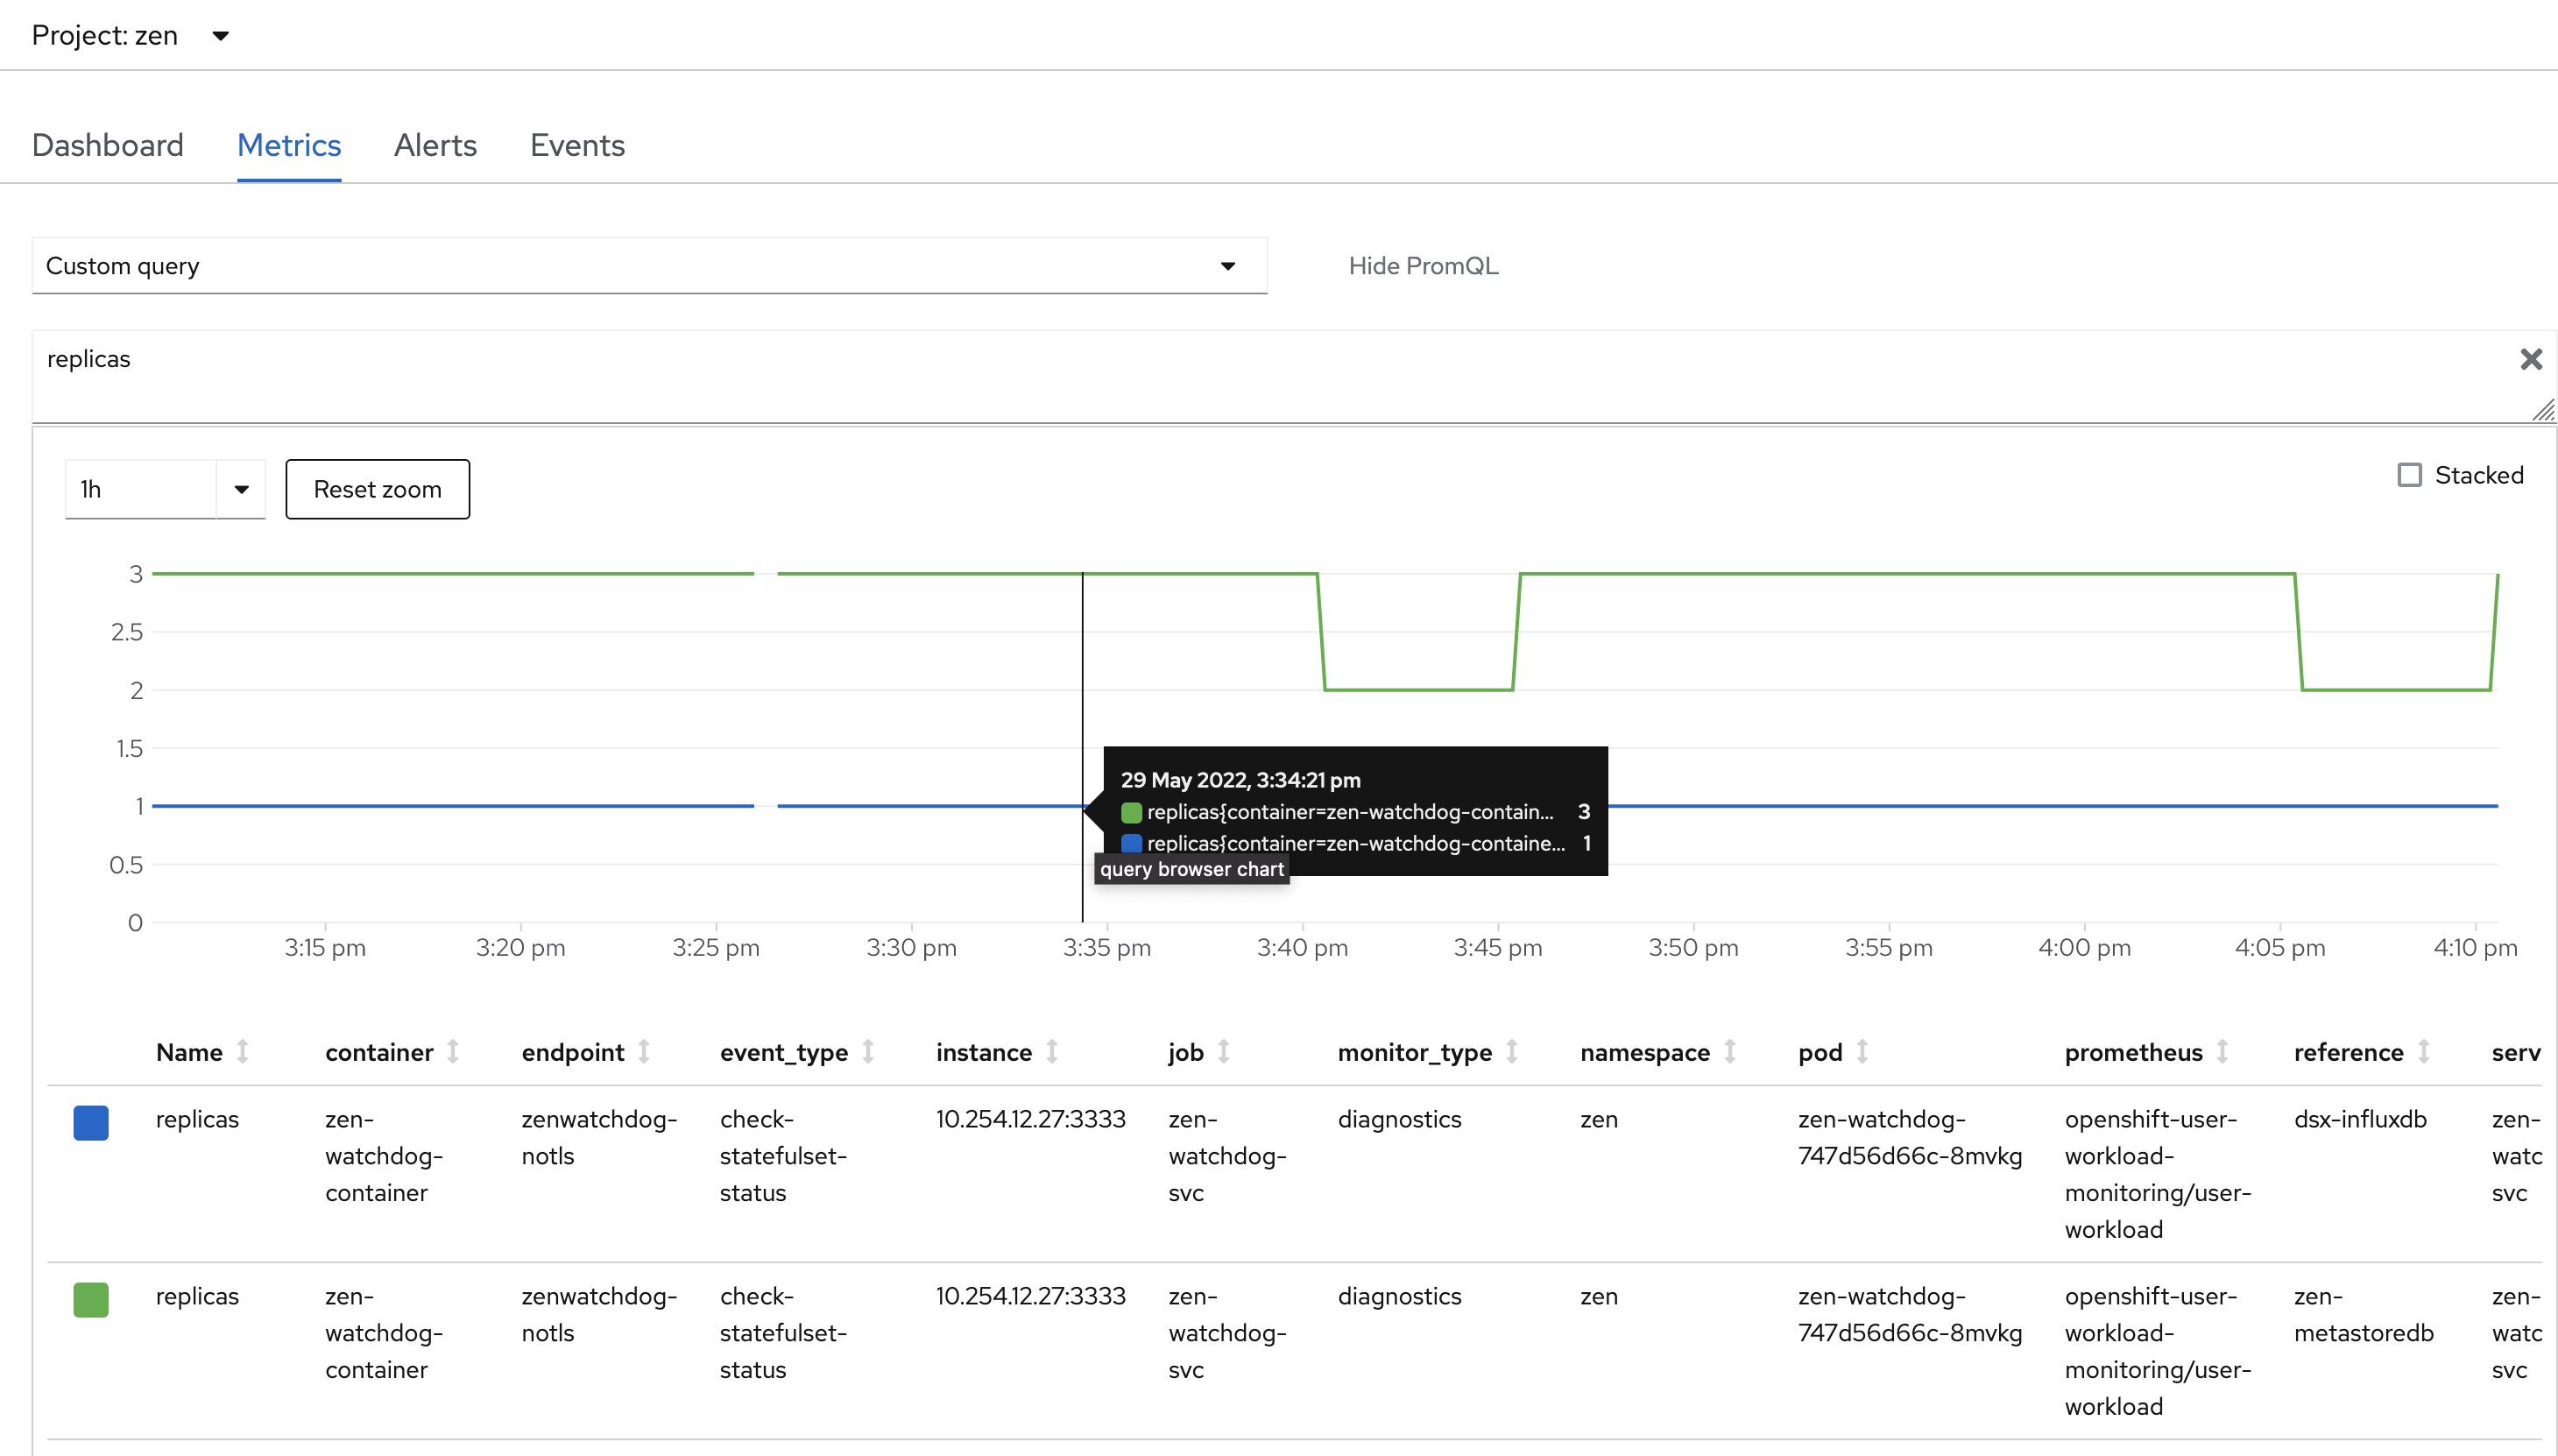
7. After sometime the alert will no longer be triggered and the replicas metric will be shown as 3,
Conclusion
By following this article users will be able to configure the OpenShift Prometheus framework to scrape the metrics from Cloud Pak for Data end point and also create AlertRules on various CPD metrics.
Additional References
https://github.com/IBM-ICP4D/monitoring-utils#CloudPakforDataGroup