
IBM Cloud Pak for Data (CP4D) — a Redhat Openshift-based Data & Machine Learning (ML)/Artificial Intelligence (AI) platform offers various capabilities from data collection to deploying ML/AI models in production. It allows you to solve your end to end data science use case with a variety of proprietary and open-source tools and technologies efficiently. Welcome to the first part of this two series blog where you will be exploring how to solve a transportation use case using these end-to-end features.
In the first part, we will be exploring data collection and organization in Cloud Pak for Data. We will also be looking at how can we perform data engineering using Data refinery on the platform.
Use Case
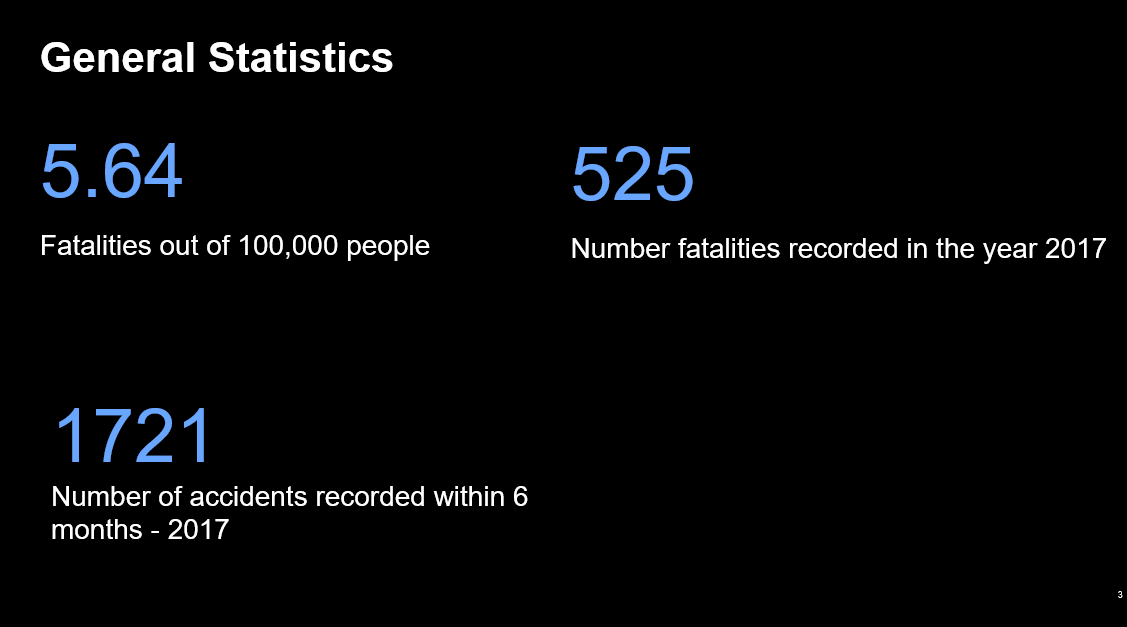
Everything in life has some risk and so does driving on the road. In the year 2017, Dubai witnessed 1721 car accident deaths within 6 months and this is a large number for a country like Dubai. Not only Dubai, but other countries also face this issue as well due to various factors such as the environment, driver behavior, road conditions, etc. The government needs to analyze these features so they can reduce this number and promote a safer driving experience. Leveraging ML/AI is the solution to this problem.
In this blog, we look at how we can analyze driver behavior to see how risky will they be on the road and also look at how a certain location and other factors affect accidents on road all using AI and data science. This use case is particularly very important for government entities such as the transportation authority, police departments, etc. Private institutions such as insurance companies can leverage this information to make better-informed decisions will find this very handy as well.
Data Collection
Different agencies can have their data sets lying in a variety of data sources including Hadoop, relational database, NoSQL, etc. Cloud Pak for Data makes it easier to connect to external sources and also optionally store this data on the platform. In this case, we connected to Db2 warehouse on the cloud to remotely access the data set. All that we needed to do was entering the host, username, password and port number.

Data Organization
In any data science project, the data needs to be analyzed and there needs to be some governance layer for the data to be trusted and establish a common understanding across the different consumers. For this reason, we will be looking at how we leverage automated Data discovery, Business Glossary, and Governance Policies & Rules to populate the centralized Governance Catalog.
The first step was to create business terms for this project’s glossary. So terms such as driving license issuance, age of the driver, location of the accident, etc. are created. This will ensure users have a common understanding of the business terms.
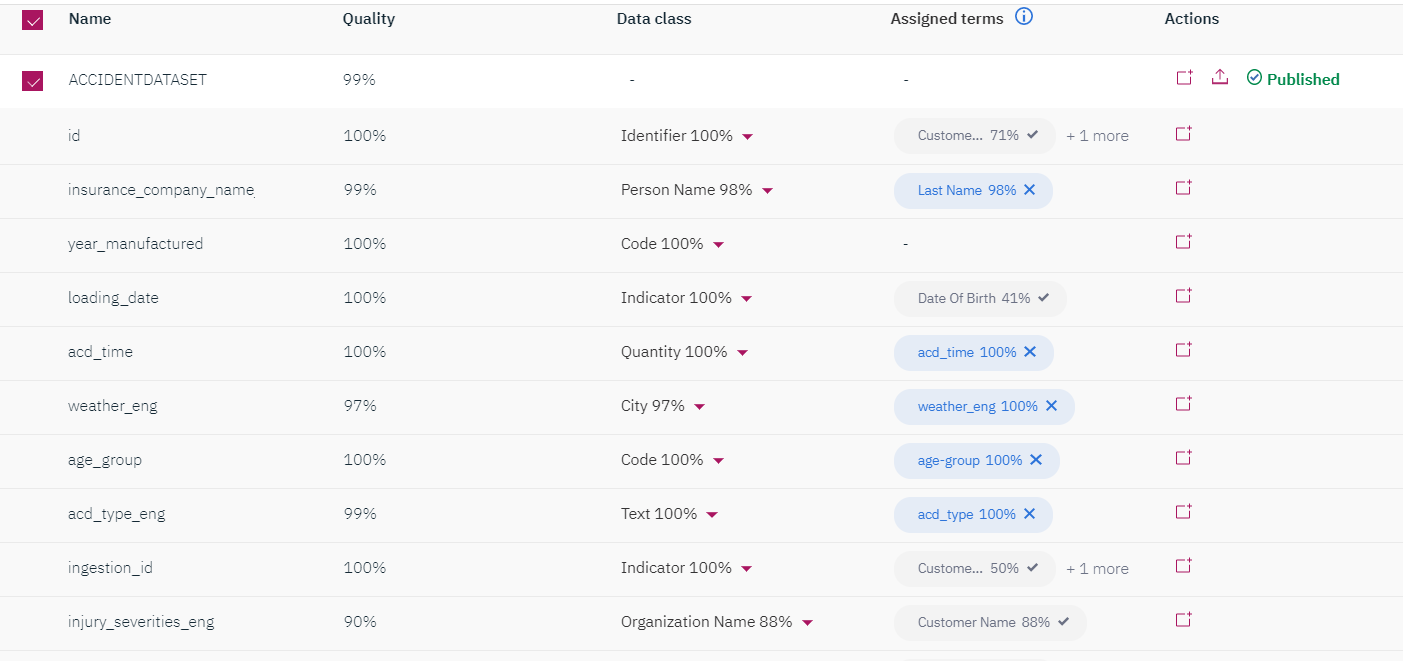
The next step is to profile the available sources of data, classify the data attributes and map the technical assets/attributes to the business terms created previously. This is done through a combination of data discovery and ML-enabled term assignment. After the job has run successfully it will suggest term assignments and allow the subject matter expert (SME) to either accept the ML suggested term assignments or map other available terms. Once they are happy with the term assignments, they can choose to publish this metadata to the centralized governance catalog so other users of the platform can benefit from it.
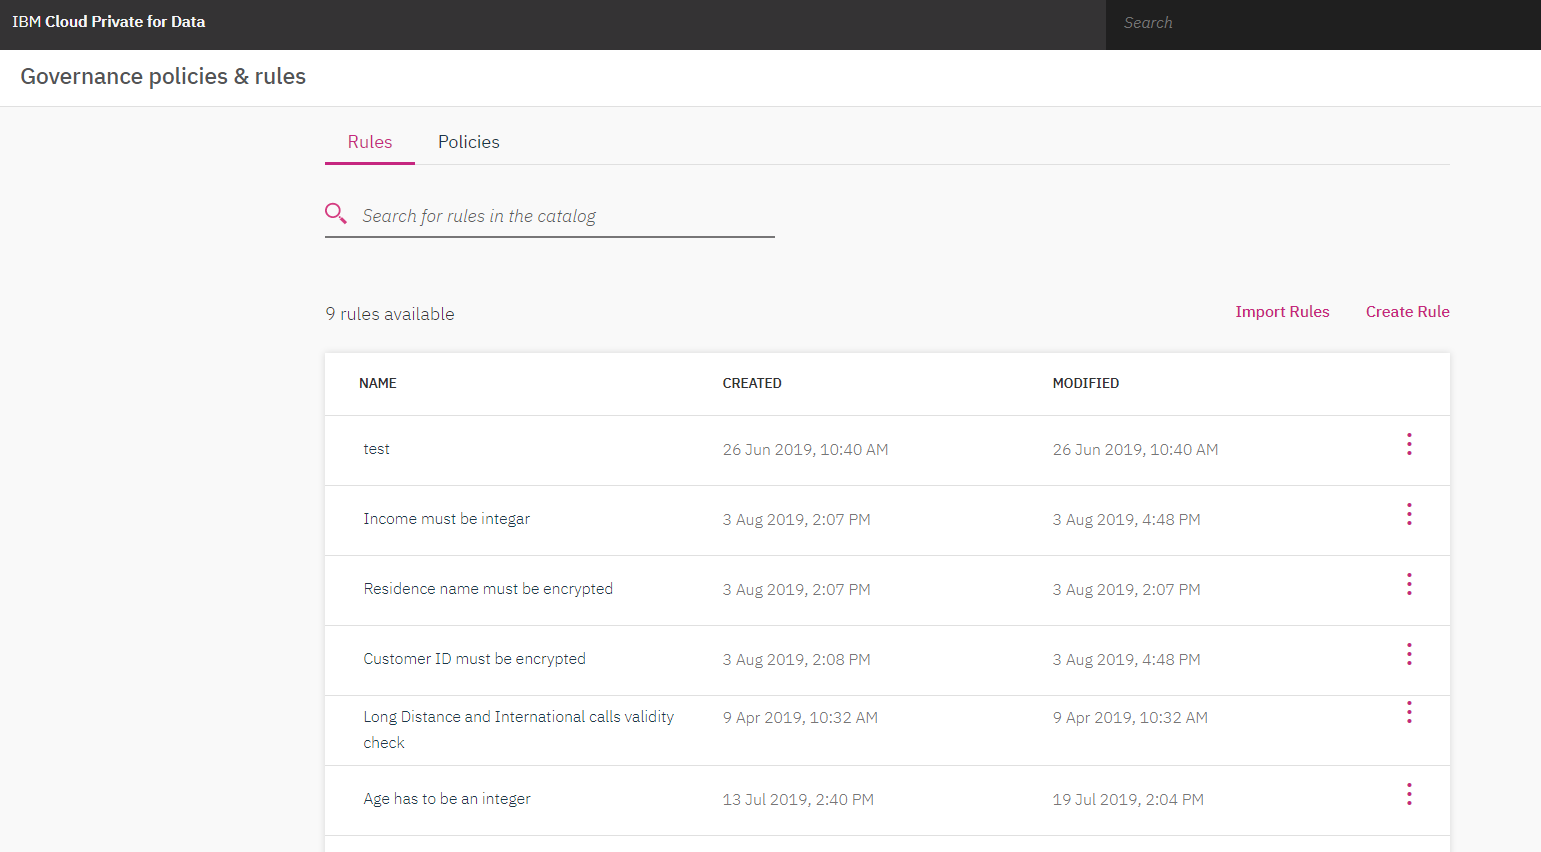
Defining Governance policies/rules is the last step now. We need to assign rules and policies to technical assets (attributes of the dataset) and establish the governance framework. This will ensure users across the organization follow them and comply with them. We can create rules such as encrypting the residence name, customer Id and attribute age has to be an integer. Once this is done we can search for the data set and manually assign the data set to the rules and policies created.
The centralized governance catalog now has information about all the technical and business assets and we are also able to explore the inter-relationships between these technical and business assets. This feature shows data lineage.

Data Refinery
Once we have our data collected, organized and governed in the platform, we will have to move on to data preparation and cleanse it for ML/AI model building. Cloud Pak for Data offers data refinery as a tool that performs this job effectively. A lot of processing was required for the accident data set, below it is described what kind of processing was done for the data.
The dataset includes information from various locations, including all of them for analysis in the ML model will lower the accuracy and we will not give us the best results. For this reason, 6 locations which have the maximum accident count were selected. To do this, the operations feature in Data Refinery is used. The first thing we need to do is find the top 6 locations with a maximum count. We use the count formula for this, and start finding the top 6 records. Once that is done we will use the filter feature to filter out those specific locations found.
The next problem we need to solve is with the driver age and accident timings, both of them have a specific age and time which can again cause accuracy and results issue. To solve this issue we need to group them. Hence we will use the group by function in the operations feature. The age will be grouped with a difference of 10 and the timing will be grouped in the following manner: early morning, morning, early afternoon, afternoon, evening, night and late night.
Conclusion
Well, that was it for part 1, where you learned about data collection, organization, and preparation on cloud pak for data. Stay tuned for part 2 where you will learn about dash-boarding, modeling and infusing the model into a shiny application.