I am opening this topic again and would like to know whether there is any improvement done to the marimekko widget or is it possible to accomodate summed up values of each stacked bar underneath, instead of using KPI or Summary widget underneath?
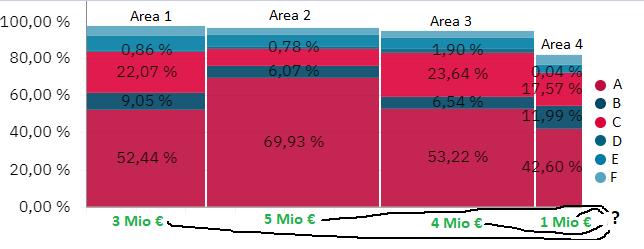
As seen in the above diagram, I would like to know how to get the values printed in green above (3 Mio €, 5 Mio €) underneath each stacked bar in marimekko.
--------------------------------
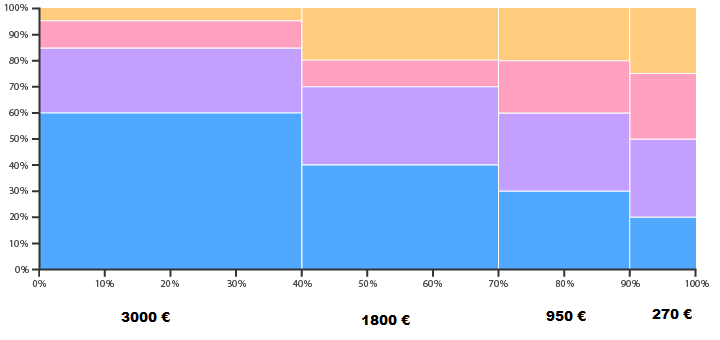
I have difficulties in printing the values on the x-axis of a summed up variable in a Marikmekko diagram using Cognos Analytics. For example, presently the diagram prints values in x axis in percent (a diagram as an example below), however, I want the total of each block to be printed below it, and not the percentage value as shown below (of course, I know to disable the percentage value in the tool). Say for the left stack 3000 €, the one right to it must carry 1800 € etc. How can this be done in the diagram? Any clue please? I am very new to Cognos and dashboarding.
Thanks for your support in advance.
Best regards,
Rizwan
------------------------------
Rizwan Iqbal
------------------------------
#CognosAnalyticswithWatson