Hi Paul,
Unfortunately the batch date is not always the same. We will process the data on monthly basis that's why the date is the same for each month. But different month will have different date, ranging from second of month to fifth of month.
For your suggestion, I have some concerns:
- If we do full outer join, will data be duplicate?
- will it work if the date for different months is not the same? If no, is there a way to just compare the months and year?
Your suggestion will solve half of the issue. Another half is the value we want to compare is non-consecutive date. This is how I cast the date into varchar
Year_Month := cast ( _year ( batch_date) ; VARCHAR ( 4 ) ) + '-' + cast ( _month ( batch_date) ; VARCHAR ( 2 ) )
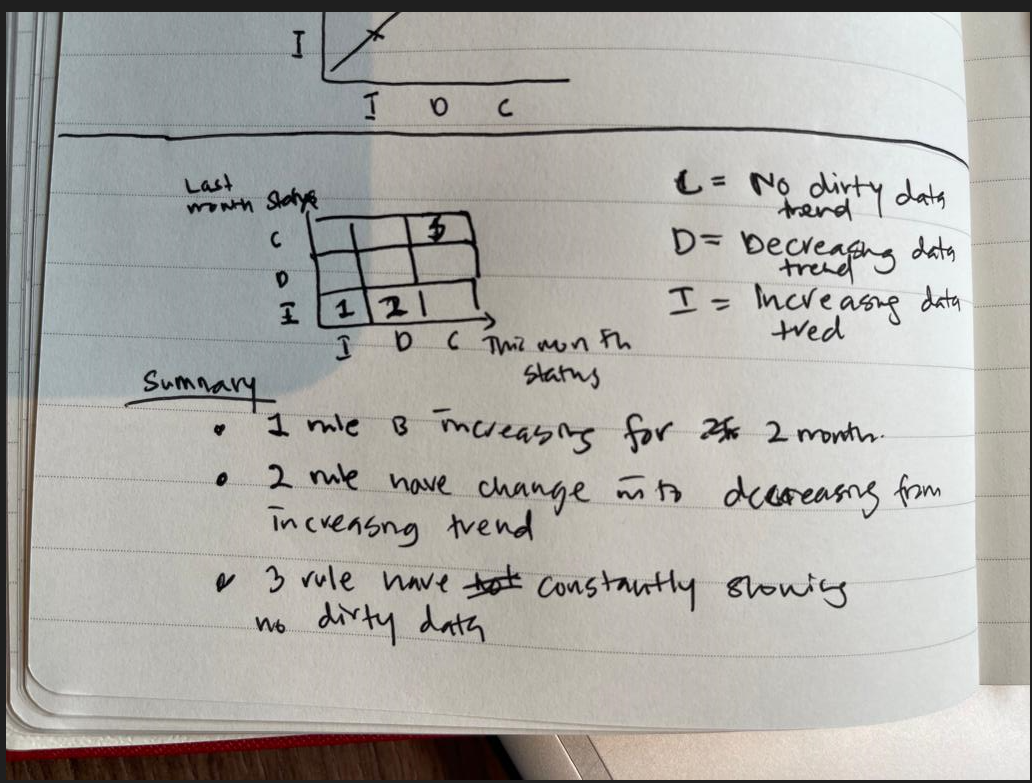
So basically the user will have the option to select any date. For example, if the user select date Jan -2022 and Dec - 2022, the data will treat Jan-2022 and Dec-2022 separately. So basically the X axis will be Current-Category(Dec-2022) while the Y-axis will be Previous-Category(Jan-2022).
------------------------------
Mohamad Aiman Arif Mohamat Saat
------------------------------
Original Message:
Sent: Fri March 17, 2023 07:04 AM
From: Paul Mendelson
Subject: Comparison of two trends in Cognos Dashboard
This sounds more like a data prep or query issue than a visualization issue. It looks like the batch date is always on the second of each month. If that never changes ,you could probably get away with making an alias of the table and doing a self join on tbl.batch_dt= add_month(aliastbl.batch_date,-1) and tbl.id = aliastbl.id.
If you expect IDs to be added or dropped from the table, you may need to make it a full outer join.
Once you've done that you'll have two category fields, one for the current period and one for the previous. Just pull those in and it should show you what you're looking for.
------------------------------
Paul Mendelson
Original Message:
Sent: Fri March 17, 2023 05:29 AM
From: Mohamad Aiman Arif Mohamat Saat
Subject: Comparison of two trends in Cognos Dashboard
Hi all,
We are using IBM Cognos Analytics with Watson (11.2.0).
Currently we have date, ID, Category, Current_total_record and Last_total_record.
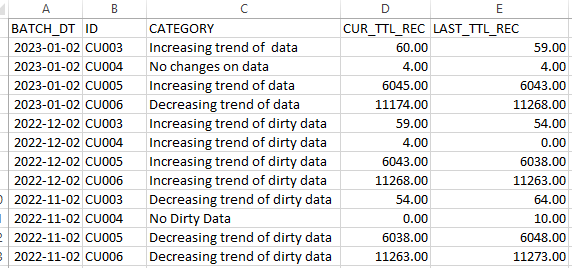
The category is referring to the trend of Current_total_record and Last_total_record.
EG.
For ID CU003, the trend is increasing as the current total is 60, which increasing from 59 (Last_total_record).
Is there a way to map the category for current vs category for previous like shown in below example?

Any help is deeply appreciated.
------------------------------
Mohamad Aiman Arif Mohamat Saat
------------------------------