If our TM1 and planning analytics modelers were all seeing and all knowing we wouldn't ever have to create a custom consolidation. Every roll-up of accounts, product, regions and anything else we want to report on and plan for would always be there in the TM1 cube. Our model creators aren't perfect. That's why the calculation capability exists, so that you can create your own custom consolidations, and since Planning Analytics Workspace SC48 and PA 2.0.9 you can create calculations that respect the rule logic of the cube by selecting
Aggregate as your roll-up method.
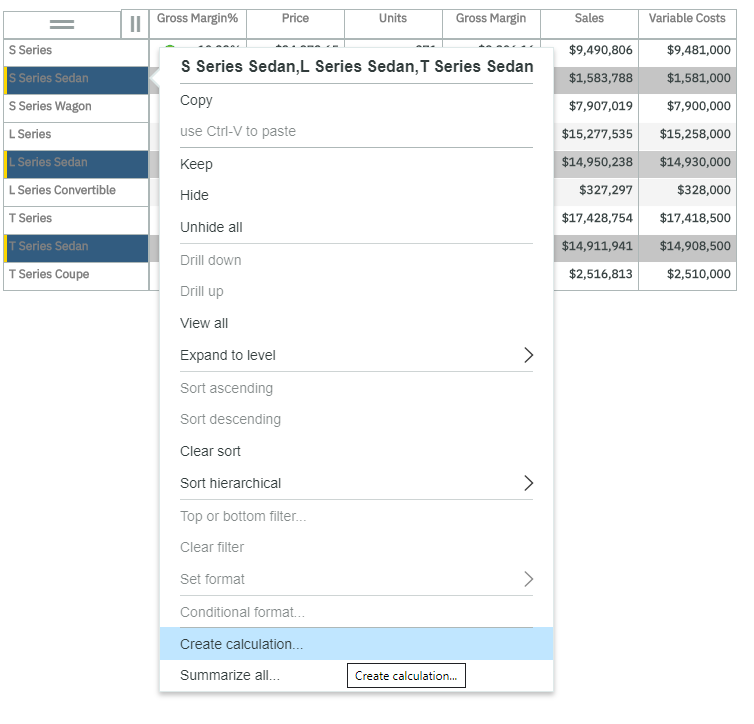
Here's how it works. In this example, I'm showing key indicators for all of our product lines, but I'm interested in seeing a summary for all sedans. I just control click the three sedan product lines and select
Create calculation.
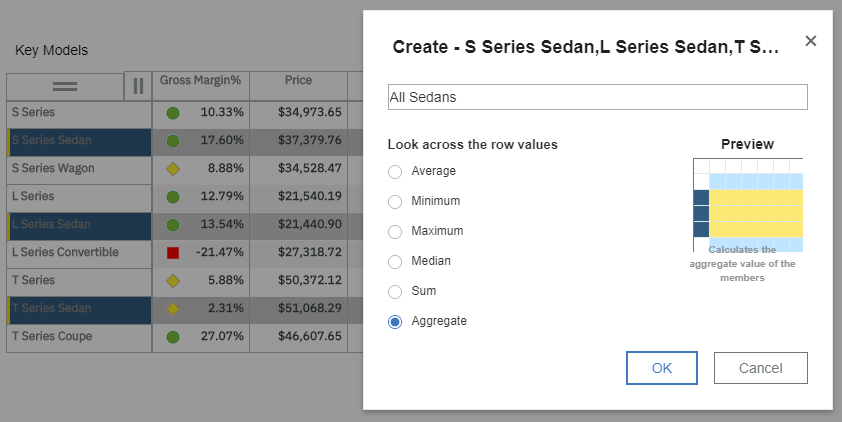
The new option here is the Aggregate option. Instead of doing a simple sum or average, the aggregate calculation respects the rule logic.
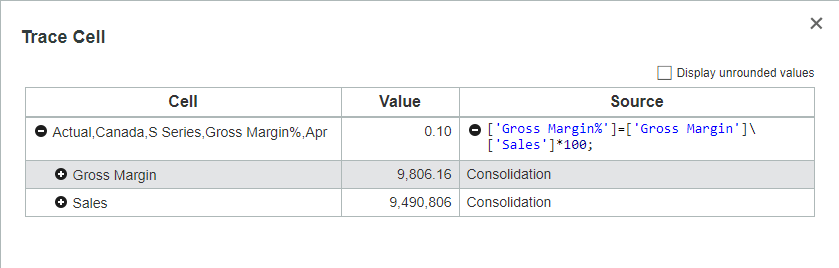
If we trace the cell to look at the
Gross Margin % calculation we can see it's
Gross Margin \ Sales * 100, in other words, a percent calculation and we know we can't just average percents, so while Aggregate might add up all Sales or Costs, for Gross Margin % it will do the percent calculation at the consolidated level for All Sedans
The result is a custom consolidation for All Sedans that calculates correctly for all types of values. That All Sedans calculation can be saved with the view in the content store and it can be used in the exploration crosstab like any other member, so you can use it in the context, swap it to columns or even use it as the basis of another calculation.
 #dashboard#News-BA#News-BA-home#pa-home#PlanningAnalyticswithWatson#PlanningAnalyticsWorkspace#What'sHot