The Problem
When a dashboard is created in an enterprise solution, the starting view may not be suitable for all users. For example, our dashboard author has created an opening visualisation based on Product Lines.

But what would this dashboard look like if the consumer only had access to certain Products within a single Product Line (perhaps by data security). In this case the dashboard would open just showing a single Product Type, the user would have to drill down/navigate to the Product level to make the dashboard useful to them.
If the dashboard contains numerous visualisations, then the user has to drill/navigate on all visualisations. And they have to do this every time they open the dashboard. If many users, with many types of security you quickly see most users do not find this default dashboard very useful.
These users could drill/navigate and save the dashboard. But that would end up with hundreds of copies of the enterprise dashboard. If the enterprise dashboard is changed, who would update all the copies?
In an enterprise solution – how could the dashboard instantly useful to everyone, whilst still only having a single dashboard?
Within this post I will show how to make enterprise dashboards instantly useful to all users.
The Source Data Module
I will use this simplified Go Sales data module to demonstrate the techniques.

The tables are cut down versions of the usual Go Sales example tables.
The Product table looks like:

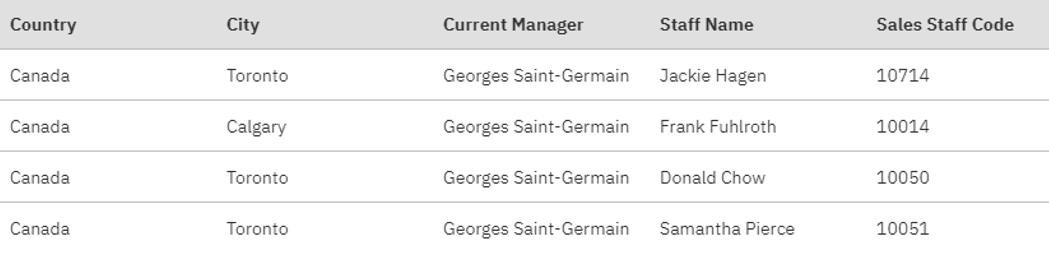
The Staff table looks like:
And the Sales table looks like:

User Defined Starting Point on a Single Table
In my opening I discussed the user having the ability to set the level of the Product dimension. The imagined scenario is that the Product table is secured, a user may have limited access to members of the dimension. The user should be able to choose to start their dashboard at Product Line, Product Type or Product level.
The user story…
The user story is as follows.
I open up the enterprise dashboard:

By default, it opens on Product Lines. My preferred view would be Product Type. I access my global parameters and set my preferred default to Product Type.

When I now open the dashboard, it opens at Product Type level:

When I drill down;

the Product Type drills to Products.

Being based on a global parameter, any dashboards and reports authored correctly, will open up with my preferred Product level.
Depending upon my starting level my drill path could be either 3 levels deep: Product Line > Product Type > Product; or one level deep: Product.
Implementation
Behind the implementation is a drill paths definition. For simplicity I have used an excel file, but there is no reason that this cannot be any table.
This file looks like:

- LEVEL_ID
Each row has a unique Id.
- LEVEL_ORDER
Within the Global Parameter, I want to show the available levels ordered correctly.
- LEVEL_EXPRESSION
This is the expression for the level. In this sample it is a simple 1:1 to a column id on the product table.
- LEVEL_DISPLAY_NAME
This is what I display in the global parameter.
- NEXT_LEVEL_ID
This defines what the next level is, what the level should drill down to.
Note the circular reference in the PROD level. This drills back to itself. This is needed as depending upon the starting path the drill could be either 3 or 1 level deep.
This file is uploaded to Cognos Analytics and then brought into the data module so that I can create a report on it to build the global parameter.

Global Parameters can be imported from a report. I have created a report that contains a prompt for the Parameter ‘Product Opening Level’. The report has a drop down prompt with:
- Use value set to LEVEL_ID
- Display value set to LEVEL_DISPLAY_NAME
- Sorting set to LEVEL_ORDER
Within the report, this prompt looks like:

This report is imported into the Global Parameters of the Manage > Customisation > Parameters.

After importing the Parameter is made available to All Roles.

If this is done successfully then the Global Parameters list should now show the value prompt for Product Opening Level. (You may need to log out/in for the parameter to appear).

By default, the parameter is not set. In this scenario it is assumed that the user is happy with the enterprise default.
With the Global Parameter and the Drill table the final part of the solution can be implemented.
The essence of the solution is to create calculations on the product dimension that define User Relative levels for Level 1, Level 2 and Level 3 of the dimension based upon the global parameter. There are three levels as at the maximum the drill path is three levels deep ( Line > Type > Product).

These User Level calculations use the macro language.
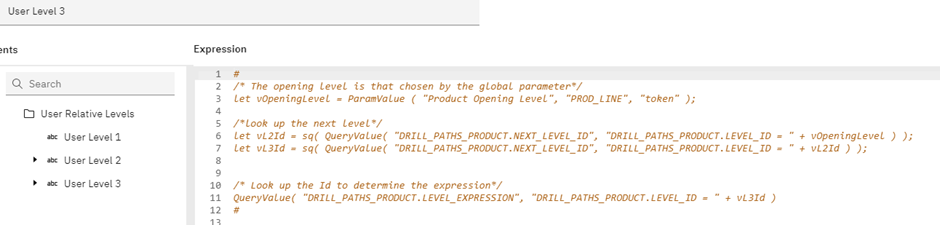
The User Level 1 calculation is:

The ParamValue function is used to set the value of vOpeningLevel to that of the Product Opening Level global parameter. If this is not set, then the value PROD_LINE is used.
Using the QueryValue function we can return the LEVEL_EXPRESSION from the DRILL_PATHS_PRODUCT table for the vOpeningLevel. A reminder of what is being looked up, and what is returned.

(Any of the macros shown in this post could be written with nested functions, using the Let statement makes the code more readable.)
The User Level 2 calculation is a bit more complicated. Knowing Level 1, we can look up the NEXT_LEVEL_ID.

and with the NEXT_LEVEL_ID we can look up the appropriate column, just like we did for Level 1.

Level 3 is very similar.
If the global parameter is not set then these calculations return:

All levels are needed.
If the global parameter is set to PROD then these calculations return:

All levels are populated, even though they are not needed.
Finally, a navigation path is created on the relative levels.

(Some thought should be given to the level names as User Level 1/2/3 are very ambiguous.)
If Dashboard and Report authors want to create content based around the users default they simply use the calculation User Level 1 instead of Product Type.

Limitations: Within dashboards the calculation name will always be shown as User Level 1. Report Authors have the advantage of having access the PromptDisplayValue function, or the QueryValue function to turn the LEVEL_ID to the LEVEL_DISPLAY_NAME within the report.
User Relative Levels and Absolute Levels
Most dashboard users know of the ‘drill down’ functionality to get more detail. More experienced users also know the Navigate option to just to a specific level rather than drilling multiple times.
The generic name of the user defined levels makes using navigation paths difficult. If I want to show Product Lines which one should I choose? You can’t provide instructions as Product Line could be in any of the level!

For this reason, there is still a need to create navigation paths for the named levels. For example, there is still a need for the Product navigation path.

Both navigation paths have an All level. This allows the user to switch from the unnamed levels navigation paths to a named level. When a user wants to switch to navigate to s specific level they can then use the named level rather than have a guess at L1, L2, L3…
The All level technique is documented here:
https://www.ibm.com/support/pages/cognos-analytics-navigation-paths-%E2%80%93-navigate-between-hierarchies-using-%E2%80%9Call%E2%80%9D-level
User Defined Starting Point on Multiple Tables
We have seen how to implement this technique when the starting point and navigation path is on a single table, but what about if the starting point could come from multiple tables?
In my simple example, what would I do if some users wanted their starting point to be a level from the Product dimension, whilst other users wanted a starting level from the Staff dimension?
The complexity here is that calculations that involve multiple tables must be standalone calculations. Level 2 could be from either the Product or Staff dimension. Standalone calculations cannot be used in navigation paths.
If all you need is to set the default starting level, then then single table technique can be used. Just create a standalone calculation for Level 1 rather than a query calculation and ensure the expression includes the table qualifier (PROD.PRODUCT_TYPE and not just PRODUCT_TYPE) in the expression.
If you want drill down, then a new technique is needed.
The user story
As a Product Line Manager I want my dashboard to open up looking at product line. I use the global parameter to set my opening level to Product Line:

The enterprise dashboard opens at Product Line, ready for me to drill down.

As a Sales Manager I want my dashboards to open at Sales City, I set my global parameter as City:

The enterprise dashboard opens at City, ready for me to drill down:

It would be very rare that we would want a dashboard visualisation to change so much.
The example given here is to demonstrate a technique. It would be very rare that we would want a dashboard to changed to different dimensions. It would be more likely we would want to analyse products and sales locations in very different ways. But there are scenarios in an enterprise data warehouse when there could be multiple organisation tables, in which case a technique is needed.
Implementation
As navigation paths cannot use standalone calculations a single query subject and calculations are needed for any table. It is this table that is used for the starting level and navigation paths:

As the deepest navigation path has four levels, then this table needs four levels.

A SQL query is used that modifies itself to point to the correct table and columns. As a SQL query is needed this technique will only work against relational data sources.
This SQL query is joined to the fact just like any other dimension:

In order to work the technique needs to know:
- The user levels and columns.
- The table used for the columns.
- The join to the fact table.
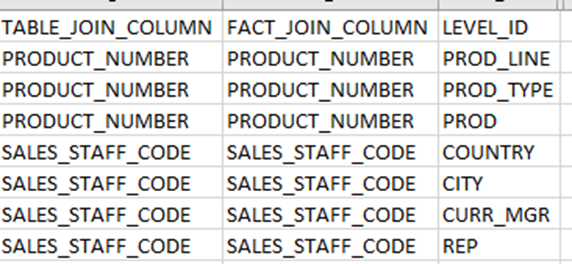
These issues are addressed in the drill path file/table. For a multi-table solution the drill path file looks like:

- DRILL_PATH.
The table contains multiple drill paths. In this example we have a Product Drill Path and a (Sales) Rep drill path. This column helps us identify each.
- TABLE.
This is the underlying SQL table that is used to create the new table.
For the Product drill path, the PRODUCT table is used. For the Rep drill path, the STAFF table is used.
- TABLE_JOIN_COLUMN / FACT_JOIN_COLUMN
How the underlying SQL table joined to the fact table. Which two columns join to each other.
- LEVEL_ID / LEVEL_ORDER / LEVEL_DISPLAY_NAME / NEXT_LEVEL_ID.
The same columns as found in the single table technique.
- TABLE_COLUMN.
The expression to create the level.
With this information we can create a SQL query that represents the user’s preferred navigation path and starting level.
If the user chooses LEVEL_ID = CITY, then the underlying table SQL
SELECT
CITY as L1,
CURRENT_MANAGER as L2,
STAFF_NAME as L3,
STAFF_NAME as L4,
SALES_STAFF_CODE as JOIN_KEY
FROM SALES_STAFF_CODE
And on the fact SALES_FACT_CODE is used in the join.
We can do all of the above with a macro.

The SQL select statement is at the end of the macro. And this is built up using variables very like those seen in the single table entry. Basically, find the users preferred starting level, and then look up the details such as the Table, Join Key and lower levels from the Drill Paths file.
Rather than use the macro SQL function to quote values returned by QueryValue, I simply put quotes in the queryValue filter strings.
A join column must also be added to the fact table. A single calculation is added to the fact table:

That looks like:

Simply look up the column in the drill path table.
The join between the fact table and the SQL built table is:

A navigation path is built on these user columns:

As before, if Dashboard and Report Authors now want the opening position to respect the user preferred level they create content using the L1 calculation.
A report is created for the global parameter, just like in the single table solution.
Multiple Tables with Different Join Types
This is an advanced topic for experienced data modellers!
In the example shown both Product and Staff join to the Sale table on a simple single column equi-join. There may be scenarios where the join between the different dimensions to the fact.
Using the following example, I can explain how it can be resolved
- Product <-> Sales.
Product.Product_Number = Sales.Product_Number
- Staff <-> Sales.
Staff.Staff_Code – Sales.Staff_Code and
Staff.Eff_Beg_Date <= Sales.Sales_Date and
Staff_Eff_End_Date >= Sales.Sales_Date
This type of join can often be found in a data warehouse between a fact table and a slowly dimension. It allows the fact to join to the Staff record that was current at the time the fact was recorded. This is instead of using the traditional Surrogate Keys. Data modules does not have a between function, hence the verbose nature of the join.
This example shows very different joins between the Product and Staff dimensions. How can our SQL version of either dimension cope with this?
A reminder that the join between tables cannot be changed. It is set in the user interface.

- We cannot change the cardinality or the filtering strategy.
The chosen cardinality and filtering must be appropriate for both the Product and Staff dimensions join to the fact table.
- We cannot change the columns in the join.
We cannot have the join change from one column (needed for Product) and three columns (needed for Staff).
- The only thing we can change is what expression is used within the columns used for the joins. And this was shown in the previous examples. Sometimes the expression was Product Code, and sometimes the expression was Staff_code. The joined columns remain static, but the expressions within those joined columns change.
The join has to cope with the worst-case scenario. In this case the join needs three columns joined with the appropriate conditions.
In the previous solution, the join between the fact table was on a single column. The drill path table contained the dimension and fact columns.
Now, the SQL query needs to create the three columns needed on the dimension side of the join. The fact side of the query needs to supply the one key and a date. The same technique can be used but with more columns in the drill paths table.

If the REP line is looked at, this defines the columns used in the join between the Sales fact and the Sales Rep dimension. As before, calculations are created on the queries that match to these columns – that is three calculations on the dimension query mapping and two columns on the fact query. The joins between these columns are defined.
For the PROD line, the same join works! Within the columns that are not used in the join literals are used that make this part of the join always true. In this case 1900-01-2 between 1900-01-01 and 1900-01-03.