An AI in BI Approach to Data Modelling
The recent O’Reilly report, The Value of AI-Powered Business Intelligence, on infusing artificial intelligence (AI) into business intelligence (BI), makes three key points:
- “AI in BI is a game changer because it allows line-of-business (LOB) users to easily discover data-driven insights in their domain without requiring specialized, data science expertise.”
- “AI in BI makes it possible for users to ask questions in plain language and get answers back in plain language. This allows them to gain deeper insight into their data, using intuitive exploration tools.”
- “AI in BI allows for automated data cleansing and preparation…freeing up IT analysts and LOB users to engage in more productive work.”
Cognos Analytics’ AI-infused approach means that it delivers all the benefits of AI in BI described by the report, and in the recent UKI webinar, Cognos Analytics 11.1.6 - all the answers in one place!, we went deep into Data Modules to demonstrate some of the great features that make web-based data modelling in Cognos Analytics effective, easy to use and completely accessible to business users.
So, what can I do in a Data Module?
For this demonstration we focused on a fictional chain of coffee shops who want to analyse their performance. As data modelling in Cognos requires no scripting and is accessible to business users, we chose the persona of a Product Marketing Manager to create the data module.
With Cognos Analytics it’s quick and easy to create a trusted, easy to use business model for user self-service analytics and reporting, that is enriched with the key calculations the business needs, relative time (Year to Date, Current Month etc.) and easy navigation to answer the who/what/when/where/why questions. There is a complete range of intuitive GUI based tools which will guide you as a user.
An AI-Infused Starting Point
If you are using uploaded files as your data source, you can start off by simply dragging a zip file of the files you want to analyse straight into Cognos Analytics to upload and immediately launch a new data module (if you’re using any spreadsheets with multiple tabs these will be uploaded too, as separate tables). Cognos will use its built-in smarts to automatically join the files in the zip, giving you a great starting point as a user.
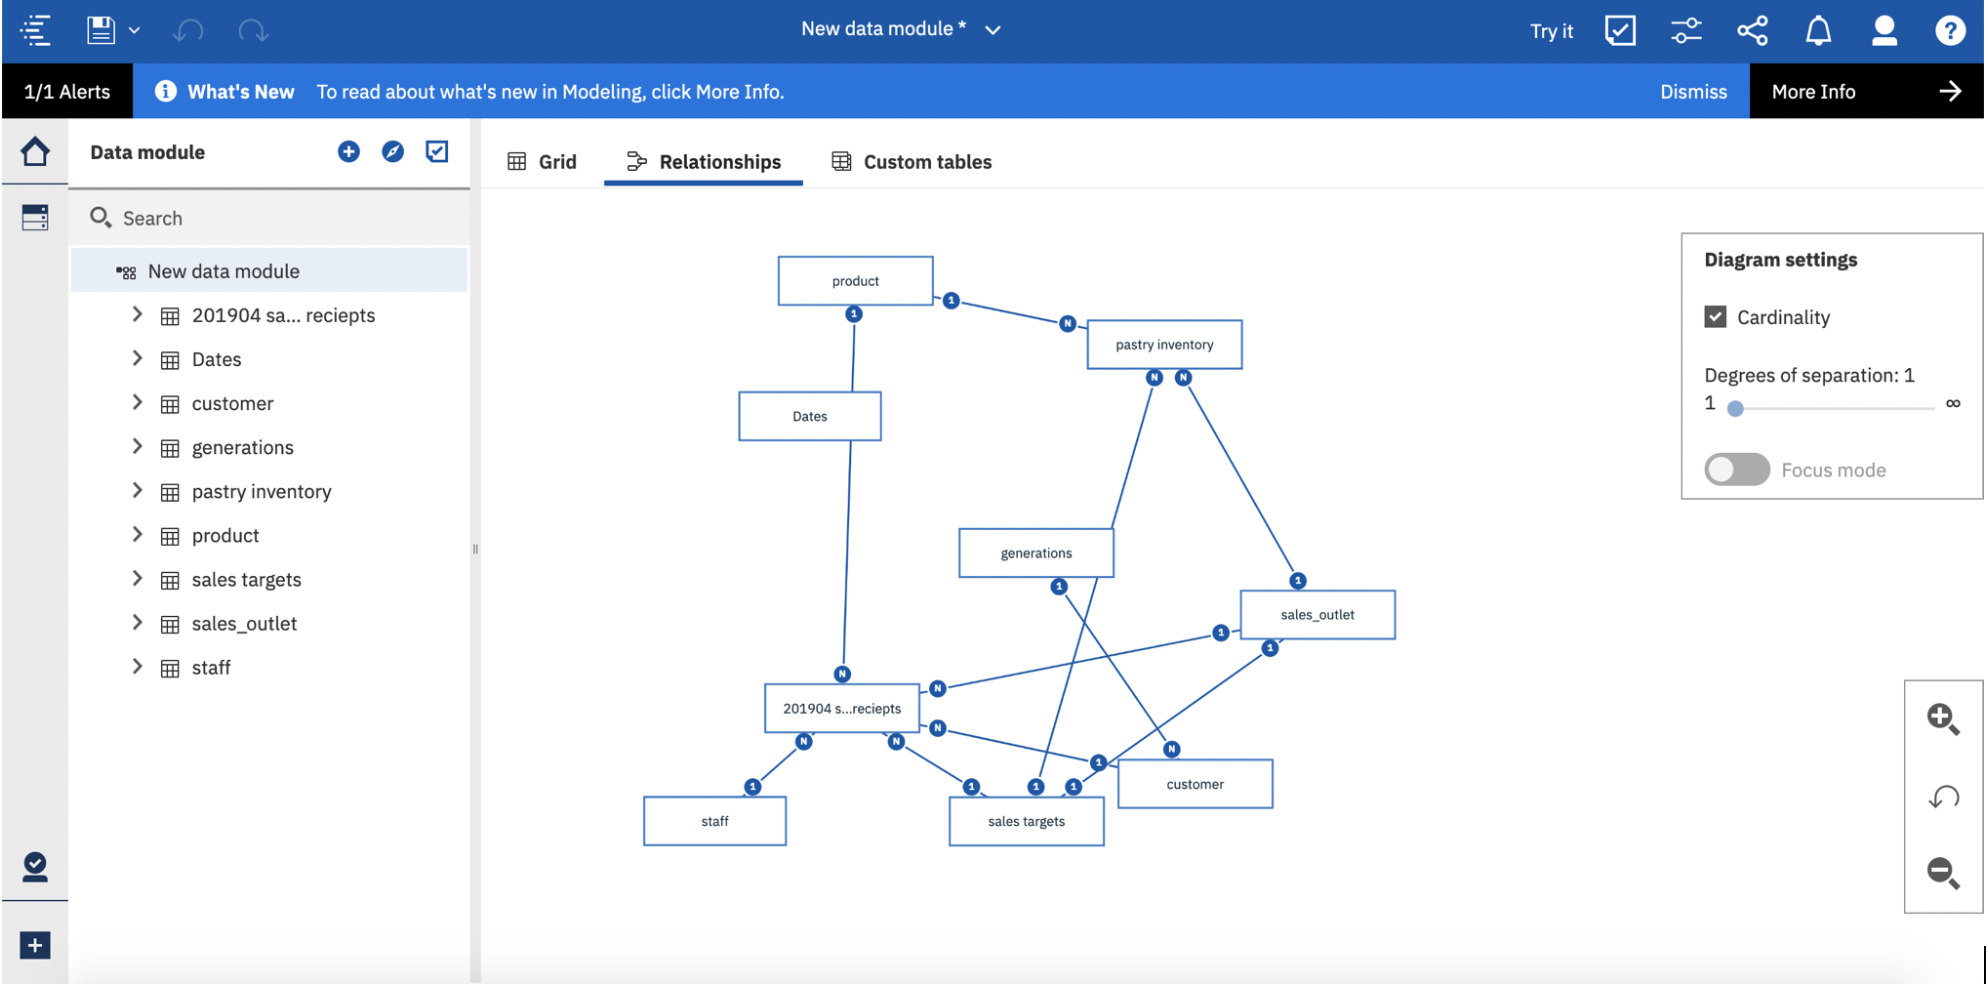
By clicking on the joins between the files you can see which columns it has matched and how it has joined them. You can also view plain English, easy to understand explanations of the join types.
During the file ingestion Cognos will also look at the data and automatically assign appropriate data types, saving you more time as a user, for example by recognising dates and times, and measures such as number of orders and quantity. You can preview the data in your files using the grid.
Add Calculations
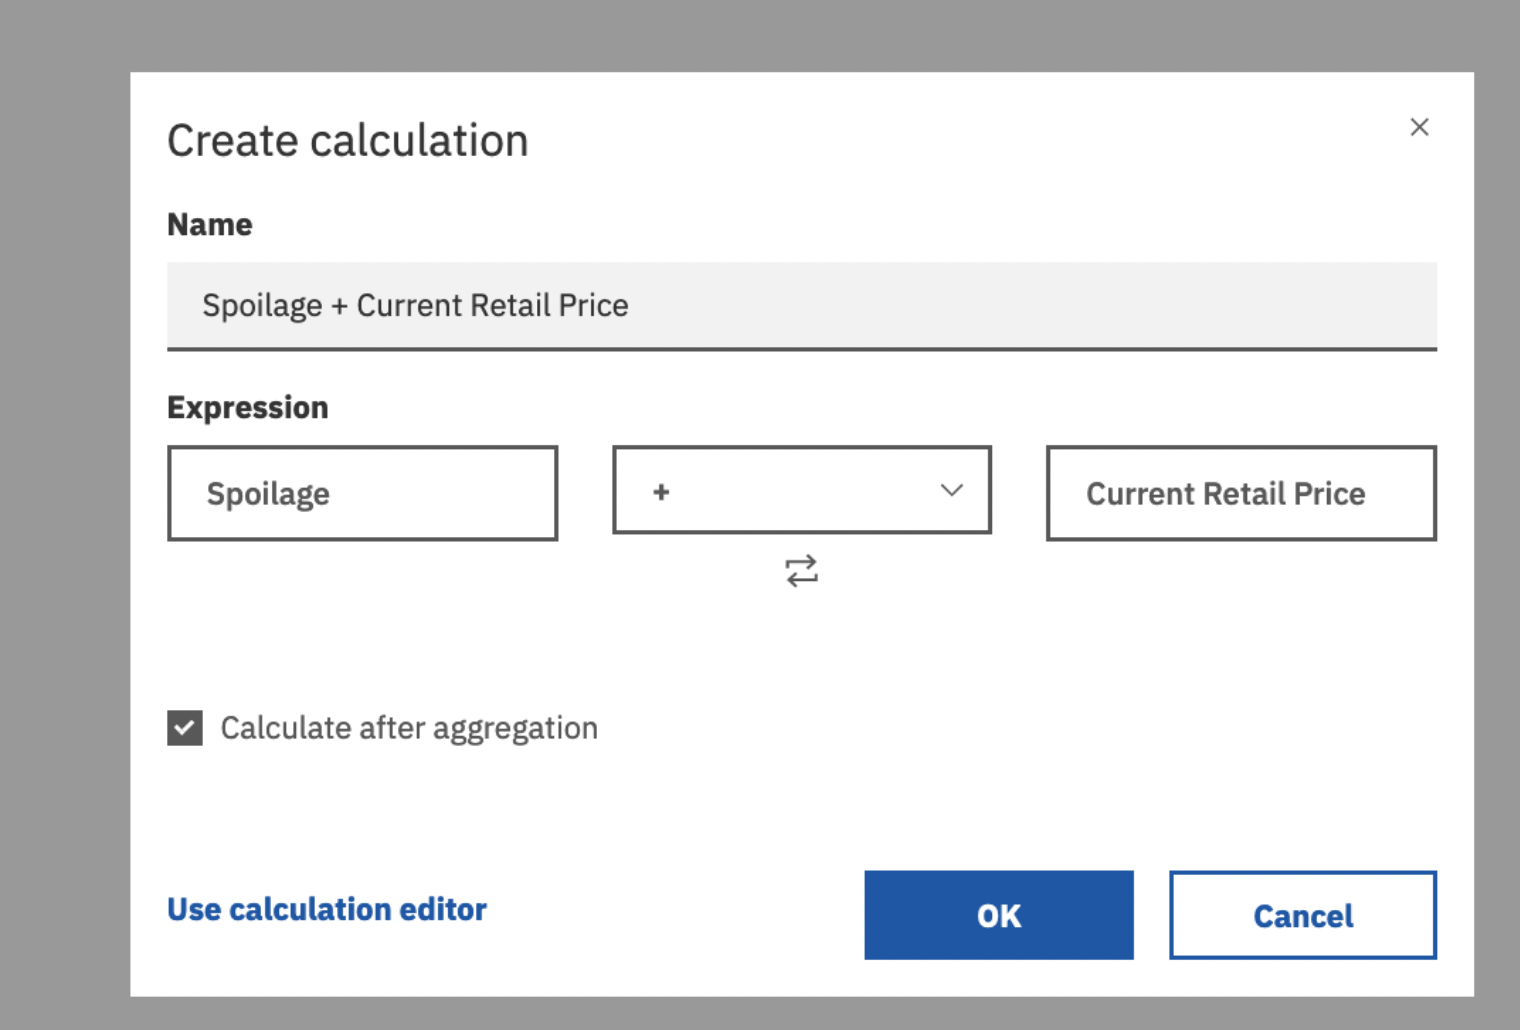
It’s quick and easy to enrich your data module by adding in key calculations. By multiselecting the data items you want to combine, you can create simple calculations in seconds. If you need a more complex calculation you can use the calculation editor, where you can use a mix of typing and dragging, and view any functions you need to use in the comprehensive functions menu. You can also preview your calculation results to check the calculation is correct before saving it.
Split Date and Time Columns
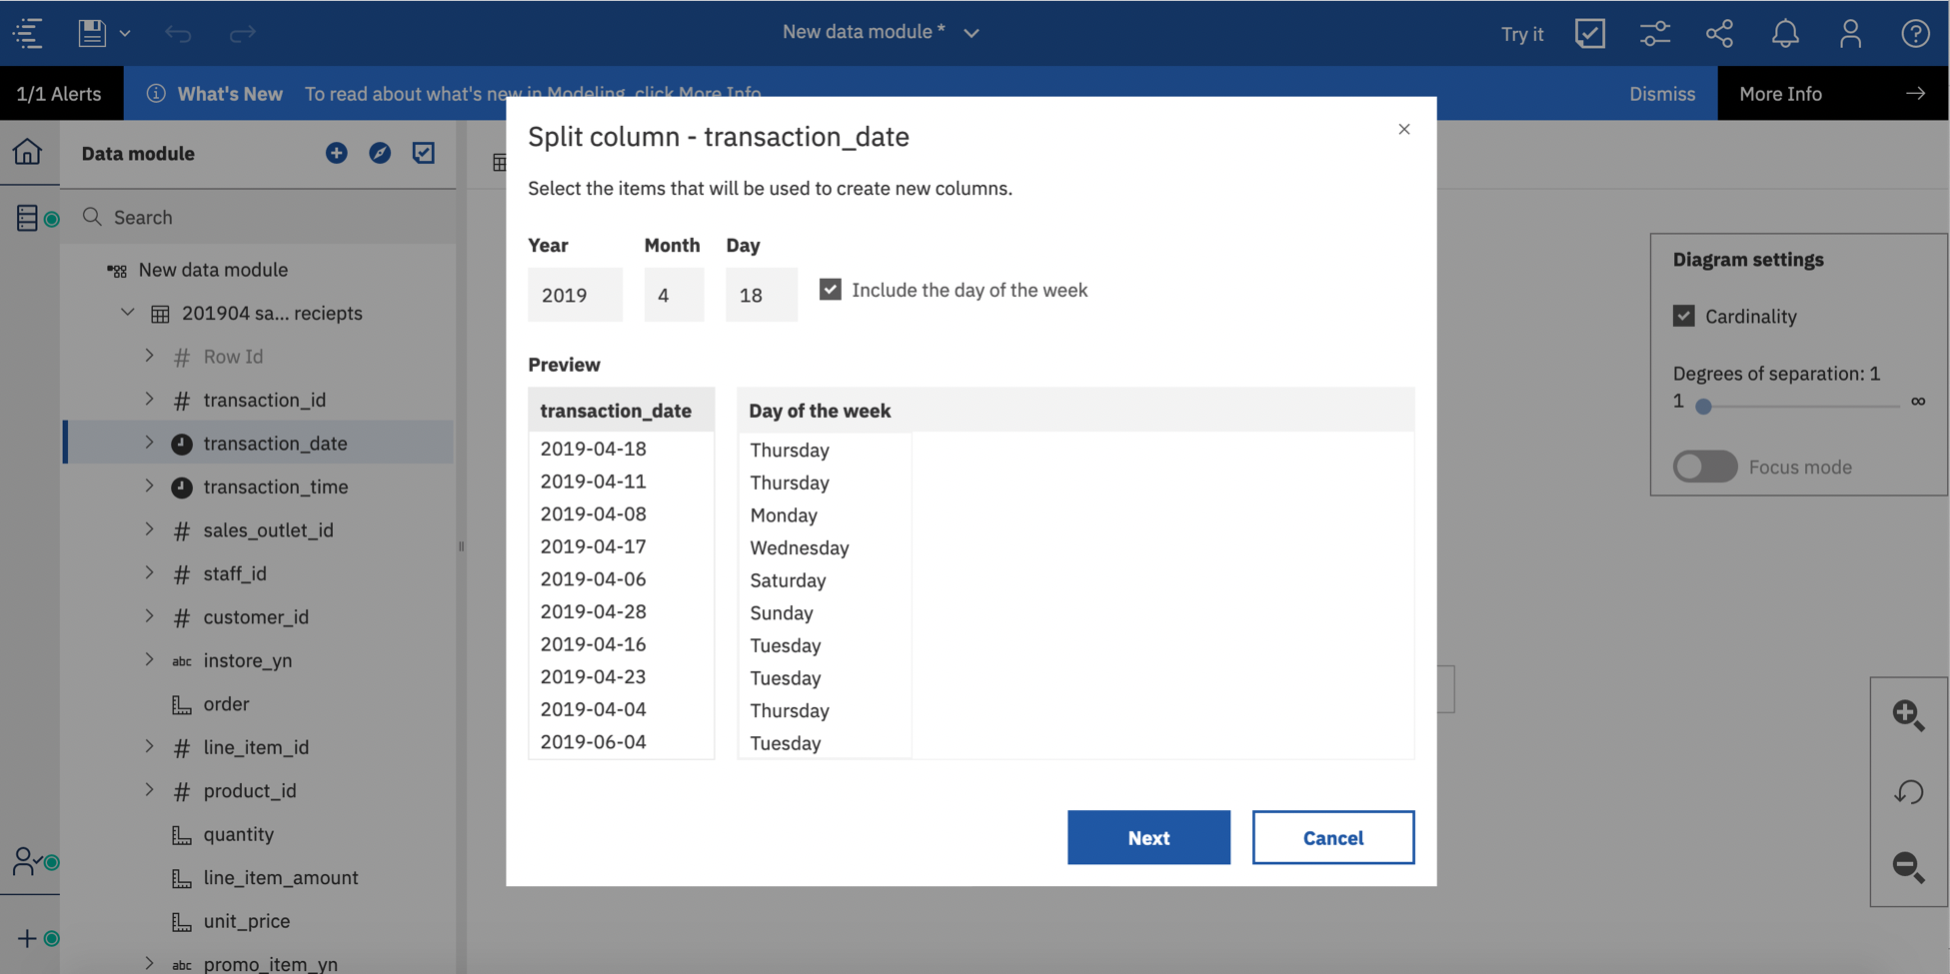
If you have date information and want to do more granular date analysis, you can split a date column into its component parts and add day of the week with just a couple of clicks. You don’t need to use a calculation to do this – Cognos Analytics has the functionality built in. Simply select which parts of the date you want broken into new columns, and Cognos Analytics will do the rest.
Intent Based Data Modelling
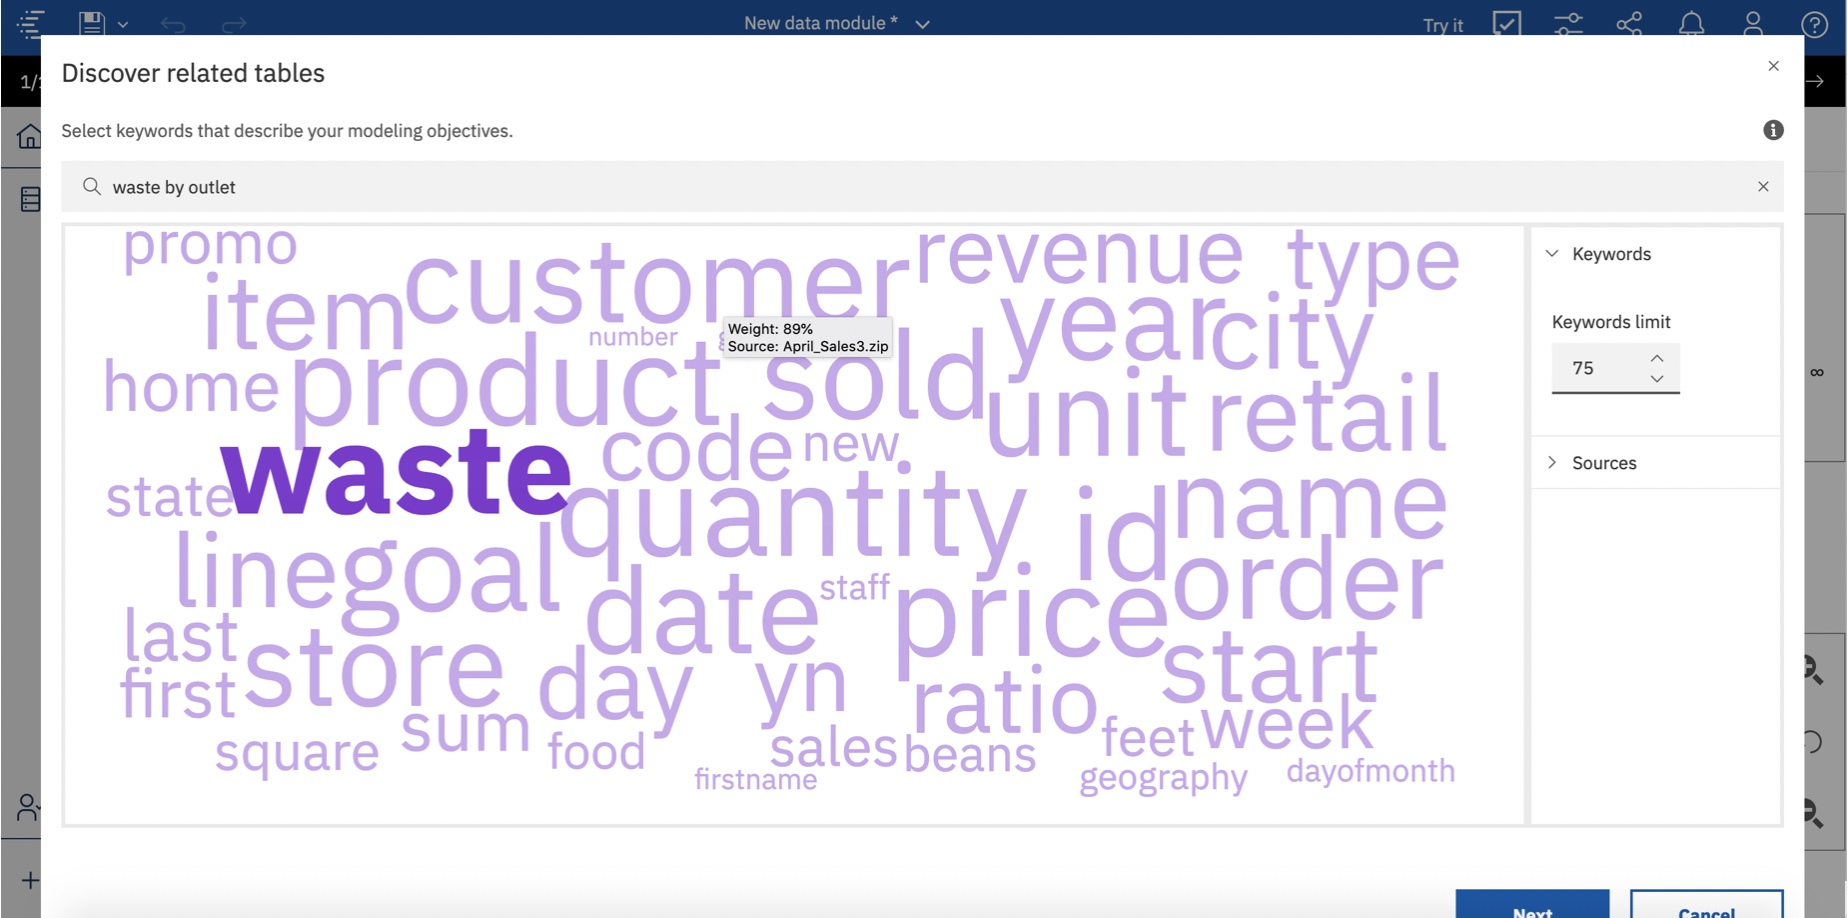
If you want to answer a more specific question Cognos Analytics can help you to create a smaller data module with just the data you need. This intent based modelling capability is called Discover Related Tables. You can choose from the keywords that Cognos suggests or type in your own question or keywords, for example “waste by store”. Cognos will then propose a model with everything you need to answer the question. This capability is especially helpful when you have a database with lots of tables.
Data Groups and Navigation Paths
To make analysis simpler you can create text-based data groups. For example, to analyse product sales for a set of product categories you might create 4 higher level data groups: Whole Bean/Teas containing loose teas, coffee beans and packaged chocolate, Beverages containing drinking chocolate, coffee, tea, Food containing bakery items, and Add-ons containing coffee flavours and merchandise such as reusable coffee cups.
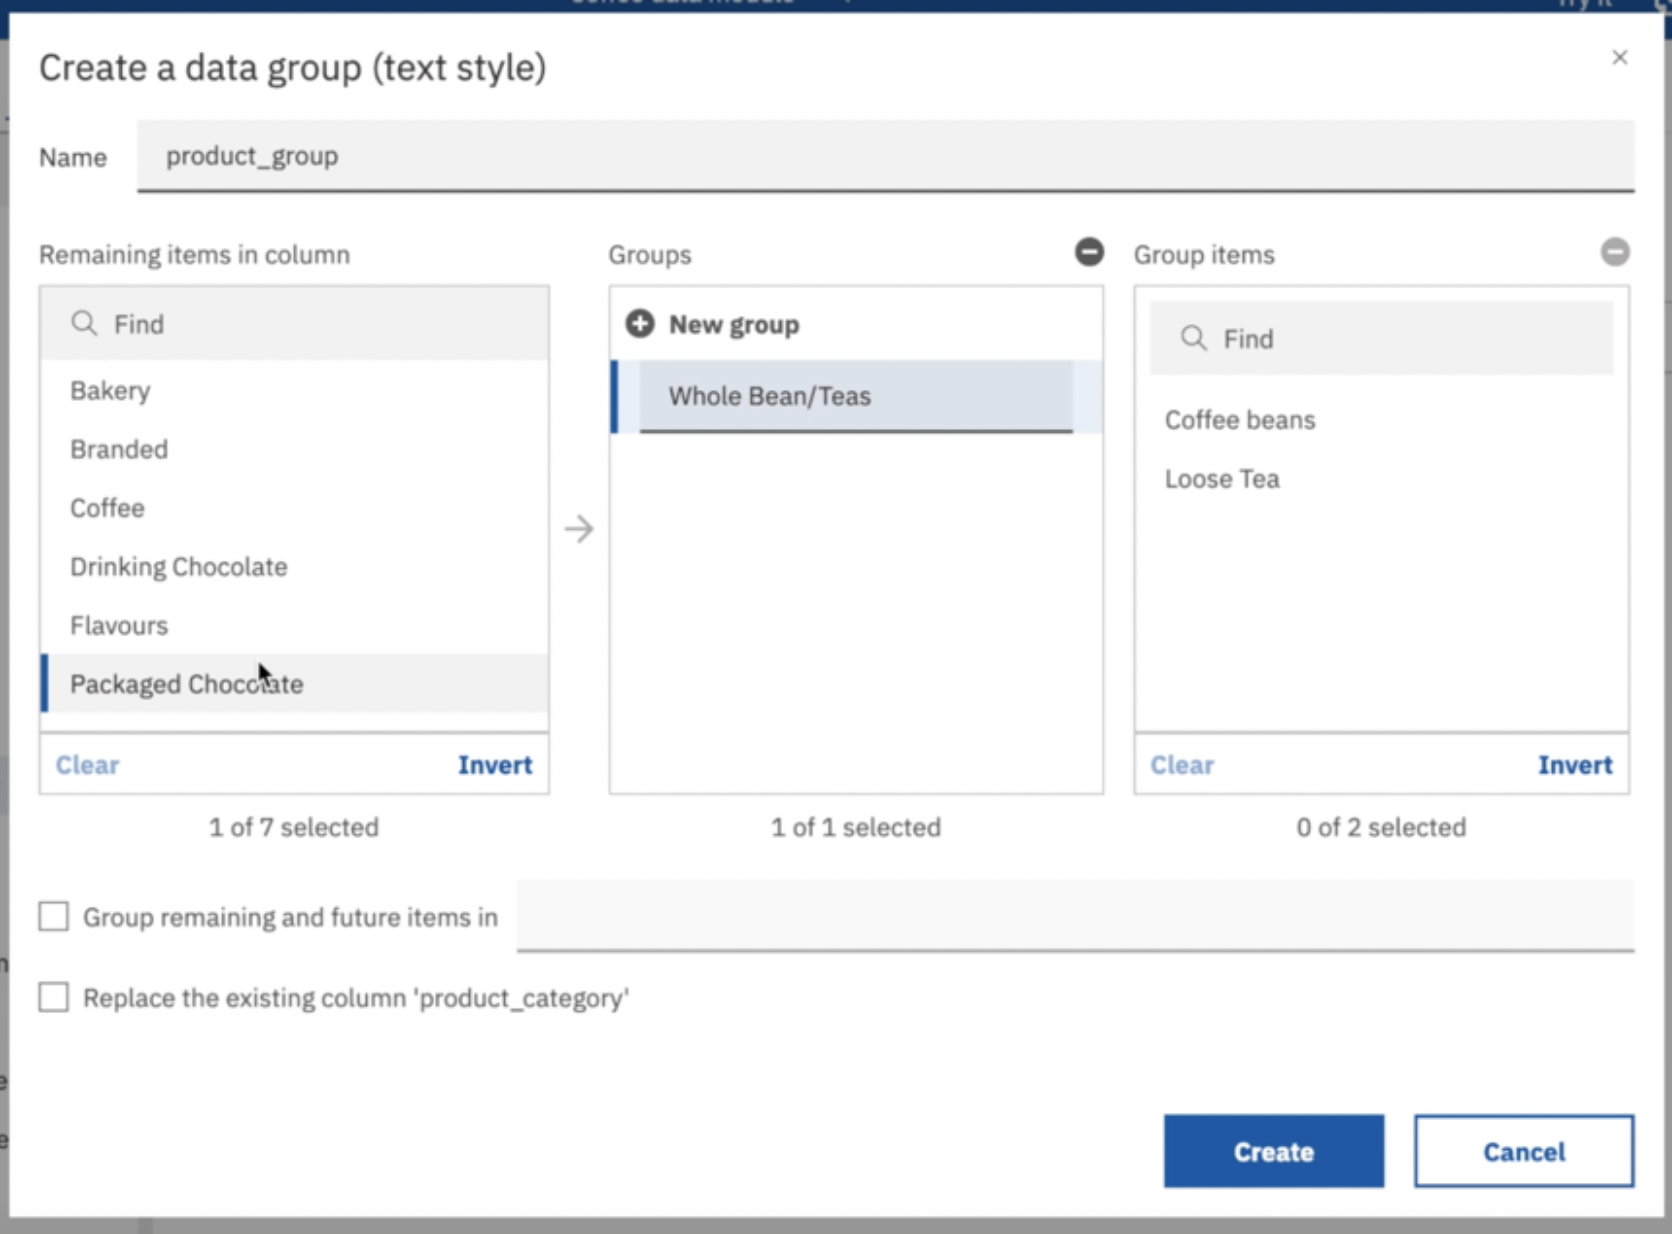
You can also create numeric data groups, for example to make analysing customer spend patterns easier by grouping transaction data into high, medium and low spend groups. For this you might group transactions from £0-£6 into Low Spend, £6-£10 into Medium Spend, and the rest High Spend.
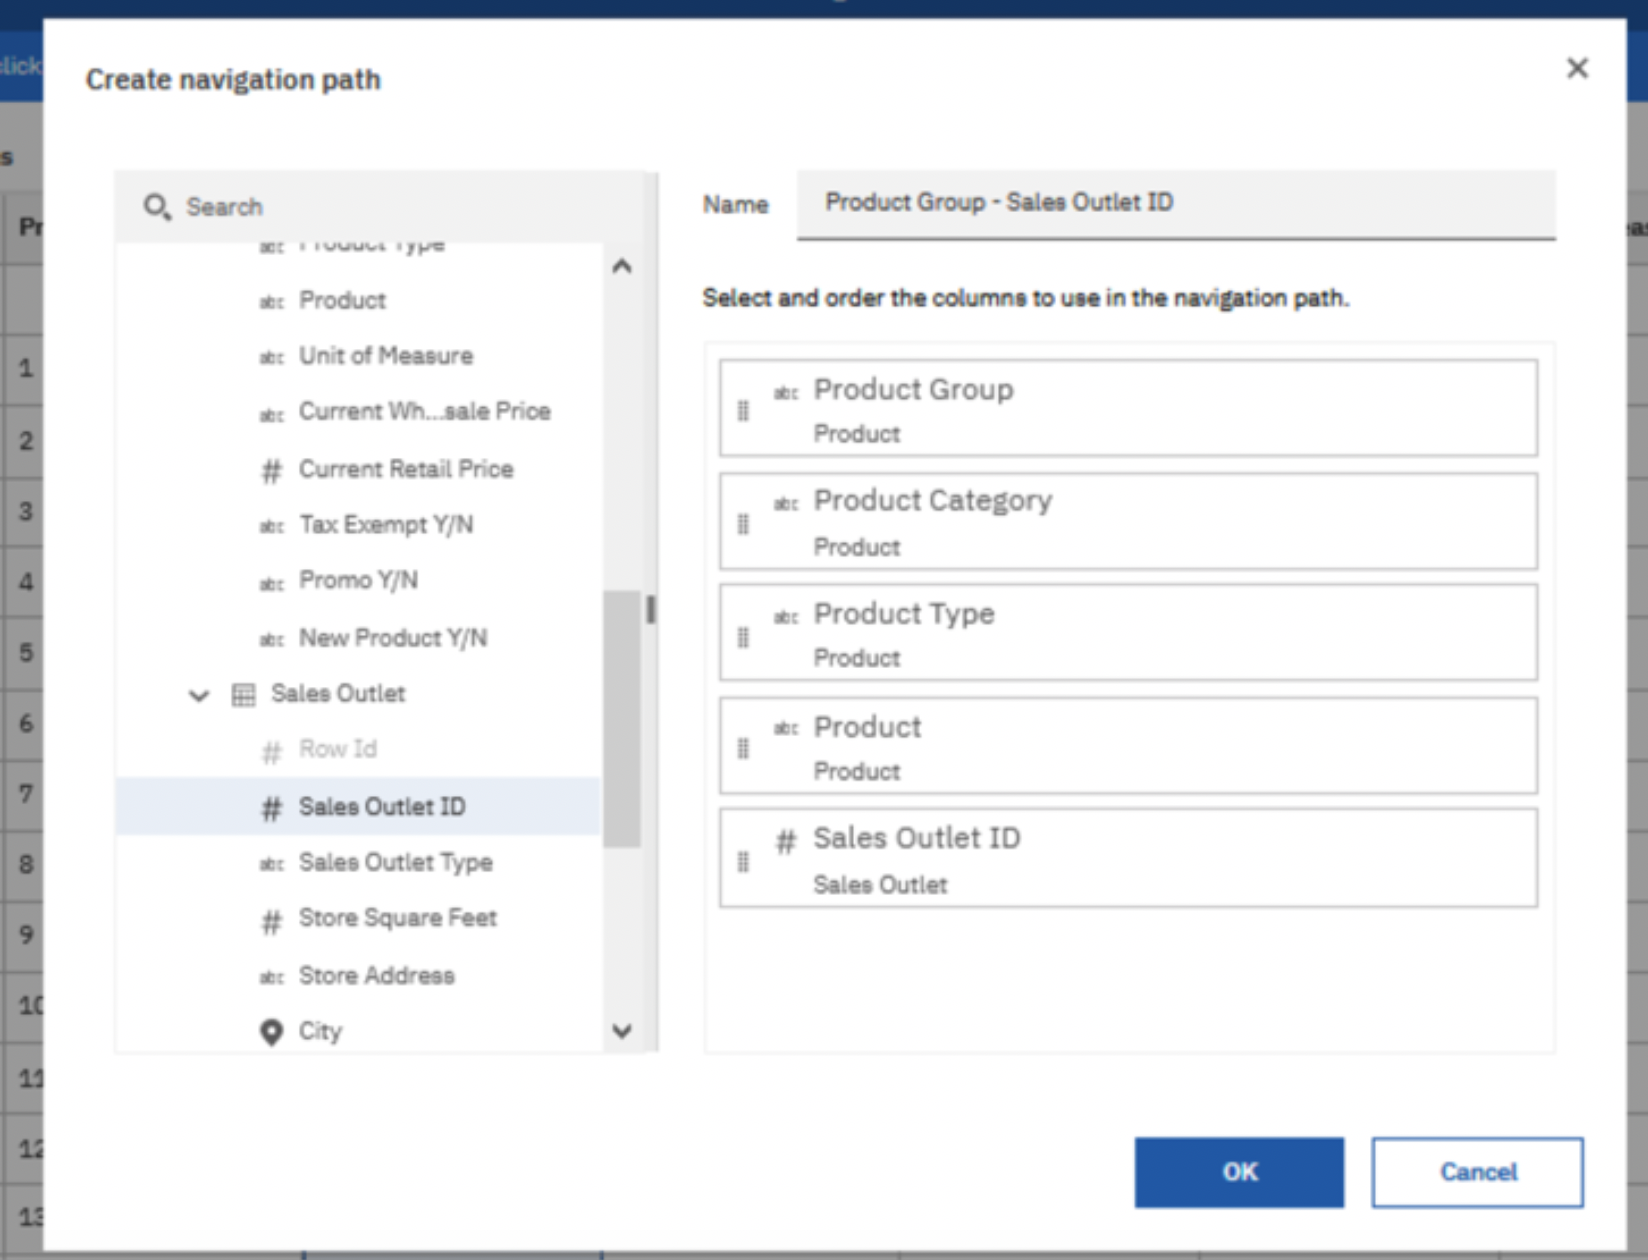
You can easily add in Navigation Paths to help users follow their train of thought and explore different dimensions in the data, and you don’t have to stick to a hierarchy either – if for example, you wanted to see which sales outlet each product was selling in you could add that in too.
Built-in Relative Time
Built-in relative time makes it simple to link up data to a calendar, allowing users to analyse figures for relative periods such as the month or year to date. Cognos Analytics includes fiscal calendars starting on every month, so no matter which month you start your financial year in, there’s a calendar ready to use. With just a couple of clicks, you can link the calendar to dates and view the new relative time periods that become available to you such as prior month, quarter and year, current month quarter and year and month to date. Having all these different time periods available makes it much simpler for users to compare current and historical results to track and measure performance and growth.
Try Out the Model
Before you share your Data Module with others you can try it to check that it has everything you need. Then just save it to your Team Content and it’s immediately available for everyone to use! Clicking on Try It opens up a new report connected to your Data Module so that you can test it and check that everything is as expected, by dragging in a couple of measures to check the figures or trying a quick visualisation.
No User Left Behind
Whilst the latest and greatest data modelling features in Cognos Analytics will continue to be added to Data Modules in the future, Framework Manager is still a supported tool which can continue to be used. Most of the data modelling features from Framework Manager are now available in Data Modules, but to help users who are transitioning from Framework Manager to Data Modules ensure they aren’t missing any functionality they need, we have documented all the significant Framework Manager features not supported by data modules. For any users starting a new project who don’t find these feature gaps significant for them, we recommend using Data Modules, and taking advantage of all the latest and greatest features described above.
Find Out More
To watch the full webinar, including a deeper dive into dashboarding, a look at data science and Jupyter notebooks in Cognos Analytics, and a talk from CogniTech Analytics Solutions, an IBM Business Partner, on their project at Nukissiorfiit helping them to adopt AI forecasting, IBM® Planning Analytics and IBM Cognos® Analytics to supply water and energy to Greenland without using fossil fuels, check out the replay here.
#ca-modeller#CognosAnalyticswithWatson#home#LearnCognosAnalytics#News-BA#News-BA-home