Overview
IBM Planning Analytics for Microsoft is a powerful product. The product allows you to use settings to customize much of how the product behaves. With so many settings, it can feel overwhelming. You might not know exactly what a particular setting does. That's why Planning Analytics for Microsoft Excel now provides you with additional information for each setting.
First, open the Options dialog.

Hover your cursor over the info icon.
By hovering over the info icon, you'll be presented with additional information to help you make better decisions when it comes to your settings.
Descriptions
In all instances, you'll see a description of what the setting does.
If no animated GIFs or images are available for the setting, you'll see a stand-alone description.
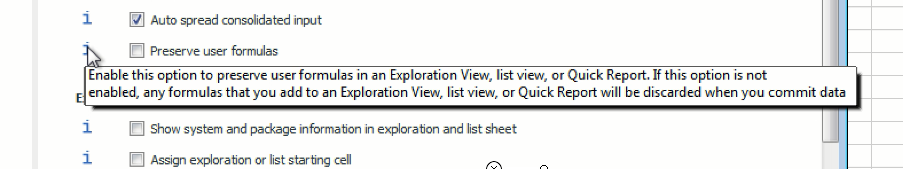
If an animated GIF or image is available, you'll see the description below.
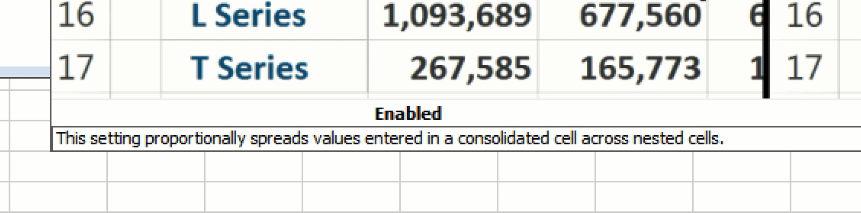
Animated GIF
If available, the animated GIFs will demonstrate to you how Planning Analytics for Microsoft Excel will behave under various parameters of the setting.
Image
If an image is available, it will show you how different setting options compare side-by-side.
And that's all. Now get out there and make those settings work for you!
#PlanningAnalyticswithWatson#PlanningAnalyticsForMicrosoftExcel