Planning Analytics for Microsoft Excel uses Excel styles to format its reports. It's why you see a consistent visual theme when creating your reports. Currently, Planning Analytics for Microsoft Excel leverages over 50 styles. But you're not limited to just using these styles. With some modifications, you or your organization can create and deliver unique and customized themes in your reports!
Get started
The Excel styles used by Planning Analytics for Microsoft Excel are generated and stored in an external workbook. To get started you'll need to open this file.
- Navigate to your Planning Analytics styles directory.
C:\Users\<User>\AppData\Local\Cognos\Office Connection\Styles
- Open Styles_CAFE.xlsx
Note: Ensure that Planning Analytics for Microsoft Excel is not loaded.
- From the Home tab, in the Styles section, click the More button.
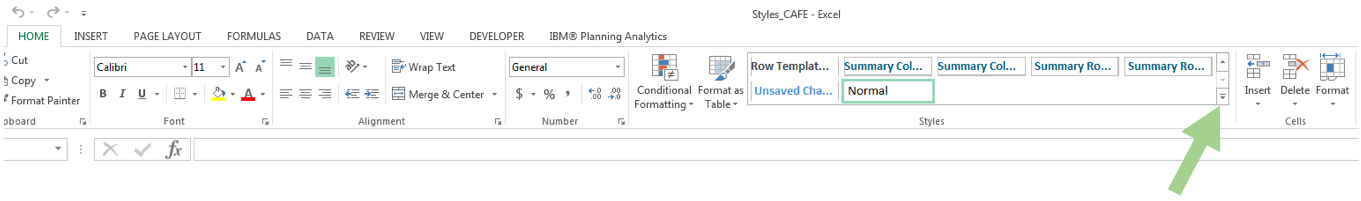
You'll be presented with all of the available styles. And there are a lot of styles. Don't feel overwhelmed, some of these styles are specific to certain report types. We'll break that down now.

Exploration Views, List views, and Quick Report styles
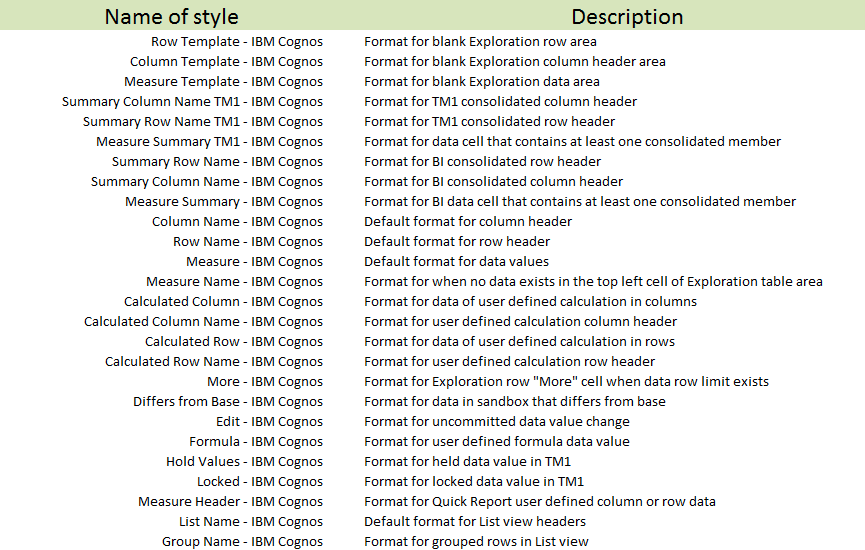
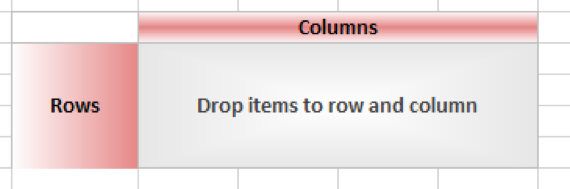
Exploration Views, List views, and Quick Reports all share a common set of Excel styles. There are styles for everything from the design of a blank exploration to the shade for data values locked by TM1. Below is a handy list of the styles that apply to these report types.
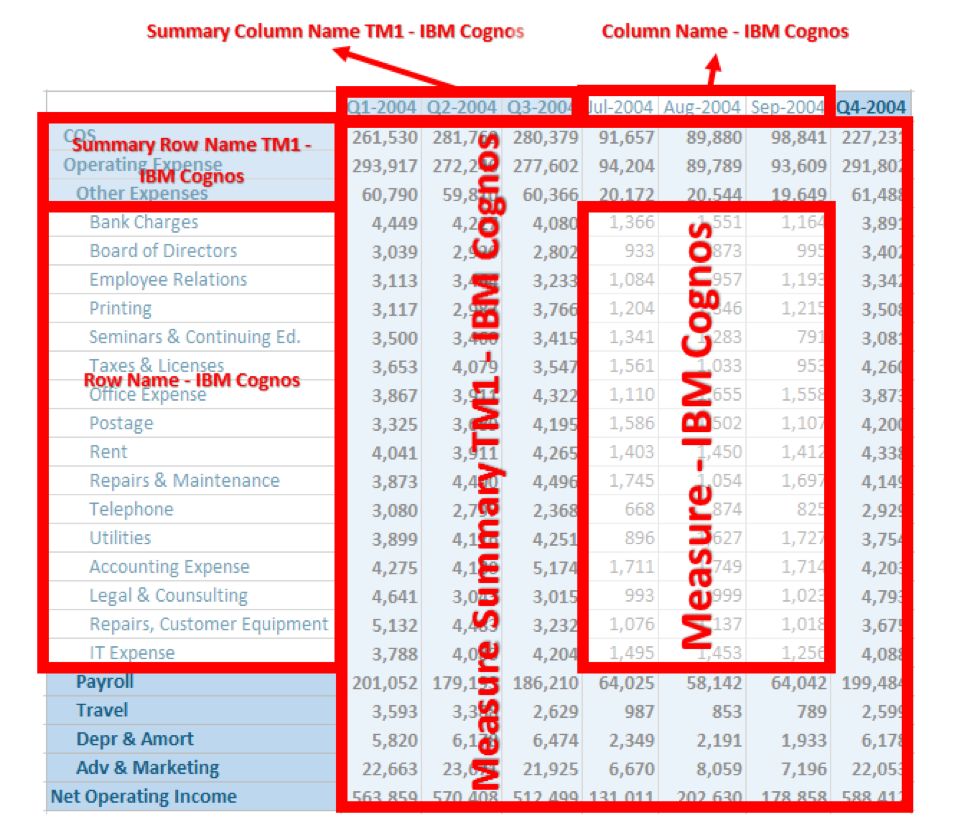
And here's where some of these styles apply in an Exploration View:
Try it yourself
Follow along to see how modifying these styles will change the look of your reports.
Change the columns
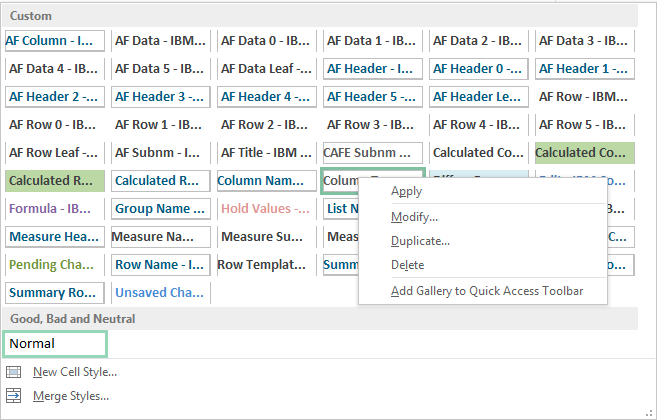
- Open the styles window.
- Right click Column Template - IBM Cognos and click Modify...
- Click Format.
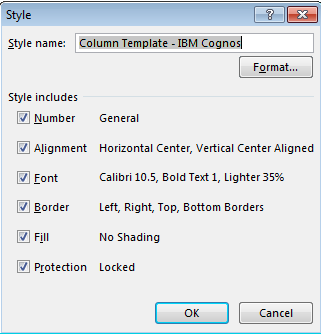
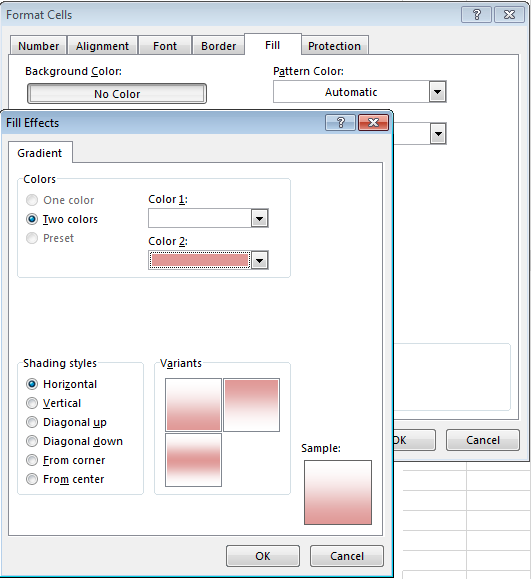
- Click the Fill tab and then click Fill Effects...
- Choose your colors and select the Horizontal shading style.
- Click OK on all of the open dialog boxes.
Change the rows
- Open the styles window.
- Right click Row Template - IBM Cognos and click Modify...
- Click Format.
- Click the Fill tab and then click Fill Effects...
- Choose your colors and select the Vertical shading style.
- Click OK on all of the open dialog boxes.
Change the measures
- Open the styles window.
- Right click Measure Template - IBM Cognos and click Modify...
- Click Format.
- Click the Fill tab and then click Fill Effects...
- Choose your colors and select the From center shading style.
- Click OK on all of the open dialog boxes.
View your style
- Save the Styles_CAFE.xlxs file.
- Restart Microsoft Excel.
- Launch Planning Analytics for Microsoft Excel.
- Create a new Exploration View.
Pat yourself on the back because you're done! Now get out there and design some awesome custom report themes.
#Planning Analytics for Microsoft Excel
#ExpertPost#formats#GettingStarted#pax#PlanningAnalyticswithWatson#PlanningAnalyticsForMicrosoftExcel#Resources#styles#Tips#Tutorials