Reports and dashboards in a planning analytics process often focus on identifying exceptions: areas of performance where the actual has not met the target or budget. Sometimes this is defined part of a predefined metrics scorecarding process (Check out the
scorecarding capabilities of PA Workspace for more information on setting up and using scorecards), but often what's required is a flexible self service conditional formatting capability. Starting with the
July 14th update of Planning Analytics any analysts and content creators can add conditional formats to their tables in Planning Analytics Workspace.
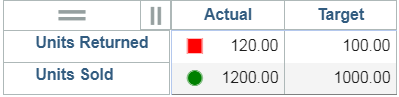
Fonts, Cells & Status Indicators
Any row or column can be formatted setting the cell fill, font color and type or a status indicator. You can even combine formats.
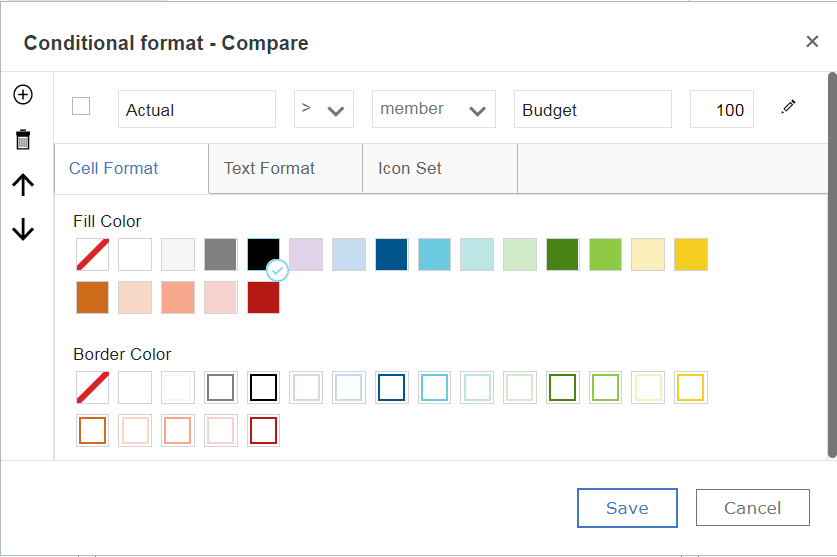
Select the Column or Row and Right Click
To set a conditional format select the column or row you want to format and right click to bring up the Conditional Format Screen.
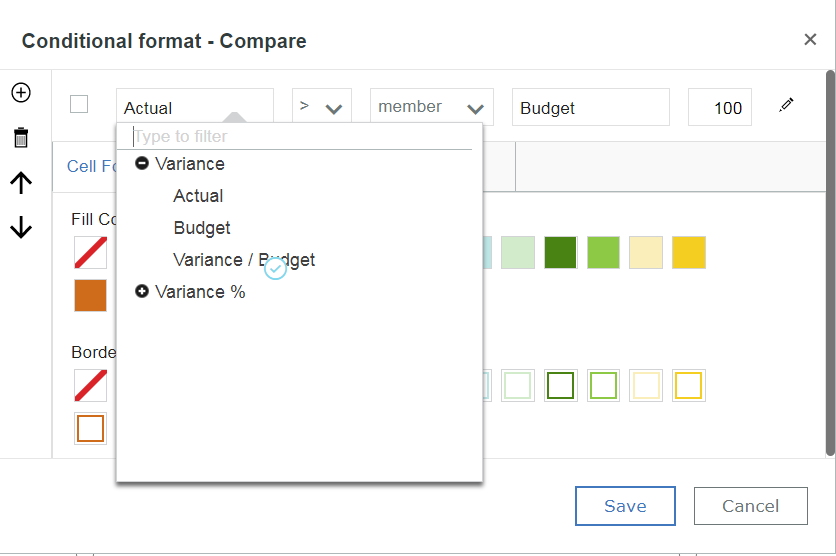
Flexible Comparison Conditions
A row or column can be formatted using a variety of comparisons. You can format the Actual column, for example, based on its own value or based on another column (such as Variance) and you can compare that to either a column to another column (Actual > Target) or to a number you enter (Variance > 10%).
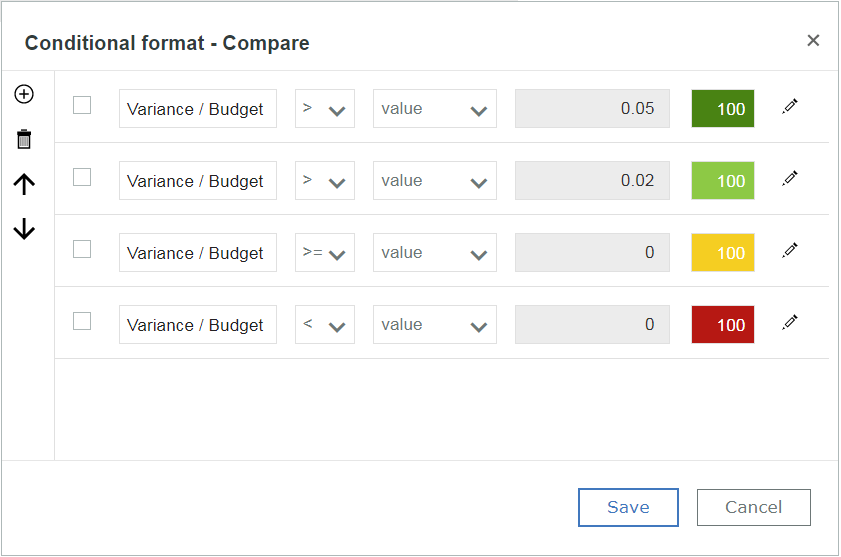
Multiple Conditions - Order Matters
In many variance reports you aren't looking just for a single condition, but a set of conditions, for example to format values from best to worst. When setting multiple conditions, take care to order the conditions to control the order the formats are applied. When a cell meets two or more conditions, the first condition applies. In the example below, a value of .06 would meet the first three conditions since it is higher than 0, .02 and .05. The dark green format is applied because that's the first condition that is met.

#PA Post
#Planning Analytics Workspace
#What's New in Planning Analytics
#administrator#analyst#book#consumer#createBoard#dashboard#exploration#modeling#PlanningAnalyticswithWatson#planninganalyticstrial#PlanningAnalyticsWorkspace#reference#Tips