To Be, or Not to Be…well it depends!
“That depends” is probably one of the most frustrating things you can hear as an LSF Administrator. Will adding 10 more hosts to the cluster solve my pending time problem? Or will changing a scheduling parameter solve it? Well that depends…on many different things. Trying a different scheduling parameter in a production cluster can be very risky, and you can’t readily just add another 10 hosts just to see if it addresses the problem.
But what if you could?
The LSF Simulator is an internal tool that we have used for many years both in Development and Support. When Support asks for your configuration and event files to reproduce an issue, they are typically loading these into the simulator and trying to reproduce the problem. The simulator itself is not approximation of the actual LSF Scheduler, it is the Scheduler running in Simulation mode. And most importantly, it runs all on one host – the execution nodes are simulated by the scheduler.
If you are running LSF 10 and have enabled Start Time Prediction you are already leveraging the Simulator – the Scheduler is periodically launching a Simulation session with time compression enabled to try and predict when jobs will finish.
As I already mentioned, the Simulator is a tool, created for internal use, so usability was never a consideration, but we have made it available to clients as part of various Lab Services projects and they have had some significant successes – once they understand how to use it, and to visualize the output.
But what if we made that easier to do?
We’ve just made a technical preview available where we have packaged up the Simulator in a container along with a simple web GUI to allow run different simulations, and more importantly, compare the results. If you are interested in trying this preview, please get in touch!
How to Use the Simulation Package
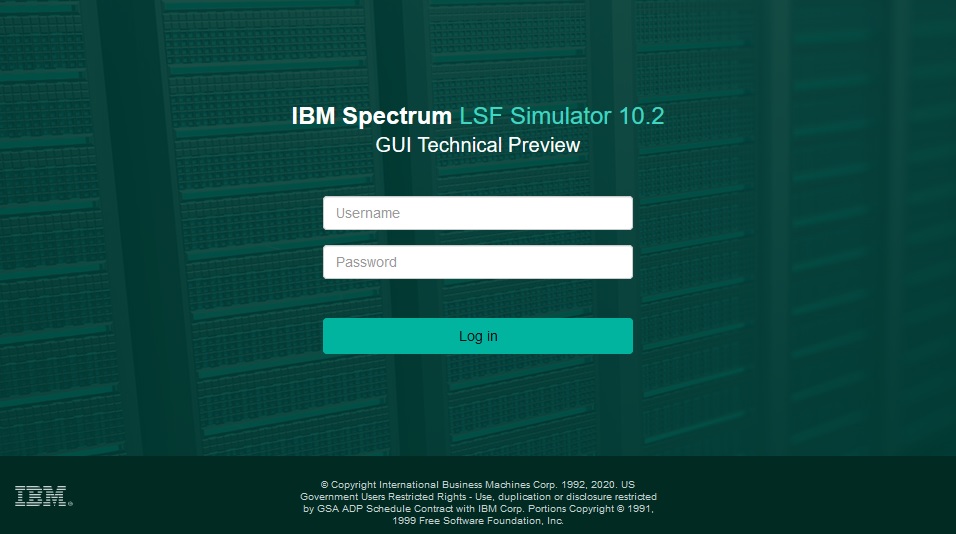
I’ll walk through a simple example of using the Simulator package – it is fair to say that it still has some idiosyncrasies, but I’d love to hear your feedback. After downloading the package, unpacking it, and launching the container you can connect to it via web browser:
Let’s look at the sample cluster configuration that is included in the Simulator configuration.
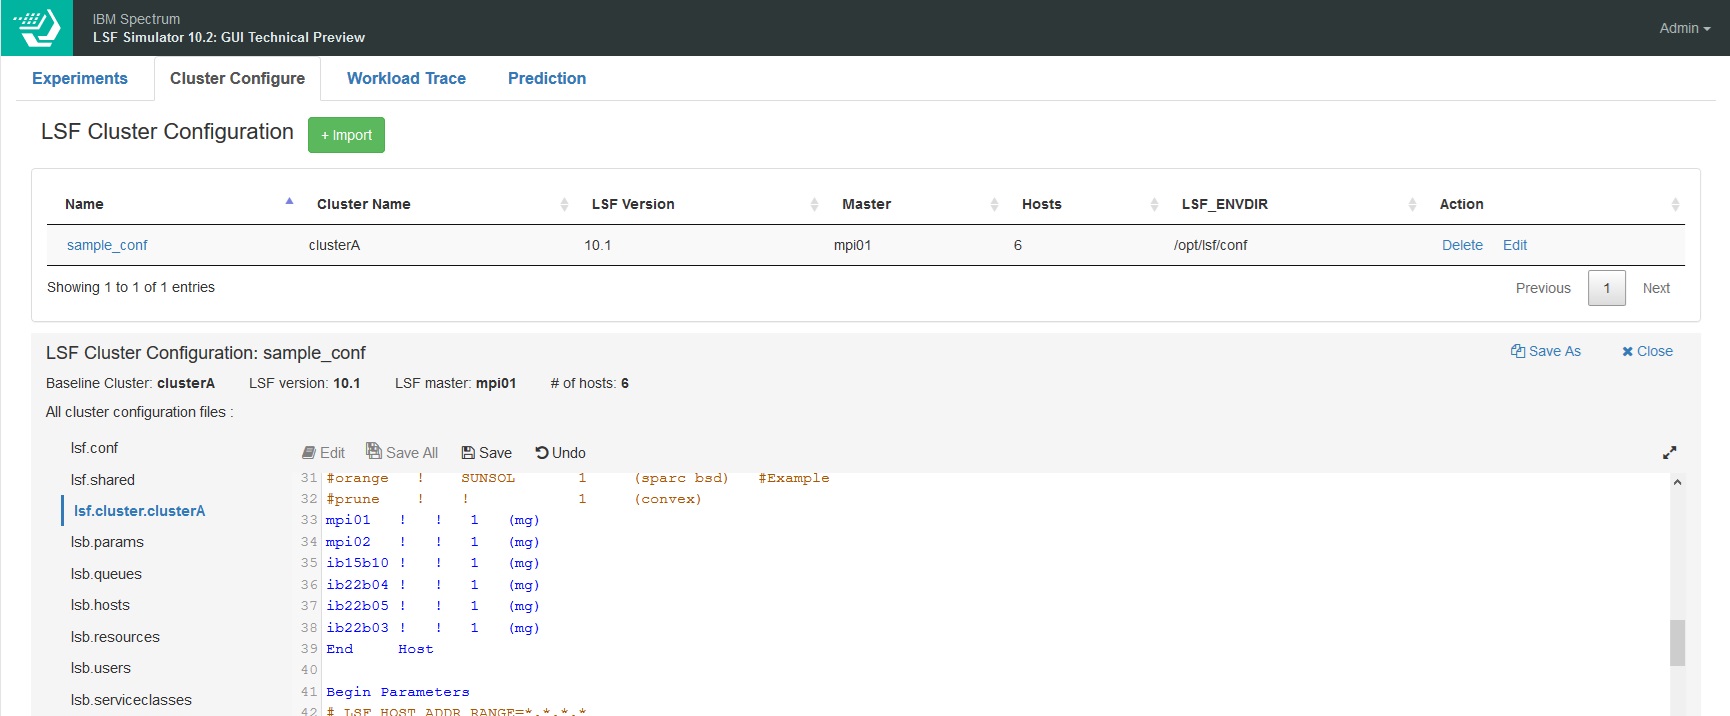
It’s a small cluster of six hosts. You can edit this to change the configuration or import your own configuration from an existing LSF cluster. But for now, let’s leave it as is and run a simulation on this virtual cluster. First we create a new experiment to run and select the cluster configuration to use:
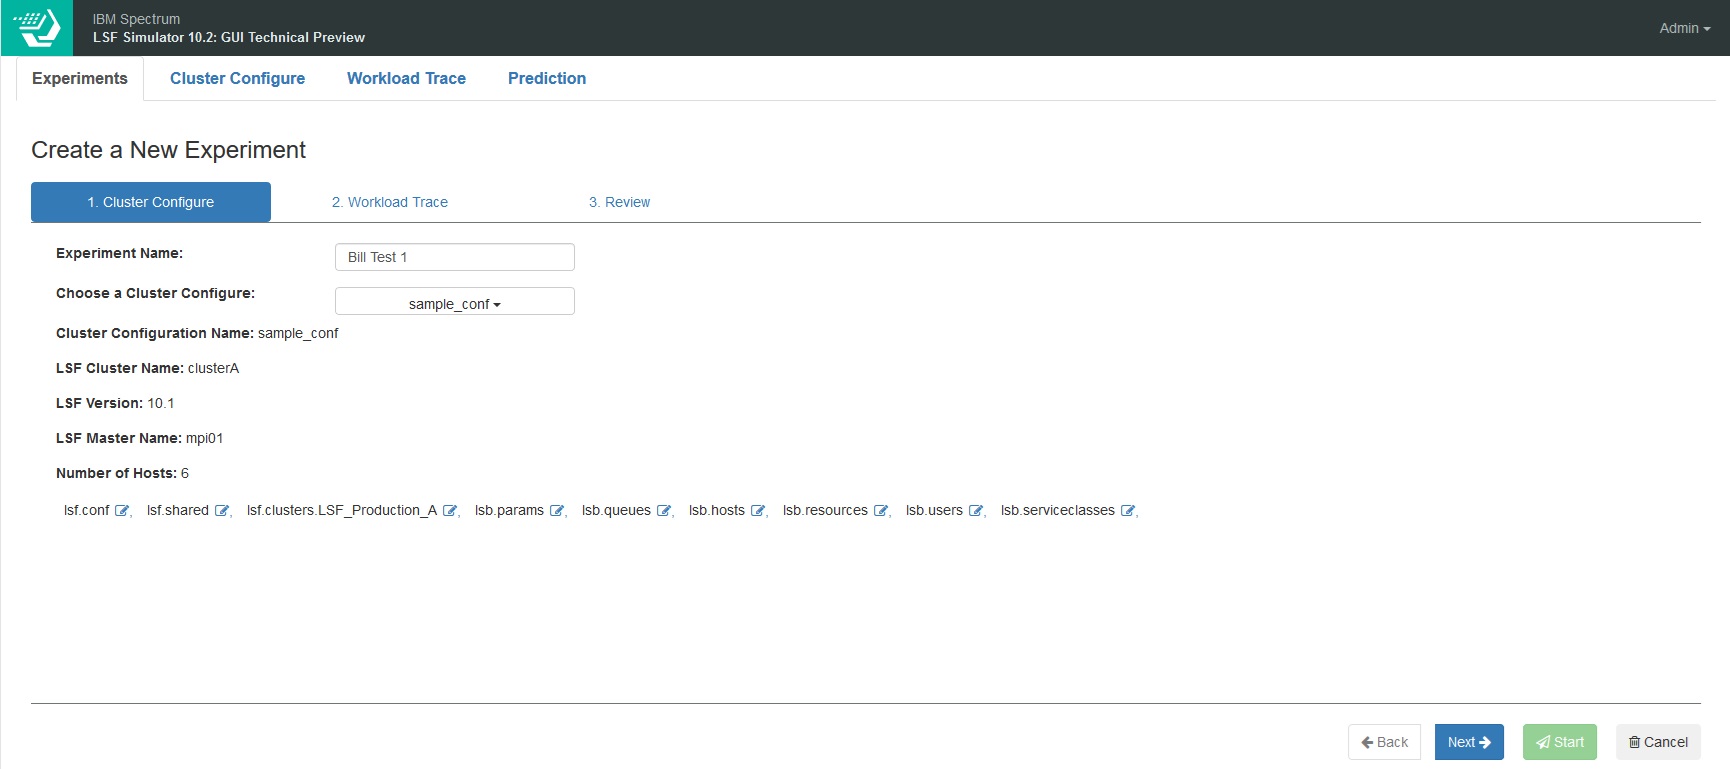
Next we need to select the workload to run through the simulator. The technical preview package includes two sample workloads, so we’ll use one of these which contains just 500 jobs, and will run in 10-15 minutes. Alternatively, you can select an lsb.events file from your existing cluster:
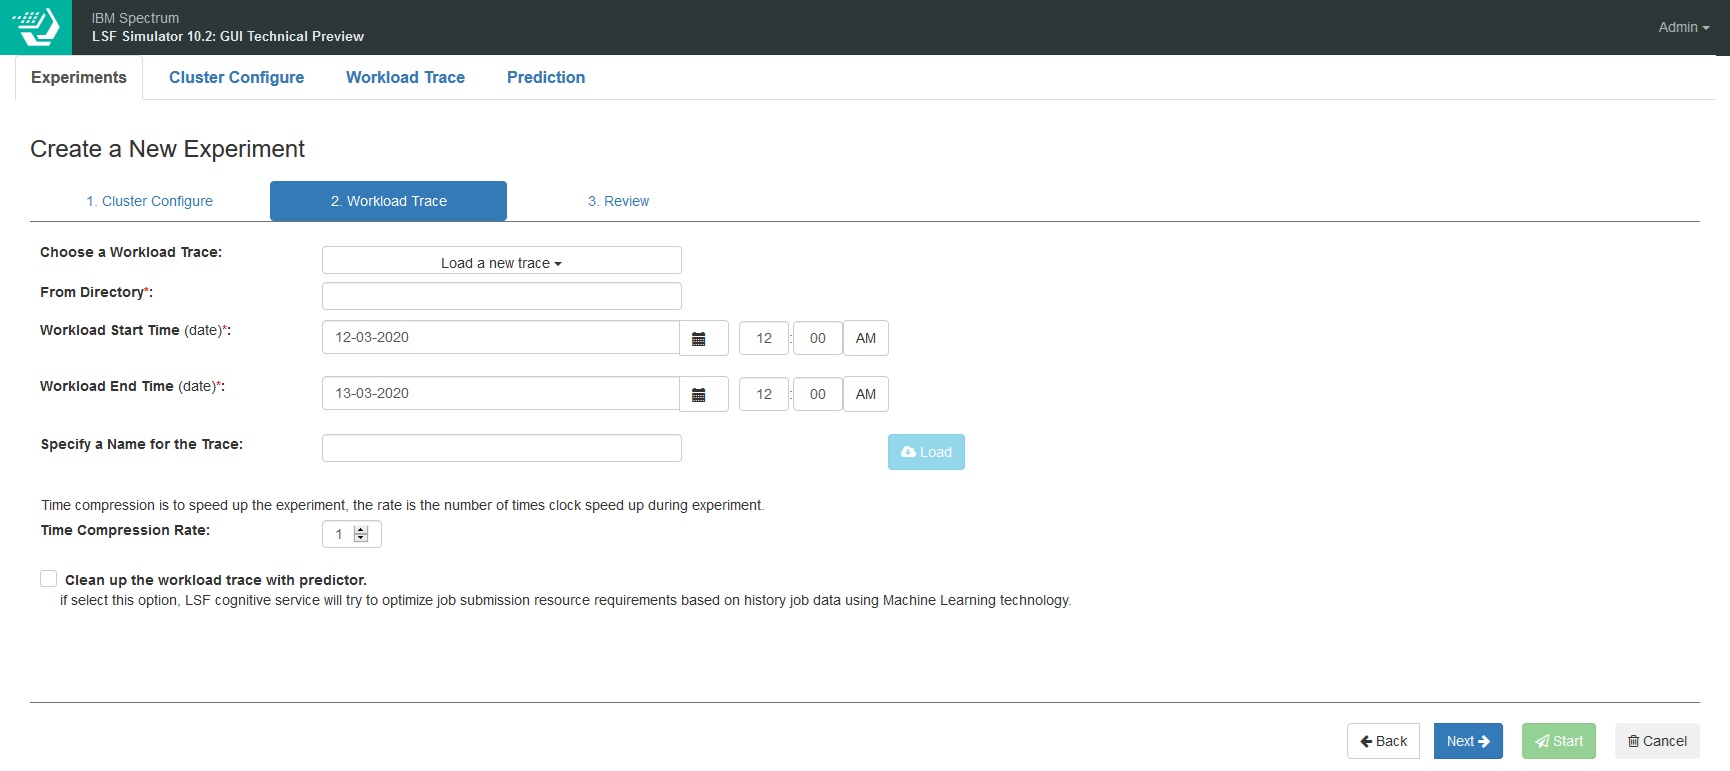
The workload you want to simulate could be quite long – hours, days or weeks of jobs – so we can optionally enable time compression. If your jobs are relatively short then you want to use a low value for this, if they are quite long then you can use a higher value. If you set it too high the simulation will become inaccurate. For now, let’s just leave it as 1 – the sample workload doesn’t take that long to run. In the future we hope to provide some guidance on what sensible values for this are based on the actual workload pattern.
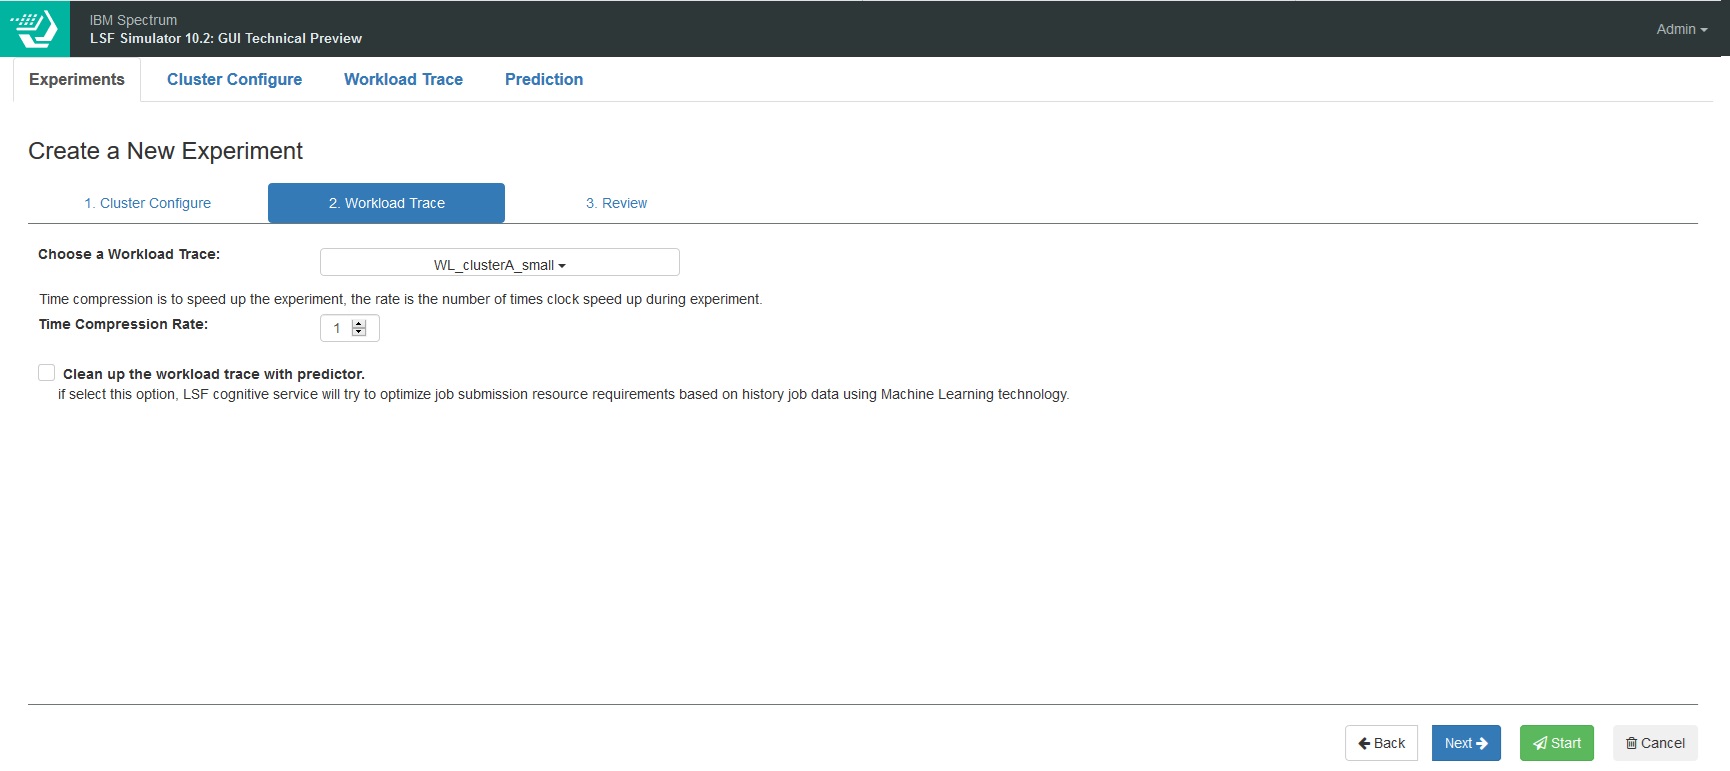
We also have the option of applying a machine learning model against the workload – we’ll leave this unchecked for now, but I’ll come back to that in a future blog.
After we launch the simulation, we can see it in the dashboard:

As I previously mentioned, the simulator is the real scheduler, so I can interact with it as normal. The xterm link opens a session into that particular simulation instance, and I can run the normal LSF commands against the virtual cluster:

While that simulation is running, lets create a second cluster configuration.
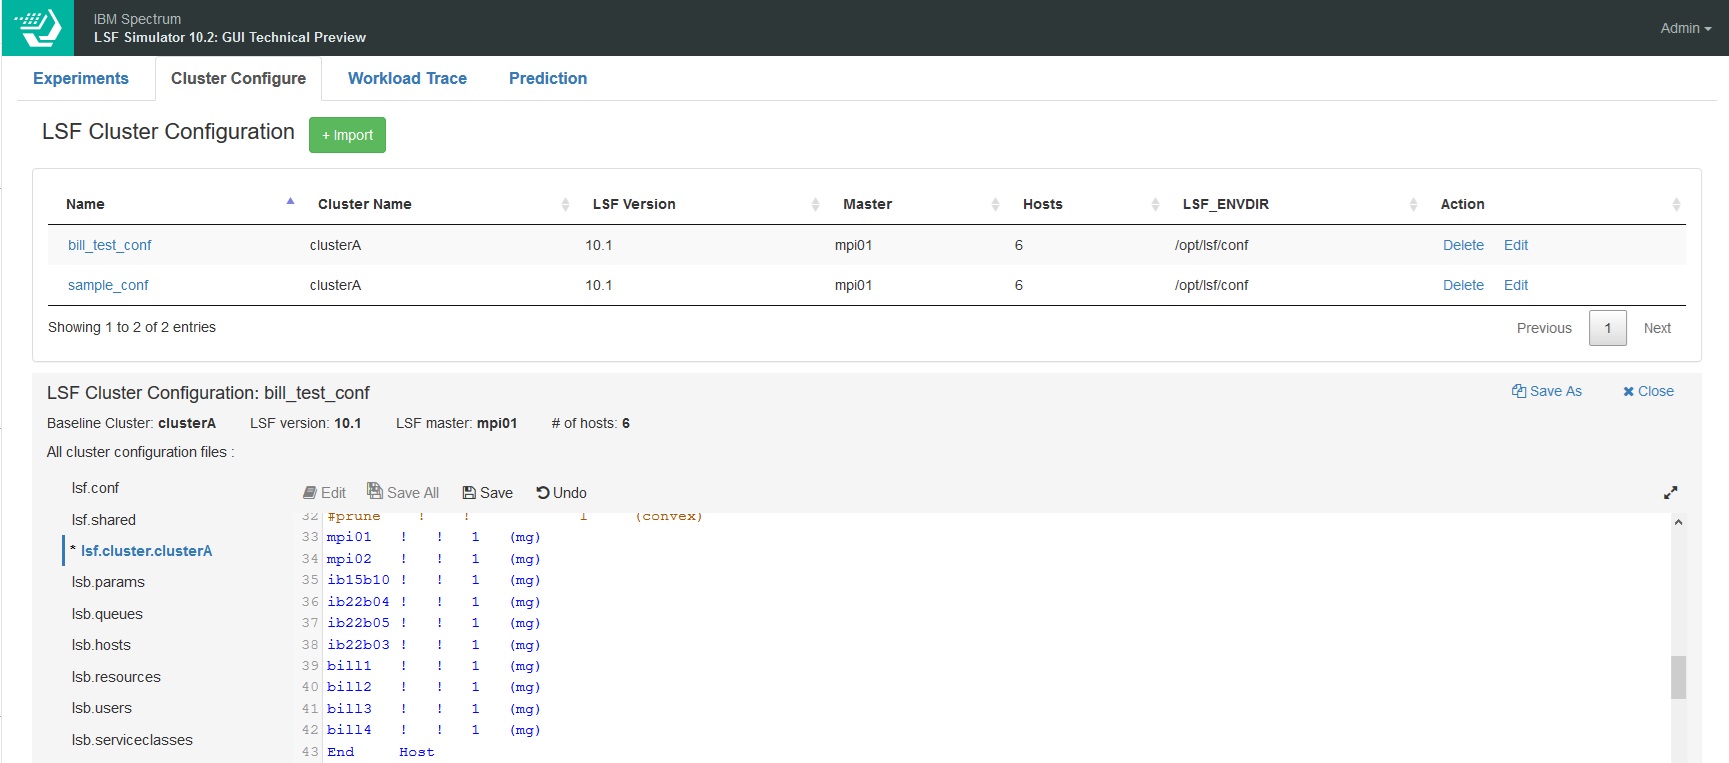
A common question is “what would happen if I added more hosts?” – so let’s simulate that. I’ve saved a copy of the original sample_conf as bill_test_conf, and I’ve edited lsf.cluster to add four new hosts bill1 to 4:
Now in a normal cluster that is all you would need to do – the actual hardware configuration of the new nodes would be automatically detected when the LSF daemons were started on those machines. But since this is a simulation, we have a couple of extra files to edit to define what these new hosts actually are. These two additional files are htrace.out and htrace_a.out – they represent the static and dynamic configuration of the hosts. We can modify these files to simulate the behaviour of adding hosts with higher or lower core counts, more or less memory etc. But for now, we’ll just replicate the content and add the four additional hosts:
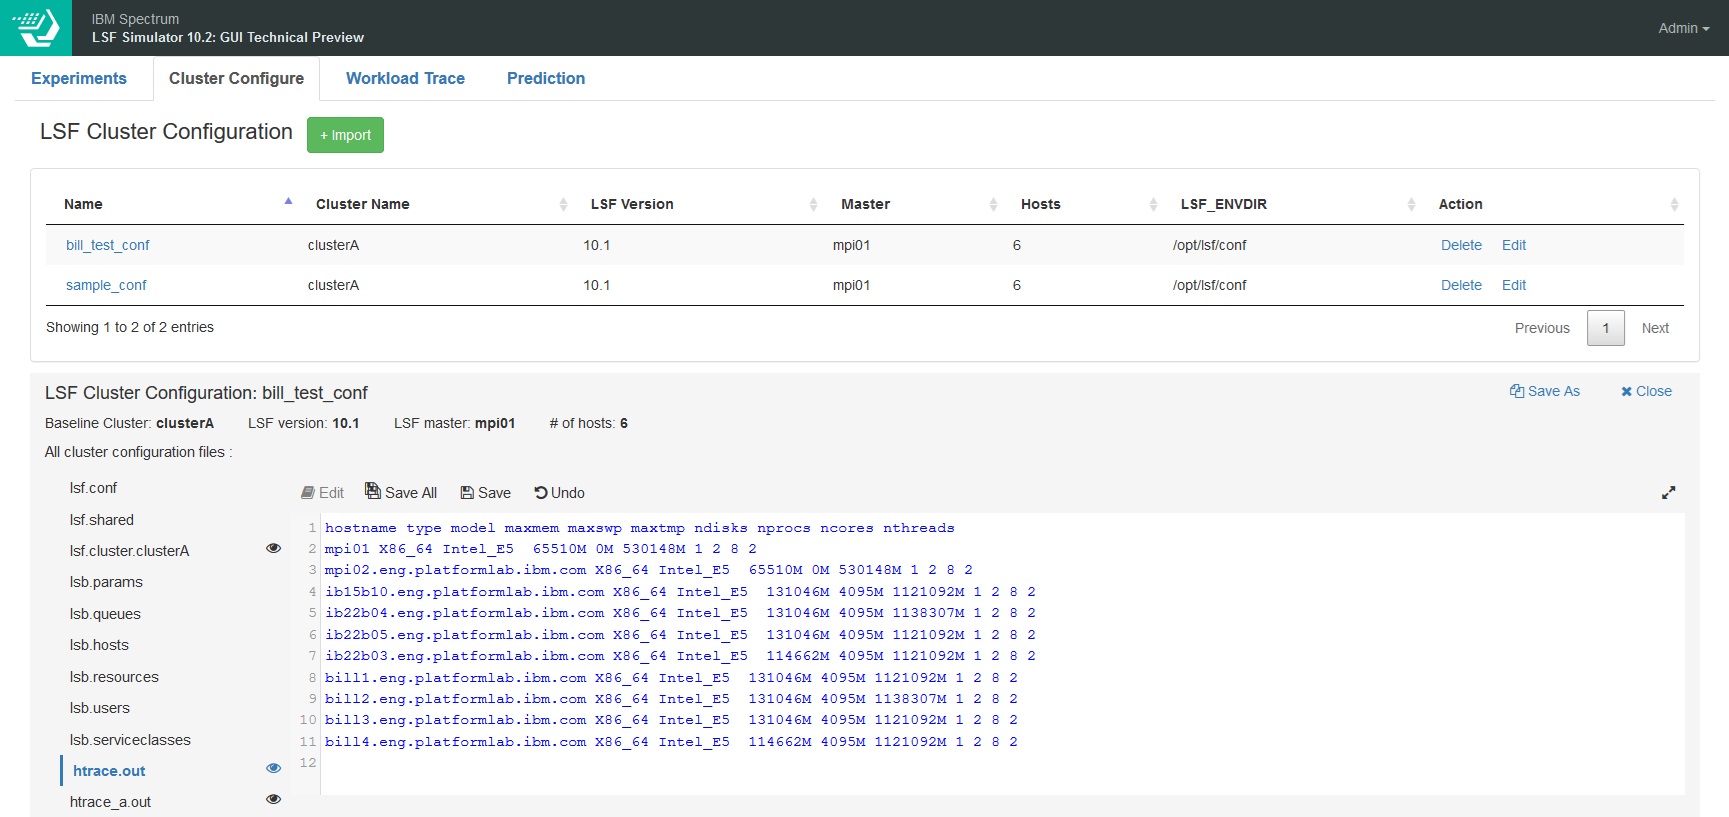
You'll also notice that the modified files have an eye icon next to them to indicate that they have been modified - this will also show you the diffs between the original and modified files - just in case you forgot what you changed.
With that done, we can launch a second experiment with the same workload pattern but the new configuration:

And once it completes, we can open the experiment and compare the results of the two runs:
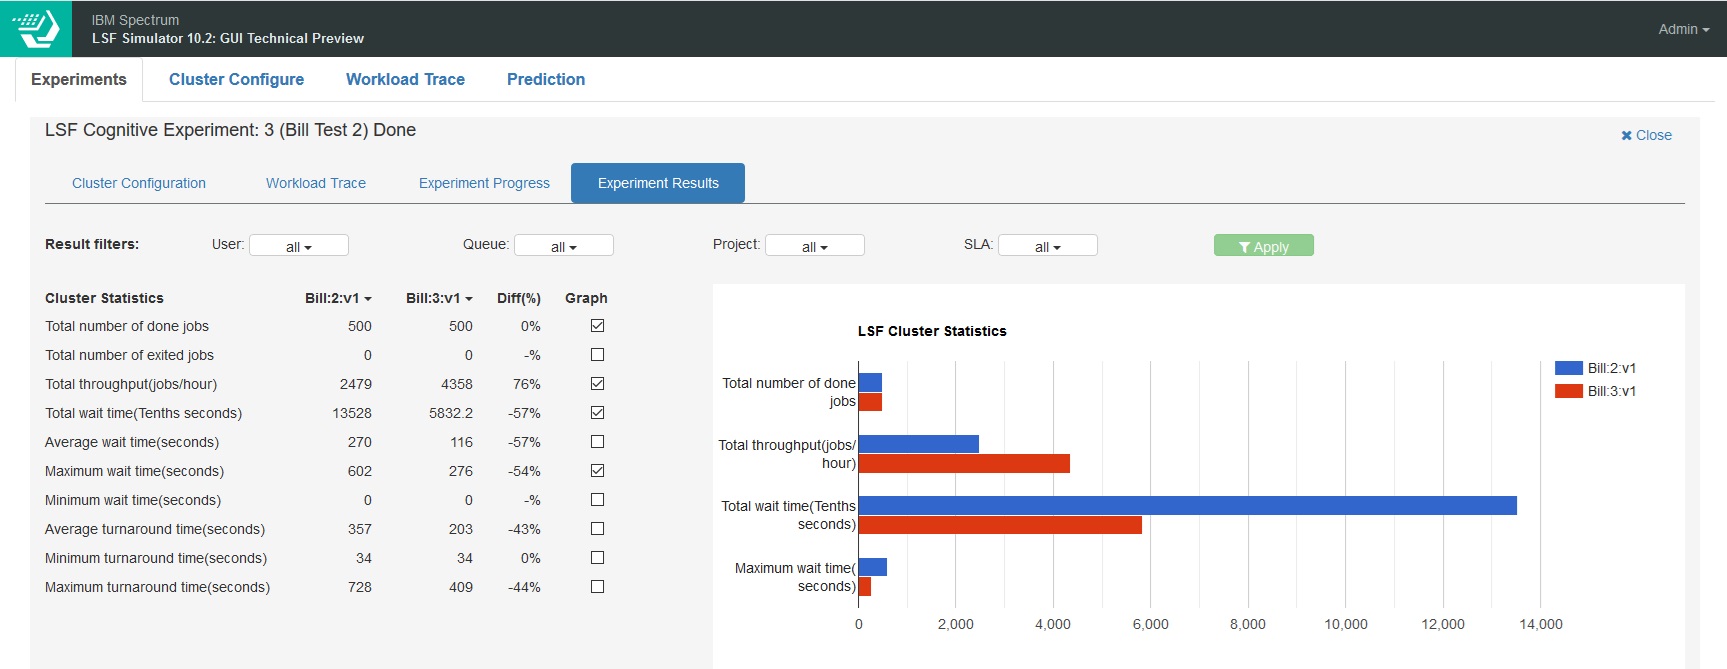
Most importantly, the number of done jobs has remained the same, so changing the configuration hasn’t resulted in any jobs failing – of course we wouldn’t expect jobs to fail with adding new hosts. But if we had changed limits, jobs could now be failing.
We can clearly see that adding 4 additional hosts has increased the throughput 76% and reduced the total wait time by 57%. If that isn’t good enough, we could add more hosts, or hosts with more cores, we can evaluate different configurations.
Today the GUI only exposes a subset of the capabilities of the simulator, but we hope to add more capabilities to the GUI soon.
To Be or Not To Be may be the question, but now you should hopefully be able give a better answer than "it depends".
#LSF#LSFSimulator#SpectrumComputingGroup