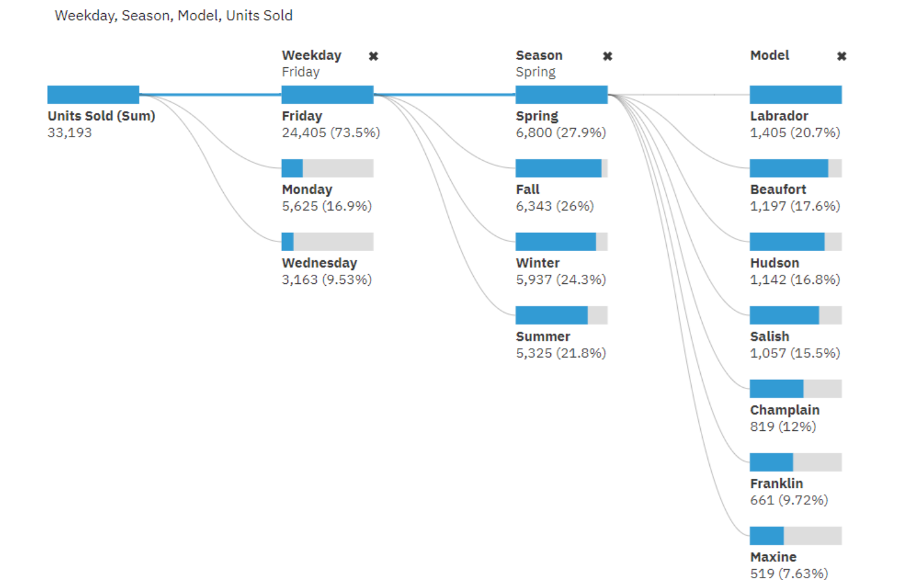
Unlock the power of multidimensional data analysis with the new Custom Visualisation i.e. Decomposition Tree. This intuitive visualization tool enables dynamic exploration across multiple dimensions effortlessly. By automatically aggregating data and offering interactive drill-down capabilities, it facilitates deep dives into complex datasets, fostering a clearer understanding of influential factors.
From dissecting sales trends to identifying root causes behind inventory issues, the Decomposition Tree empowers users to uncover hidden patterns and correlations. Its versatility shines in ad hoc exploration, providing a seamless experience for dissecting diverse data sets. Harness the potential of this tool to transform data into actionable insights, empowering informed decision-making.
Accelerator catalog path - VIZ00029 (ibm.com)
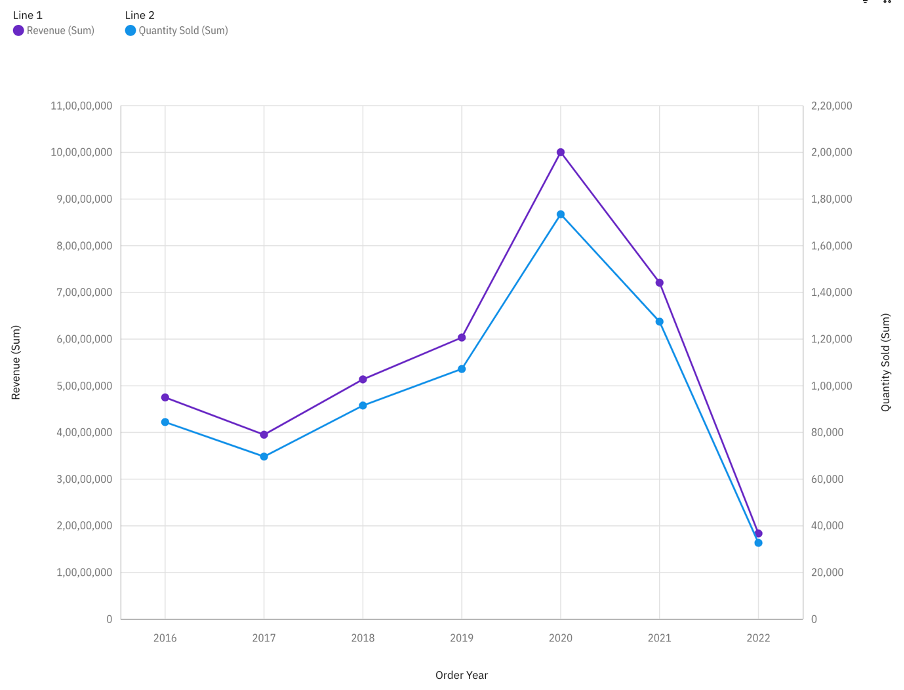
Dual line charts, featuring two y-axes, revolutionize data visualization by seamlessly comparing two essential measures on a shared timeline.
Imagine tracking Global GDP and Country GDP over time in a single, dynamic chart. By breaking free from the constraints of a single y-axis, dual line charts transform data into a visual narrative, offering insights that might otherwise remain hidden. Adding to the versatility, such charts can simultaneously portray sales and revenue trends, offering a comprehensive view of business performance.