Handling Prometheus metrics in Order management SaaS
As discussed in the first part of this series, IBM Sterling Order Management System (OMS) adopts an open standard based on Prometheus to monitor key functional and system metrics across all the wide variety of services running within the suite of applications.
OMS SaaS relies on IBM Instana to collect, process, store and visualize application Prometheus metrics to provide a holistic observability approach combined with other signals. OMS SaaS generates close to 5 million unique Prometheus metrics per hour considering all labels and endpoints. Although Prometheus is an open standard, there are certain considerations to make it scale well with Instana as the observability tool.
Instana for observability
Instana, the IBM Observability solution provides capability to monitor large distributed applications with wide variety of technical stacks. Its ability to automatically trace and smart alerting, help diagnose issues in different components of a system is helpful in taking actions in resolving them promptly. However, for monitoring such large distributed applications serving high volumes of multi tenant traffic, it is important to configure and tune the solution appropriately to achieve the desired outcomes.
Instana architecture for Order Management SaaS
In a Kubernetes environment, Instana relies on a Kubernetes sensor and an Instana agent for capturing metrics for the Kubernetes cluster and application respectively. All the application traces and metrics related to the application flow from the application pods into the Instana agent and from there it is uploaded to the Instana Backend server (see figure 1 for the Instana agent data flow).

The Instana agent runs as a daemon set which means there is one instance of the agent running for each host. All the application pods running on the host will transmit data to the single Instana agent instance. When the cluster has high density such that many application pods are scheduled on a single host and if the application generates large volume of traces or custom metrics then the agent can get overwhelmed which can affect the reliability of monitoring data. Below are some of the ways to help achieve better data ingestion by the Instana agent.
Handling Prometheus metrics at OMS scale
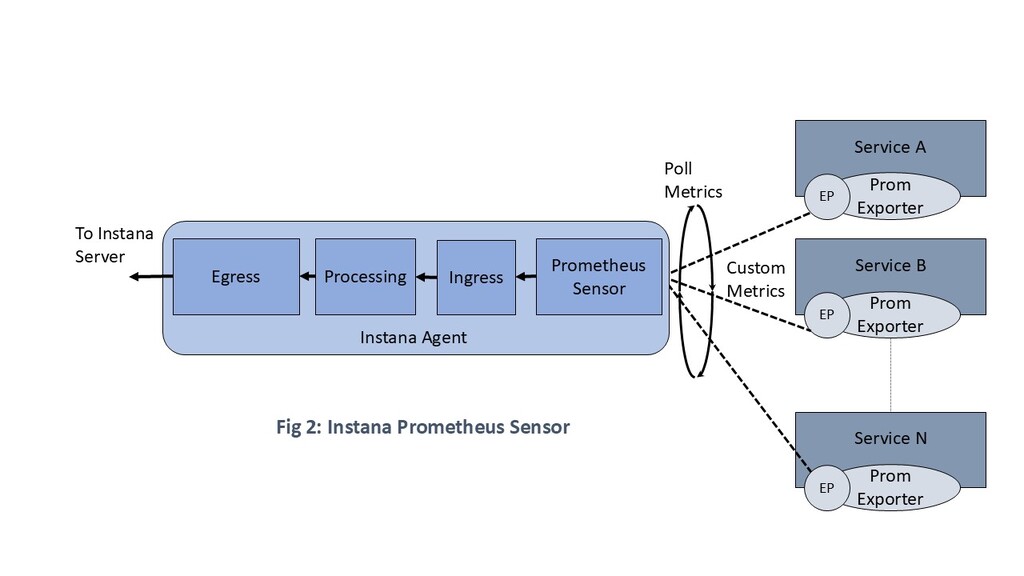
Instana supports a Prometheus sensor which scrapes Prometheus metrics generated by applications. The Instana agent running as a daemon set is responsible for discovering Prometheus application endpoints and scrape them periodically (see figure 2 that depicts the flow of custom metrics from the application).
Following are some of the tuning options adopted in Sterling Order Management for efficient monitoring through Prometheus metrics using Instana:
Discovery of Kubernetes endpoints
Technically each Kubernetes container running an application may host multiple Prometheus endpoints. Thus each Instana agent instance running on a specific host is responsible for discovering all the Kubernetes endpoints exposed by all Kubernetes containers running on the host. Large Kubernetes clusters with high density of containers scheduled on a single host can cause stress on the Instana agent to scan all these containers to discover endpoints which can cause genuine endpoints to be missed and also slow down the overall agent processing.
The following options can make the discovery process more efficient:
Annotating all monitored applications with standard Prometheus annotations
        prometheus.io/scrape: "true"
        prometheus.io/port: "8080"
        prometheus.io/path: "/myapp/prometheus"
Further configure the Instana agent configuration yaml below setting to indicate that it needs to look at only those container specs which define these annotations:
com.instana.plugin.prometheus
  prometheusAnnotations: strict
The above configuration ensures that Instana does not need to scan all the containers for discovering the endpoint, except those application deployments having the Prometheus annotations specified. Note that even if ‘prometheusAnnotations: strict’ is not used, it is generally good practice to add Prometheus annotations in a deployment specification. If annotations are defined, Instana will look at the annotation for port to identify the port to scan for collecting metrics. If port annotation is not defined or it is unreachable then it will look at all the containerPort entries defined in the pod specification.
For a large cluster with many containers, the above optimizations can significantly improve the accuracy of the discovery of these containers thus leading to a more accurate and realtime observability metrics.
Configuring Instana to look within Kubernetes pod with specified labels
Another option, instead on strictly relying on the annotations is to configure Instana to look for the specified HTTP path in only those Kubernetes pods which match the specified labels. The use of labels helps Instana narrow down the list of Kubernetes pods which need to be scanned for a configured HTTP path:
com.instana.plugin.prometheus:
  customMetricSources:
  - url: '/myapp/prometheus'
    labels:
      team: "myapp"
In the above example, Instana will scan for HTTP Path ‘/myapp/prometheus’ only in those Kubernetes pods which have a label with the name ‘team’ defined and the value of the label is ‘myapp’. If multiple labels are used then those are ANDed together to arrive at the list of Kubernetes pods.
Minimizing the relevant metrics to be scraped
If all the Prometheus metrics published by the application are not relevant for monitoring then it is a good practice to limit the metrics which need to be scraped by the Instana Prometheus sensor. This reduces the number of metrics pulled by the Instana agent and also processed by the Backend server.
This can be achieved by configuring the regular expression for each Prometheus endpoint specified in the Instana configuration yaml to reduce the metrics which are scraped and collected by the Prometheus sensor running in the Instana agent.
com.instana.plugin.prometheus:
  customMetricSources:
  - url: '/myapp/prometheus'
    metricNameIncludeRegex: 'client.*'
In the example above, the Prometheus sensor running inside the Instana agent will scrap and collect only relevant metrics as specified in the regular expression. This reducing the metric data processed and forwarded to the backend server. This not only helps in saving network bandwidth but also reduces the volume of metrics pushed to the backend which may impact cost due to higher resources needed on the Instana Backend server.
Optimizing the scrape interval for the metrics
If the metrics are not needed to be accurate to the second, the poll interval at which the Instana agent scrapes the endpoints can be increased to reduce the network traffic and stress on the agent. The value of poll interval (in seconds) can be set using attribute ‘poll_rate’ as shown below in the Instana configuration yaml:
com.instana.plugin.prometheus:
  poll_rate: 60
Disabling Prometheus data collection through java sensor
If Prometheus metrics are published by the application using some of the standard java libraries like the one given by Prometheus or Micrometer, these Instana java sensor automatically picks these Prometheus metrics and sends them over as part of the JVM java trace metrics. This creates an additional overhead on the Instana agent, network, application pod as well as to the cost due to higher load on the Instana Backend, because the same metric is captured as part of HTTP scraping through Prometheus infrastructure metric sensor as well as through the java sensor.
These can be disabled under java sensor configuration in Instana configuration yaml as below
   com.instana.plugin.java:
     prometheusMetricCollection:
       enabled: false
Judicious use of metric tag/labels for Prometheus metrics
This is a general good practice, to keep the the number of labels as well as their unique values under control. Unnecessary metric labels should be avoided and the value of each of those labels should have low cardinality i.e. few unique values.
Various dimensions listed below, together form the total number of metric entries collected by the Instana agent and uploaded to the Instana Backend server. Each of the below entries forms a time-series on the Instana Backend server :
Each of the below factors act as a multiple to generate total metrics stored in Instana Backend. As an example, using a randomly generated application identifier as a label is not correct because there would be vast number of unique values for such a label causing the number of custom Prometheus metrics to explode.
If the metric entries grow too big in number, it can cause agent to malfunction and can result in dropping of the metrics. For instance, some of the common infrastructure metrics like Kubernetes cluster, Pod, Zone etc are already captured by the Instana through the Kubernetes infrastructure monitoring and it can automatically correlate the custom metrics generated by application to these Kubernetes metrics hence it may not be necessary to add these as labels for the custom Prometheus metrics in the application.
For such use cases, where highly cardinal data needs to be recorded, then such information can be logged in log files, alternatively such information can be visualized in application traces provided by Instana.
Conclusion
In this article, we have covered various tuning options and some of the best practices that were employed in Sterling Order Management to observe Prometheus custom metrics for applications with IBM Instana. Specifically, optimizing metrics end point discovery, minimizing the number of monitored metrics and properly defining metric labels and tags. In our next blog post, we plan to cover tuning options and best practices for tracing large scale Java applications like Order Management with Instana.
Co-Author: Sreedhar Kodali, Senior Technical Staff Member, Instana Engineering
References