Hello TM1 community,
In this blog post I would like to show and share a TI process for logging process activity. While you can get some information from inspecting the TM1 server message log, it is useful to keep the last X runs of a (important) TI processes in a cube. Runs will move down in the cube and when the limit of X runs is reached, the oldest run is removed.
We store the information on a number of measures. You could make changes to it or add your own preferred measures.
The process is uploaded to the library of files of IBM PA:
https://community.ibm.com/community/user/viewdocument/logging-process-runs-in-dedicated-c?CommunityKey=8fde0600-e22b-4178-acf5-bf4eda43146b&tab=librarydocuments
The process allows you to:
· Set up up to 4 cubes. Set the parameter pMode = 2 and use pByClient = N and/or Y and/or D and/or S. The value A does All. The main cubes are create with N and Y.
· Delete up to 4 cubes. Set the parameter pMode = 3 and use pByClient as above.
· Log the run of 1 process. Set pMode = 1 (the default value) and supply the other parameter values too. Defaults lead to empty cells or 0.
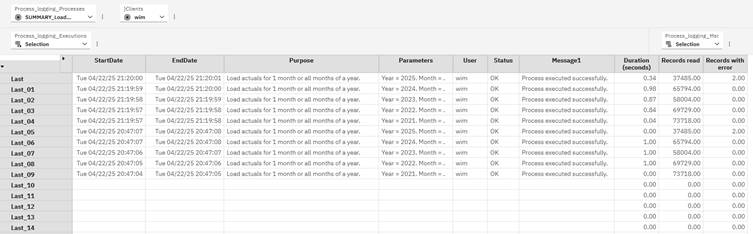
For process names and executions we use elements 'Process_xx' (with an alias) and 'Last_xx', respectively. Elements can be created automatically by increasing the MAX constant values in the process.
The result is as follows:

You would call the process, for mode 1, as such. In the Prolog tab, near the top, put:
#--------------------------------------------------------------------------
# Logging
#--------------------------------------------------------------------------
vStart = Now;
# or:
vStart = MilliTime;
vParams = Expand( 'Year:%pYear%. Period:%pPeriod%. Scenario:%pScenario%.' );
vPurpose = 'Load actuals sales data from SQL';
vStatus = 'OK';
vMessage1 = 'Process executed successfully.';
vMessage2 = '';
vMessage3 = '';
nRecords_Read = 0;
nRecords_With_Error = 0;
# End of logging ----------------------------------------------------------
Then update some of the variables in the rest of the process.
Lastly, near the bottom of the process, put:
#--------------------------------------------------------------------------
# Logging
#--------------------------------------------------------------------------
ExecuteProcess( 'TECH_process logging', 'pProcess', GetProcessName, 'pByClient', 'NY'
, 'pPurpose', vPurpose, 'pParams', vParams, 'pStartTime', vStart, 'pStatus', vStatus, 'pMessage1', vMessage1
, 'Records_Loaded', nRecords_Read, 'Records_With_Error', nRecords_With_Error );
# End of logging ----------------------------------------------------------
Obviously, you can make changes as you see fit.
When using pByClient = 'NY' the technical process will log the process execution run in both the cube by }Clients dimension (Y) as the cube not by }Clients dimension (N). pByClient = D and S are allowed to set up/delete the cubes, but these 2 cubes are not updated through the main mode of the process, pMode = 1. Rather, you would include CellPutN/CellPutS/CellIncrementN where you need it.
Duration in seconds is calculated at:
· Either the second level, when you use the Now() function
· Either at the millisecond level, when you use the MilliTime() function
You can see the difference between both accuracy levels in the screenshots above, last column. For quick reference, the duration of the process in number of minutes and number of hours can be shown. I use consolidations of the number of seconds with weights 1/60 and 1/3600, respectively.
You could set up security (READ access) if you want. I did not include it in the generic process. Also, you could add code to create default subsets and views in the dimensions, I leave it up to you. Likewise, formatting the columns for the number of records. I included examples of how to format the dates and durations, for your reference.
You could do more elaborate logging too, like writing to SQL tables. Or use a time dimension with newly inserted elements to capture the time of running the processes. However, I do think that might be overkill, certainly metadata changes. Moreover, when times are stored in a cube, with MDX views we have (more than in the past) the tools to query process runs in a certain time interval.
This process is probably a TI that any TM1 model can use. Please let me know when you have questions, improvements, changes, etc.
The process is uploaded to the library of files of IBM PA:
https://community.ibm.com/community/user/viewdocument/logging-process-runs-in-dedicated-c?CommunityKey=8fde0600-e22b-4178-acf5-bf4eda43146b&tab=librarydocuments