Your Go-To Tool for Debugging Java Applications: - Xtrace
If you’ve ever been stuck trying to diagnose issues in your Java application, you know how time-consuming and frustrating it can be. IBM Semeru Runtimes, a drop-in replacement for any JDK, offers a unique and handy command-line tool called -Xtrace to make debugging and performance tuning easier. By tracing method calls with minimal performance overhead, -Xtrace helps you pinpoint problems faster and more efficiently.
In this blog, we’ll show you how to use -Xtrace directly in the Eclipse IDE to streamline your debugging process. You can setup IBM Semuru Runtime on Eclipse using “Using Semeru in Eclipse IDE” section in this article. Whether you're working in production or development, this tool can make troubleshooting simpler and more effective.
What is -Xtrace?
The -Xtrace feature in IBM Semeru Runtimes is a powerful tracing tool built into the OpenJ9 JVM that’s uniquely available with IBM Semeru Runtimes. This feature is designed to provide insights into Java applications with minimal performance impact. It’s ideal for troubleshooting and root-cause analysis.
Key Features:
- Trace Method Calls: Track when specific methods are called, including entry and exit points.
- Monitor Specific Methods: Filter by class or method name (wildcards are supported).
- Fine-Grained Control: Configure trace points by component, method, or identifier. You can also adjust trace verbosity for more detailed or concise logs.
- Dynamic Configuration: Control tracing via command-line arguments or properties files.
- Minimal Overhead: Designed to be lightweight, making it suitable for performance-sensitive environments like production.
A Simple Example in Eclipse
Let's say you're working with an application where Class A calls methods across different classes—B’s methodB, C’s methodC, and finally, D’s methodD. If you need to figure out why D.methodD is being triggered, -Xtrace is perfect for this job.
You might ask why not a debugger? It is possible that no debug setup is available or the method is called too frequently or you need to get debug information from your customer and have no access to debugging.
So, this is our scenario:
- A calls B.methodB
- B.methodB calls C.methodC
- C.methodC calls D.methodD (which is our method of interest)
We want to trace D.methodD but don’t need to step through every call in the chain. Here’s how to set up the trace:
- Basic Syntax of -Xtrace:
Xtrace:iprint=mt,methods=<package>/<class>.<method>,trigger=method{<package>/<class>.<method>,jstacktrace}
- For Our Scenario:
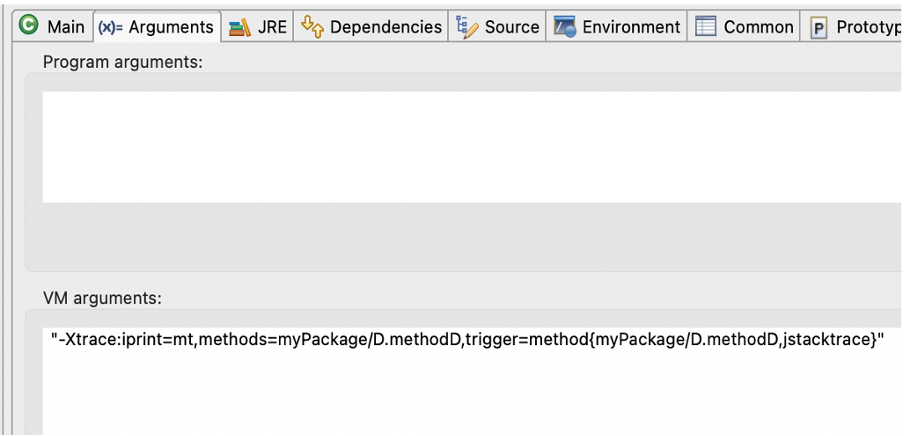
Xtrace:iprint=mt,methods=myPackage/D.methodD,trigger=method{myPackage/D.methodD,jstacktrace}
3. Setting it Up in Eclipse:
· Go to Run/Debug Configurations in Eclipse.
· Add the below syntax in the VM Arguments field.

Execution:
Once the program runs, you’ll see trace information for D.methodD in the Console view. It will include when the method is called, along with the call stack, helping you pinpoint where things are going wrong.
This shows how D’s methodD is called when application is run.
Each line starts with a timestamp showing when the event occurred, followed by a thread ID. To the right, you see the method being called, including class name, method name, and line number. If the code setup is done, clicking the link at the right (for eg A.java:12 ) will take you to the code in Eclipse IDE. Stack trace lines show the call hierarchy from main to the current method. This output helps you trace execution flow, timing, and debug issues in your Java program.
Advanced Configuration with the Xtrace Option Builder
While the above example is simple, the -Xtrace tool offers many advanced options. Use the Xtrace Option Builder web tool to craft more complex tracing configurations without worrying about syntax errors.
Why Use It:
- The Option Builder helps you quickly create complex trace configurations.
- It reduces manual errors and ensures proper setup, especially for advanced use cases.
Conclusion and Next Steps
Summary:
By mastering -Xtrace in IBM Semeru Runtime, you can diagnose performance issues and troubleshoot Java applications with minimal overhead. Whether you’re working in a development or production environment, this tool is an essential part of your debugging toolkit.
Next Steps:
References:
· Introducing the no-cost IBM Semeru Runtimes to develop and run Java applications
https://developer.ibm.com/blogs/introducing-the-ibm-semeru-runtimes/
· Download IBM Semeru Runtimes
https://developer.ibm.com/languages/semeru-runtimes/
· Set up IBM Semuru on Eclipse
https://community.ibm.com/community/user/blogs/noopur-gupta/2025/04/28/meet-ibm-semeru
· Xtrace options
https://eclipse.dev/openj9/docs/xtrace/
· Xtrace Option Builder
https://eclipse.dev/openj9/tools/xtrace_option_builder.html