In the last post, I talked about the Java locking contention as being one possible cause of scalability issues. In this post, I will continue the lock contention topic.
So, you spotted a lock contention in thread dumps as mentioned in the previous post and as shown below:
3XMTHREADINFO "thread-1" J9VMThread:0x0000000030ABCD00, omrthread_t:0x000001002732A228, java/lang/Thread:0x000000008025FCA8, state:B, prio=5
3XMCPUTIME CPU usage total: 0.904382000 secs, user: 0.627142000 secs, system: 0.277240000 secs, current category="Application"
3XMTHREADBLOCK Blocked on: lock Owned by: "thread-2" (J9VMThread:0x0000000030B76800, java/lang/Thread:0x000000008027DBF8)
Listing 1: Thread dump snippet
Does that mean that the clock contention is the cause of the scalability issues? Below are additional pieces of information that can be gathered to answer this question:
- How much work is being achieved by a thread while holding a lock that is requested by other threads? The more work being achieved, the worse is the lock contention, hence the worse is the scalability. One way to find this is to look at how much code is being executed while the lock is being held. The thread dump shows the call stack while the lock is being held. Continuing with the example shown in Listing 1, if you locate the thread-2 call stack, you will see the following printed somewhere in the call stack of thread-2:
(entered lock: lock, entry count: n)
Listing 2: Thread dump snippet
The lock name has the following pattern: fully-qualified-classname@hexadecimal-number, where hexadecimal-number is a memory address. Ensure that the lock in Listing 2 is the same one mentioned in Listing 1.
- Are there many threads waiting on that lock? Does each thread have to do the same amount of work? Does each thread have to do a lot of work? The more threads are waiting on the lock, the worse is the scalability. If you try to scale the application by adding more of these threads, you will find that the application may do less, the same amount of, or a little more work compared with the work done with less threads. This is because the contention will be worse with more threads as they all have to contend for the same lock.
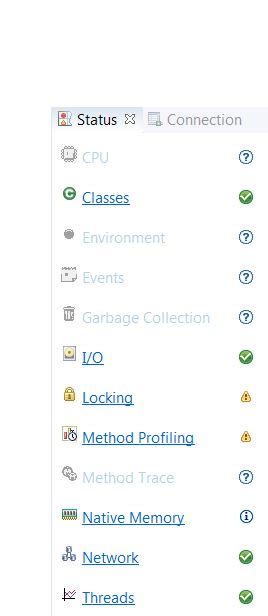
- Use IBM Health Center. IBM provides the Health Center tool that provides a lot of helpful diagnostic data, including lock contention as shown in Figure 1.
 Figure 1: Health Center Perspectives
This post is not about Health Center. However, a brief introduction is helpful here. Health Center consists of two parts: an agent that collects performance data from a running Java application, and an eclipse-based client that parses the performance data and puts it in a format that is more consumable. The agent may collect performance data real-time and send to the client that will provide online performance analysis, or the agent may collect data in a file to be imported into the client for offline performance analysis. The client provides a number of performance analysis perspectives. But, the one that is useful here is the Locking perspective. Once you have the Locking perspective open, go to the Monitors view, sort the
%util column and locate the lock spotted in the thread dump, in the
Name column as shown in Figure 2. Then, look at the corresponding
%miss,
%util, and
Average Hold Time values. The larger the
%miss,
%util, and
Average Hold Time values are, the worse is the lock contention. Note that if you want to use Health Center to assess the lock contention, you should collect thread dumps while collecting performance data with Health Center. Otherwise, the lock name shown in the Health Center client may look ambiguous and you may not know what code is using this lock. For example, the lock shown in the first row looks ambiguous.
 Figure 2: Health Center Locks View