query_completed_event_view is one of the richest views in watsonx.data QHMM. It provides variety of useful data for each query, like cpu time, memory, the amount of data processed, execution plan, based on JSON-formatted query event related data. Since watsonx.data official documentation has little explanation, I am going to explain query_completed_event_view based on my experience.
About QHMM, refer official document IBM watsonx.data 2.2.x QHMM. And also see my blog watsonx.data QHMM(Query History Monitoring and Management).
query_completed_event_view - Overview
QHMM tables and views are located in catalog wxd_system_data and schema named wxd_system_data_diag_prestXXXX. 8 tables and views are created for each schema.
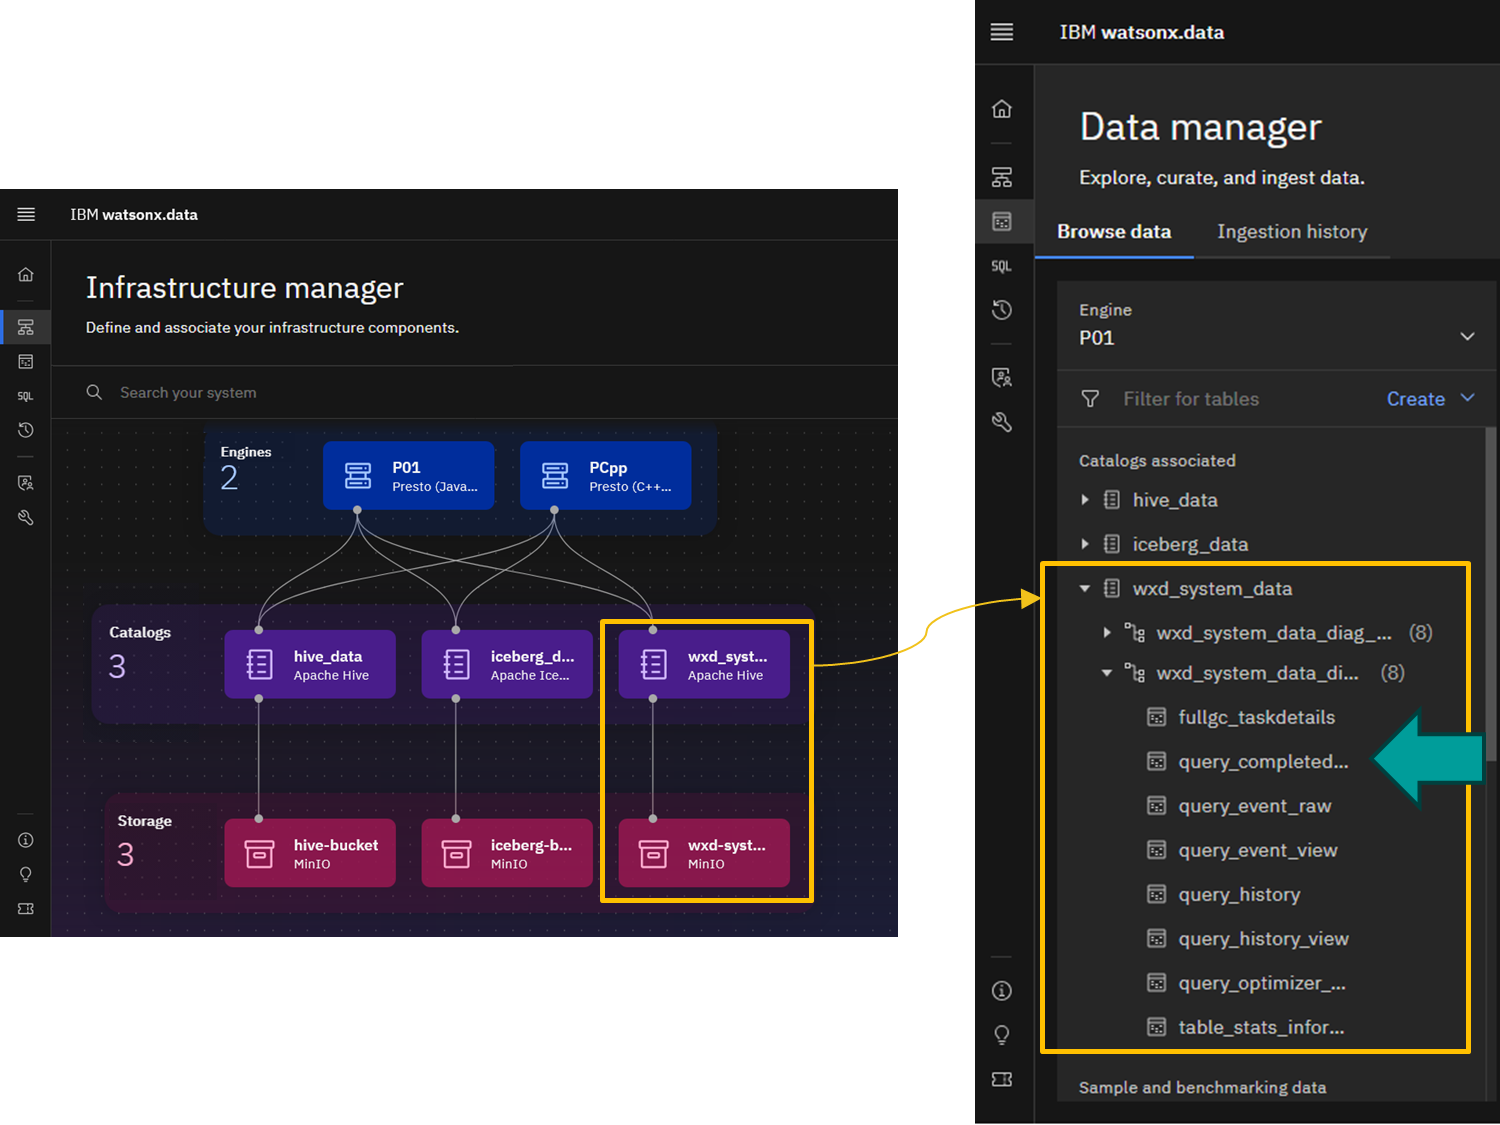
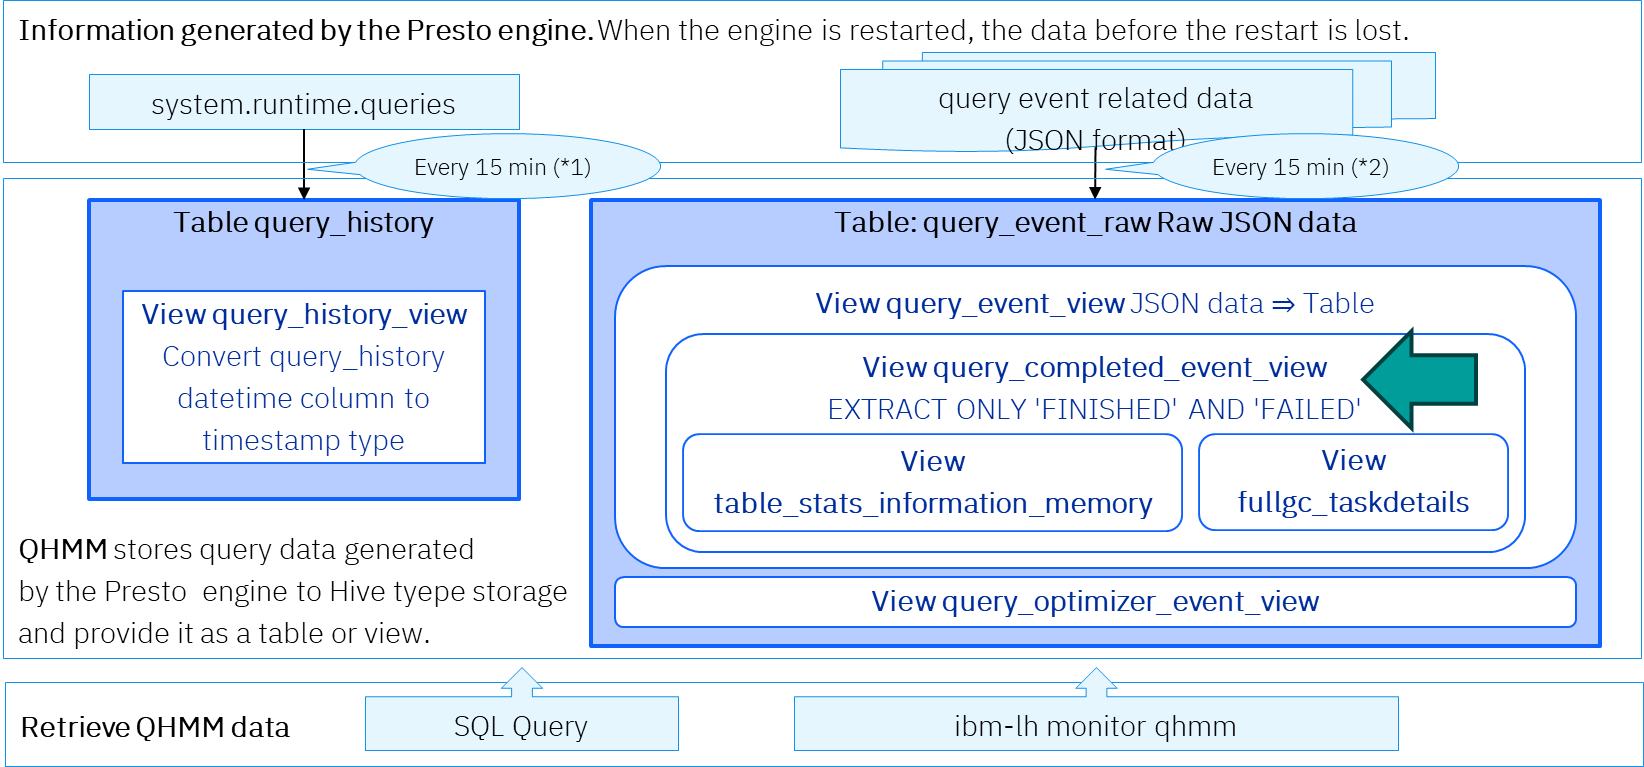
Next diagram illustrates the relationship between source data and QHMM tables and views.
You find the source data of query_completed_event_view is query event related data (JSON format) which we see rich data in QUERY DETAILS of Presto Console. (See also my blog Presto Console - QUERY DETAILS.)
Now I introduce QHMM query_completed_event_view
- the table structure
- example data contained in it
query_completed_event_view - Column definitions
The structure of query_completed_event_view is as follows.
Description is added based on my observation results.
On watsonx.data 2.1.3 , query_completed_event_view has 40 columns. I will show you them in 2 tables.
You will see
query_id which was assigned when a Query is createdcputimemillis shows CPU usage- columns named with rows and bytes will shows the amount of data processed in a query
| Column |
Type |
Description |
| cluster_name |
varchar |
presto (observed values are presto only) |
| query_id |
varchar |
Query id |
| query_state |
varchar |
Query status (e.g., FINISHED/NULL/FAILED) |
| query_inputs |
json |
List of objects to use for Query |
| create_time |
timestamp |
Query creation time (example): 2025-05-08 01:34:10.708 |
| execution_start_time |
timestamp |
Query start time (example): 2025-05-08 01:34:10.730 |
| end_time |
timestamp |
Query completion time (example): 2025-05-08 01:34:11.168 |
| cputimemillis |
bigint |
CPU usage time (ms) |
| walltimemillis |
bigint |
duration (ms) |
| queuedtimemillis |
bigint |
Time in Queue (ms) |
| analysistimemillis |
bigint |
analysis time (ms) |
| planningtimemillis |
bigint |
planning time (ms) |
| user |
varchar |
User (example) cpadmin , user02 |
| gcstatistics |
array(row("gcstatistics" map(varchar, integer))) |
garbage collection statistics (?) |
| total_rows |
bigint |
Total number of rows (number of rows used to execute query?) |
| output_rows |
bigint |
Number of output rows |
| written_output_rows |
bigint |
Number of Rows Written |
| total_bytes |
bigint |
Total bytes (number of bytes used to execute query?) |
| output_bytes |
bigint |
Output Bytes |
| cumulative_memory |
double |
Total memory (may be in byte exponential notation) |
| completed_splits |
bigint |
Number of completed splits |
go to 2nd table
- columns memory in the name : various memory usage
catalog and schema : Implicitly used catalog name Schema namesession_properties : Session Properties- detailed information about the error
plan : plan equivalent to the result of "EXPLAIN ANALYZE".query : full text of query
| Column |
Type |
Description |
| peak_running_tasks |
bigint |
Maximum number of parallel tasks |
| peak_user_memory_bytes |
bigint |
peak user memory (bytes) |
| peak_total_non_revocable_memory_bytes |
bigint |
peak_total_non_revocable_memory_bytes |
| peak_task_user_memory |
bigint |
peak_task_user_memory |
| peak_task_total_memory |
bigint |
peak_task_total_memory |
| peak_node_total_memory |
bigint |
peak_node_total_memory |
| source |
varchar |
Application with Query issued (e.g., presto-cli) |
| catalog |
varchar |
Catalog name implicitly used in Query Specified in USE statements, etc. |
| schema |
varchar |
Schema name implicitly used in Query Specified in USE statements, etc. |
| resource_group_id |
array(varchar) |
resource group ID (example) [global] |
| session_properties |
map(varchar, varchar) |
session property (example) {enable_wxd_query_optimizer=true} |
| server_version |
varchar |
Presto version (example) 0.286 |
| error_code |
map(varchar, varchar) |
(example) {retriable=false, code=1, name=SYNTAX_ERROR,type=USER_ERROR} |
| failure_type |
varchar |
(e.g., com.facebook.presto.spi.PrestoException) |
| failure_message |
varchar |
Error Messages |
| failure_json |
varchar |
More information about errors in the JSON format. stack. |
| plan |
varchar |
Plan. It is equivalent to result of EXPLAIN ANALYZE. |
| query |
varchar |
Query (SQL statement) |
| isajoinquery |
boolean |
true if query includes join, else false. |
query_completed_event_view - Example data
I want to show the values retrieved from query_completed_event_view on my watsonx.data Presto.
Here I retrieved Presto(C++) engine data.
(1) use wxd_system_data.wxd_system_data_diag_prestissimo873; set catalog wxd_system_data and schema wxd_system_data_diag_prestissimo873 implicitly .
Column cluster_name has value presto only.
presto:> use wxd_system_data.wxd_system_data_diag_prestissimo873;
USE
presto:wxd_system_data_diag_prestissimo873> select distinct cluster_name from query_completed_event_view;
 cluster_name
--------------
 presto
(1 row)
presto:wxd_system_data_diag_prestissimo873>
(2) query_state has FINISHED or FAILED, since query_completed_event_view is defined to extract the records WHERE (query_state IN ('FINISHED', 'FAILED')).
presto:wxd_system_data_diag_prestissimo873> select distinct query_state from query_completed_event_view;
 query_state
-------------
 FINISHED
 FAILED
(2 rows)
presto:wxd_system_data_diag_prestissimo873>
(3) Next shows query_id, query_inputs.
query_id was assigned when a Query is created.query_inputs seems to have list of objects to use for Query.
presto:wxd_system_data_diag_prestissimo873> select query_id, query_inputs from query_completed_event_view;
          query_id           |                                                                                                                                         >
-----------------------------+----------------------------------------------------------------------------------------------------------------------------------------->
 20250510_031013_00012_3jpjf | [{"catalogName":"$system@system","schema":"runtime","table":"queries","columns":[{"name":"query_id","type":"varchar"},{"name":"user","ty>
 20250512_015800_00051_3jpjf | [{"catalogName":"hive_data","schema":"hsf1_no_part","table":"lineitem","columns":[{"name":"l_discount","type":"double"},{"name":"l_exten>
 20250512_015809_00052_3jpjf | []
 20250512_033531_00343_3jpjf | [{"catalogName":"$info_schema@hive_data","schema":"information_schema","table":"tables","columns":[{"name":"table_schema","type":"varcha>
 20250512_042120_00467_3jpjf | [{"catalogName":"iceberg_data","schema":"sf1_no_part","table":"lineitem","columns":[{"name":"l_discount","type":"double"},{"name":"l_lin>
(4) create_time,execution_start_time,end_time
presto:wxd_system_data_diag_prestissimo873> select query_id,create_time,execution_start_time,end_time from query_completed_event_view;
          query_id           |       create_time       |  execution_start_time   |        end_time
-----------------------------+-------------------------+-------------------------+-------------------------
 20250508_034910_00011_sh883 | 2025-05-08 03:49:10.739 | 2025-05-08 03:49:10.779 | 2025-05-08 03:49:11.048
 20250510_032513_00013_3jpjf | 2025-05-10 03:25:13.220 | 2025-05-10 03:25:13.232 | 2025-05-10 03:25:13.435
 20250507_133212_00012_aubnf | 2025-05-07 13:32:12.954 | 2025-05-07 13:32:12.965 | 2025-05-07 13:32:13.160
 20250508_104105_00020_9wt8y | 2025-05-08 10:41:05.477 | 2025-05-08 10:41:05.491 | 2025-05-08 10:41:05.691
(skip)
(5) cputimemillis,walltimemillis,queuedtimemillis,analysistimemillis,planningtimemillis,user
presto:wxd_system_data_diag_prestissimo873> select query_id,cputimemillis,walltimemillis,queuedtimemillis,analysistimemillis,planningtimemillis,user from query_completed_event_view order by cputimemillis desc ;
          query_id           | cputimemillis | walltimemillis | queuedtimemillis | analysistimemillis | planningtimemillis |   user
-----------------------------+---------------+----------------+------------------+--------------------+--------------------+-----------
 20250509_082507_00001_3jpjf |       4345821 |        2105157 |                1 |                295 |                  1 | cpadmin
 20250509_091118_00010_3jpjf |       1781334 |         362933 |                0 |                110 |                  0 | cpadmin
 20250509_090034_00007_3jpjf |       1390588 |         547980 |                0 |                 82 |                  0 | cpadmin
 20250509_090952_00008_3jpjf |       1342467 |          74326 |                0 |                337 |                  0 | cpadmin
 20250509_091729_00011_3jpjf |         11560 |          10024 |                2 |                 97 |                  0 | cpadmin
(skip)
 20250512_040435_00420_3jpjf |          5120 |           8545 |                0 |                 95 |                  0 | user02
 20250512_040413_00419_3jpjf |          4723 |           8711 |                0 |                153 |                  0 | user02
 20250512_040528_00425_3jpjf |          4717 |           7197 |                0 |                133 |                  0 | user02
(6) garbage collection statistics by each stage
Thuan Bui in watsonx.data gives next comment for this article.
In general, the garbage collection statistics help analyze the performance and memory usage of the watsonx.data environment. Specifically, you can use this info to view the number of garbage collection tasks and their duration.
Analyzing garbage collection patterns can help identify areas where memory management might be impacting query performance.
presto:wxd_system_data_diag_prestissimo873> select gcstatistics from query_completed_event_view;
                                                      gcstatistics
------------------------------------------------------------------------------------------------------------------------------------------------------------------------
 [{gcstatistics={stageExecutionId=0, fullGcTasks=0, minFullGcSec=0, totalFullGcSec=0, averageFullGcSec=0, maxFullGcSec=0, tasks=1, stageId=0}}, {gcstatistics={stageExecutionId=0, fullGcTasks=0, minFullGcSec=0, totalFullGcSec=0, averageFullGcSec=0, maxFullGcSec=0, tasks=3, stageId=1}}, {gcstatistics={stageExecutionId=0, fullGcTasks=0, minFullGcSec=0, totalFullGcSec=0, averageFullGcSec=0, maxFullGcSec=0, tasks=1, stageId=2}}, {gcstatistics={stageExecutionId=0, fullGcTasks=0, minFullGcSec=0, totalFullGcSec=0, averageFullGcSec=0, maxFullGcSec=0, tasks=1, stageId=3}}]
(7) total_rows , output_rows, written_output_rows , total_bytes , output_bytes
presto:wxd_system_data_diag_prestissimo873> select query_ID, total_rows , output_rows, written_output_rows , total_bytes , output_bytes from query_completed_event_view ;
          query_ID           | total_rows | output_rows | written_output_rows | total_bytes  | output_bytes
-----------------------------+------------+-------------+---------------------+--------------+--------------
 20250510_162513_00065_3jpjf |        101 |           0 |                   0 |        32512 |            0
 20250510_034013_00014_3jpjf |         88 |           0 |                   0 |        27648 |            0
 20250512_013158_00006_3jpjf |        101 |         101 |                   0 |        32358 |        35029
(8) cumulative_memory,completed_splits ,peak_running_tasks,peak_user_memory_bytes, peak_total_non_revocable_memory_bytes
presto:wxd_system_data_diag_prestissimo873> select query_ID, cumulative_memory,completed_splits ,peak_running_tasks,peak_user_memory_bytes, peak_total_non_revocable_memory_bytes from query_completed_event_view order by peak_user_memory_bytes desc;
          query_ID           |  cumulative_memory   | completed_splits | peak_running_tasks | peak_user_memory_bytes | peak_total_non_revocable_memory_bytes
-----------------------------+----------------------+------------------+--------------------+------------------------+---------------------------------------
 20250509_090034_00007_3jpjf |  5.95972757574112E14 |               34 |                  7 |             1330660672 |                            1330660672
 20250509_091118_00010_3jpjf |  3.80918108884128E14 |               34 |                  7 |             1298437952 |                            1298437952
 20250512_045701_00552_3jpjf |    1.892203501152E13 |               49 |                 17 |             1236474496 |                            1236474496
 20250512_045553_00547_3jpjf |   1.7233812380736E13 |               47 |                 17 |             1232313088 |                            1232313088
 20250509_082507_00001_3jpjf | 2.034853455377984E15 |               34 |                  7 |             1214251840 |                            1214251840
(9) peak_task_user_memory, peak_task_total_memory, peak_node_total_memory , source ,catalog, schema
presto:wxd_system_data_diag_prestissimo873> select query_id, peak_task_user_memory, peak_task_total_memory, peak_node_total_memory , source ,catalog, schema from query_
completed_event_view order by peak_node_total_memory desc;
          query_id           | peak_task_user_memory | peak_task_total_memory | peak_node_total_memory |   source    |   catalog    |     schema
-----------------------------+-----------------------+------------------------+------------------------+-------------+--------------+----------------
 20250512_050110_00563_3jpjf |             507779328 |              507779328 |              616562688 | presto-cli  | iceberg_data | sf1_no_part
 20250509_082507_00001_3jpjf |             447929728 |              447929728 |              528482304 | presto-cli  | hive_data    | hsf100_no_part
 20250512_034147_00357_3jpjf |              94352704 |               94352704 |              368050176 | presto-cli  | hive_data    | hsf1_no_part
(10) resource_group_id, session_properties, server_version
presto:wxd_system_data_diag_prestissimo873> select distinct  resource_group_id from query_completed_event_view;
resource_group_id
-------------------
[global]
(1 row)
presto:wxd_system_data_diag_prestissimo873> select distinct  session_properties from query_completed_event_view;
        session_properties
------------------------------------
{enable_wxd_query_optimizer=false}
{enable_wxd_query_optimizer=true}
{}
(3 rows)
presto:wxd_system_data_diag_prestissimo873> select distinct  server_version from query_completed_event_view;
server_version
----------------
0.286
(1 row)
(11) query_state , error_code
presto:wxd_system_data_diag_prestissimo873> select distinct  query_state, error_code from query_completed_event_view;
 query_state |                            error_code
-------------+------------------------------------------------------------------
 FAILED      | {retriable=false, code=1, name=SYNTAX_ERROR, type=USER_ERROR}
 FAILED      | {retriable=false, code=2, name=ABANDONED_QUERY, type=USER_ERROR}
 FINISHED    | NULL
(3 rows)
(12) query_state , error_code , failure_type , failure_message , failure_json where query_state='FINISHED'
presto:wxd_system_data_diag_prestissimo873> select distinct query_state , error_code , failure_type , failure_message , failure_json from query_completed_event_view where query_state='FINISHED';
 query_state | error_code | failure_type | failure_message | failure_json
-------------+------------+--------------+-----------------+--------------
 FINISHED    | NULL       | NULL         | NULL            | NULL
(1 row)
(13) error_code , failure_message where query_state='FAILED'
[mika0501 0501-0703TZ bin]$ ./presto-run --engine=P01 --catalog=wxd_system_data --schema=wxd_system_data_diag_prestissimo873 <<< "select error_code , failure_message fr
om query_completed_event_view where query_state='FAILED';"
presto:wxd_system_data_diag_prestissimo873> select error_code , failure_message from query_completed_event_view where query_state='FAILED';
                            error_code                            |                                                       failure_message
------------------------------------------------------------------+-------------------------------------------------------------------------------------------------------
 {retriable=false, code=2, name=ABANDONED_QUERY, type=USER_ERROR} | Query 20250512_030730_00260_3jpjf has not been accessed since 2025-05-12T03:07:30.218Z: currentTime 2025-05-12T03:22:30.441Z
 {retriable=false, code=1, name=SYNTAX_ERROR, type=USER_ERROR}    | line 1:1: Destination table 'hive_data.hsf100_no_part.customer' already exists
 {retriable=false, code=2, name=ABANDONED_QUERY, type=USER_ERROR} | Query 20250512_031724_00291_3jpjf has not been accessed since 2025-05-12T03:17:25.046Z: currentTime 2025-05-12T03:32:25.274Z
 {retriable=false, code=2, name=ABANDONED_QUERY, type=USER_ERROR} | Query 20250512_031724_00291_3jpjf has not been accessed since 2025-05-12T03:17:25.046Z: currentTime 2025-05-12T03:32:25.274Z
(4 rows)
(14) plan: Data seems to be same as the output of EXPLAIN ANALYZE, because it shows the distributed execution plan of the statement along with the cost of each operation.
[mika0501 0501-0703TZ bin]$ ./presto-run --engine=P01 --catalog=wxd_system_data --schema=wxd_system_data_diag_prestissimo873 <<< "select plan from query_completed_event_view where query_id='20250512_050110_00563_3jpjf';" | cut -b 1-168
presto:wxd_system_data_diag_prestissimo873> select plan from query_completed_event_view where query_id='20250512_050110_00563_3jpjf';
------------------------------------------------------------------------------------------------------------------------------------------------------------------------
 Fragment 0 [SINGLE]
     CPU: 366.84us, Scheduled: 398.70us, Input: 5 rows (224B); per task: avg.: 5.00 std.dev.: 0.00, Output: 5 rows (162B), 1 tasks
     Output layout: [n_name, sum]
     Output partitioning: SINGLE []
     Stage Execution Strategy: UNGROUPED_EXECUTION
     - Output[PlanNodeId 32][N_NAME, REVENUE] => [n_name:varchar, sum:double]
             CPU: 0.00ns (0.00%), Scheduled: 0.00ns (0.00%), Output: 5 rows (162B)
             Input avg.: 5.00 rows, Input std.dev.: 0.00%
             N_NAME := n_name (1:8)
             REVENUE := sum (1:28)
         - RemoteMerge[1] => [n_name:varchar, sum:double]
                 CPU: 0.00ns (0.00%), Scheduled: 0.00ns (0.00%), Output: 5 rows (35.84kB)
                 Input avg.: 5.00 rows, Input std.dev.: 0.00%
 Fragment 1 [ROUND_ROBIN]
     CPU: 2.76ms, Scheduled: 3.76ms, Input: 5 rows (288B); per task: avg.: 1.67 std.dev.: 2.36, Output: 5 rows (162B), 3 tasks
     Output layout: [n_name, sum]
     Output partitioning: SINGLE []
     Stage Execution Strategy: UNGROUPED_EXECUTION
     - LocalMerge[PlanNodeId 1575][sum DESC_NULLS_LAST] => [n_name:varchar, sum:double]
         - PartialSort[PlanNodeId 1430][sum DESC_NULLS_LAST] => [n_name:varchar, sum:double]
                 CPU: 0.00ns (0.00%), Scheduled: 0.00ns (0.00%), Output: 5 rows (192B)
                 Input avg.: 0.21 rows, Input std.dev.: 479.58%
             - RemoteSource[2] => [n_name:varchar, sum:double]
                     CPU: 0.00ns (0.00%), Scheduled: 0.00ns (0.00%), Output: 5 rows (288B)
                     Input avg.: 0.21 rows, Input std.dev.: 479.58%
(skip)
(15) query : full text of query. <<>> is used instead of new line.
[mika0501 0501-0703TZ bin]$ ./presto-run --engine=P01 --catalog=wxd_system_data --schema=wxd_system_data_diag_prestissimo873 <<< "select query from query_completed_even
t_view where query_id='20250512_050110_00563_3jpjf';"
presto:wxd_system_data_diag_prestissimo873> select query from query_completed_event_view where query_id='20250512_050110_00563_3jpjf';
query
--------------------------------------------------------------------------------------------------------------------------------------------------------------------------
select<<>>n_name,<<>>sum(l_extendedprice * (1 - l_discount)) as revenue<<>>from<<>>customer,<<>>orders,<<>>lineitem,<<>>supplier,<<>>nation,<<>>region<<>>where<<>>c_custkey = o_custkey<<>>and o_orderkey = l_orderkey<<>>and l_suppkey = s_suppkey<<>>and c_nationkey = s_nationkey<<>>and s_nationkey = n_nationkey<<>>and n_regionkey = r_regionkey<<>>and r_name = 'ASIA'<<>>and o_orderdate >= date ('1994-01-01')<<>>and o_orderdate < date ('1994-01-01') + interval '1' year<<>>group by<<>>n_name<<>>order by<<>>revenue desc
(1 row)
(16) isajoinquery: it shows whether query includes join.
[mika0501 0501-0703TZ bin]$ ./presto-cli --engine=P01 --catalog=wxd_system_data --schema=wxd_system_data_diag_prestissimo873
presto:wxd_system_data_diag_prestissimo873> select  distinct  isajoinquery from query_completed_event_view;
 isajoinquery
--------------
 true
 false
(2 rows)
Conclusion
This article shows query_completed_event_view Overview, Column definitions, Example data based on my experience.
Reference
Environment
- watsonx.data on IBM Software Hub 5.1.3
- Master (8vcpu×32GB memory x 3node) / Worker ((32vcpu×128GB memory + 300 ephametal Storage) x 5node)
- Installed OCP Version : 4.16 , CP4D 5.1.3 ( watsonx.data 2.1.3 , Query Optimizer )
- Client : Red Hat Enterprise Linux release 9.4 (Plow) ibm-lh-client 2.1.3