
The content on this page was originally published on Instana.com and has been migrated to the community as a historical asset. As such, it may contain outdated information on our products and features. Please comment if you have questions about the content.
Most IT professionals have been involved in at least 1 root cause investigation during their career. Whether due to a formal process at a large enterprise or due to a user complaining about an application issue at a small business, the goal is the same: understand what condition(s) produced the negative impact and fix them. This has always been a difficult activity, sometimes resulting in no identification of root cause. Issues will mysteriously disappear and reappear over and over again without ever getting fixed. In recent years this has gotten worse due to more layers of virtualization, more distributed services, and more frequent releases. There’s so much data coming from so many systems that it’s incredibly difficult to cut through the noise to find the signal we’re looking for.
Enter OpenShift and other Kubernetes (K8s) implementations… root cause analysis gets incrementally more difficult again. ?
YAC-MU (Yet Another Config to Mess Up) aka YAC-FU
There is no denying that OpenShift solves some significant problems when you’re running containerized microservices. Some benefits include service discovery, load balancing, health checks, resource management, and auto-scaling. OpenShift builds upon standard open source Kubernetes with the following features as described by Michael Hausenblas:
- Built-in support for development workflow, using own registry or integration with external CI/CD pipeline, incl. openshift/source-to-image (S2I)
- Easy and powerful handling of routes, that is, exposing services to the outside world (cf. ingress controller+resources in vanilla Kube)
- Templating + Catalog
- HA setup and operational support for backup & restore
- Out-of-the-box metrics (moving to Prometheus soon) and aggregated logging (EFK stack)
- Built-in OAuth server supporting a range of identity providers, see Configuring Authentication and User Agent
- Many other smaller goodies such as a nice UI, installer, etc.
No matter how many features are added to Kubernetes there is one thing that remains the same – people must configure how Kubernetes deploys services and manages resources. Trouble!
Things You Need to Know When Using OpenShift
OpenShift is NOT a black box. A LOT of data is available via command line or API. The main problem is that someone or something needs to collect this data, analyze it, and make sense of it in context of how it relates to the deployed services and underlying resources. If you’re a developer or DevOps using an OpenShift service to deploy software, you need certain questions answered after you commit and deploy new code:
- Has the new version been deployed?
- Are all of the desired replicas running?
- If the deployment failed, why?
- Are all of my replicas available?
- Do my services have enough resources to perform well?
- Was there a performance regression?
- Are there any errors?
- Are there performance optimization opportunities?
If you’re managing the OpenShift platform you need to know answers to different questions:
- Are etcd, controller-manager, and scheduler healthy?
- Are all resources consumed on any of the nodes in my clusters?
- Are any restart loops occurring?
- Are any nodes down?
- Are issues with K8s impacting the performance or availability of any application services?
It’s not possible to answer all of these questions by looking at data provided solely by OpenShift. In order to answer these questions you need a monitoring solution that collects detailed data from OpenShift, monitors the application services and infrastructure, and correlates all OpenShift components with all application components. That’s a tall order – enter Instana. ?
Monitoring OpenShift and Application Services
Instana is incredibly easy to install to OpenShift and all of your application services. You can use the Instana Operator for OpenShift, a Helm Chart, or a YAML file to get the agent installed to OpenShift.
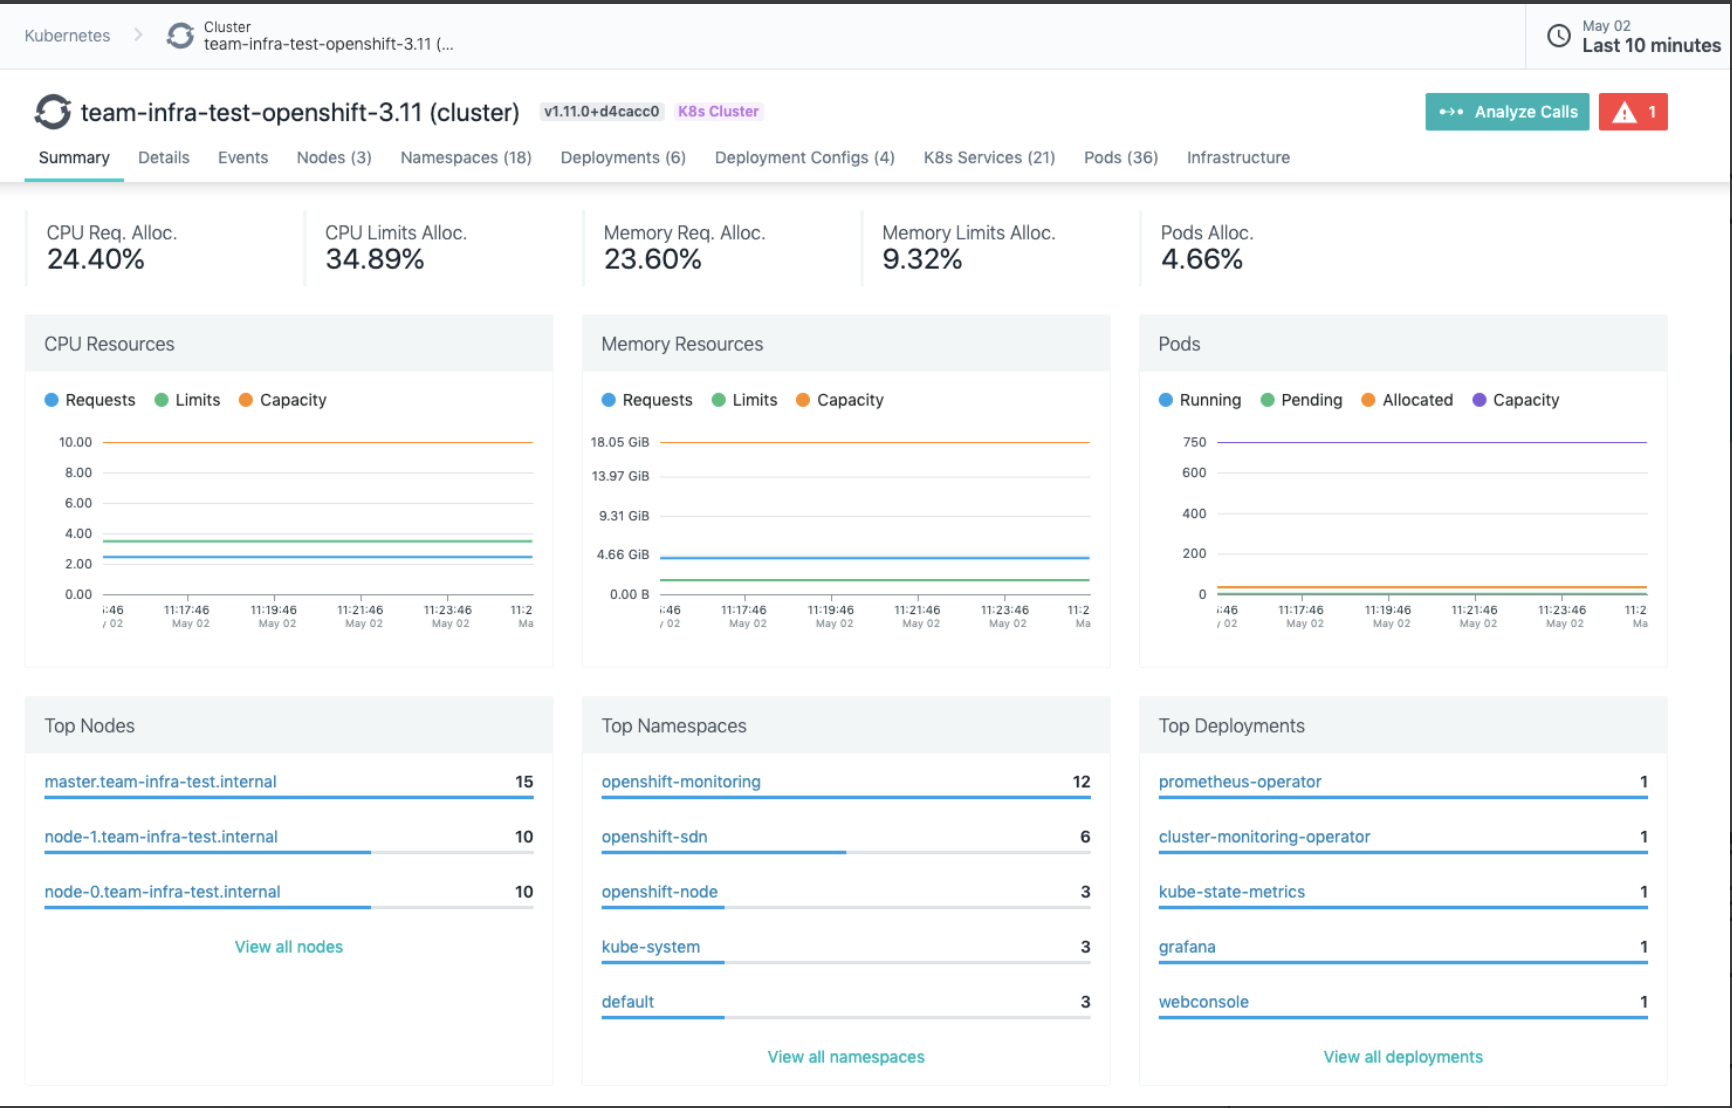
Screenshot of Instana’s OpenShift Summary dashboard. Much more detailed information is available on supporting tabs.
The Instana agent is a daemonset so it is automatically added to all nodes. The single, lightweight agent continually discovers all OpenShift, application, and infrastructure components and deploys sensors crafted to monitor each technology. With no human intervention, sensors automatically collect configuration, changes, metrics, and events. Metrics from all components are collected in high fidelity with 1 second data granularity. Every request is traced across each microservice, automatically capturing the response time and context – no sampling, no partial traces.

Correlated view of service, process, Docker container, host, and OpenShift.
To understand how a system of services works together and the impact of component failure, Instana enhances traces with information about the underlying service, application, and system infrastructure using our Dynamic Graph. All gathered data is organized into dependency relationships, continuously modeling your services and infrastructure, including the relationships with OpenShift. This is the real magic of Instana’s comprehensive monitoring. This enables Instana to generate an understanding of how EVERY part of your application ecosystems impact each other. That’s how Instana achieves root cause analysis and contributing factor analysis for OpenShift and its deployed application services.
Incredibly, Instana knows if there is a problem, contributing factors to that problem, and the most likely root cause within a few seconds.

Screenshot of Instana Root Cause Analysis showing that a K8s event has triggered a service degradation with an application service.
Red Hat offers excellent functionality with their OpenShift product but all great products need great monitoring tools to provide the right visibility in production. Instana discovers, monitors, traces, and analyzes your OpenShift platform, deployments, and infrastructure. It provides the ultimate level of visibility and understand when you need to fix issues in production. You can try Instana in your own environment with our free trial today.
#RCA