MaaS360 has extensive reporting and analytics capabilities that cover summary and detail information for Mobile Devices, Mobile Apps, Mobile Expense Management, Mobile Security, PC Inventory, PC Security and Community Analytics.
Last month in our MaaS360 10.73 April 2019 release, we added a new report, the Unified Endpoint (UEM) Overview report which replaces the MDM Overview report. The UEM Overview provides a summary view of your Devices by Platform, Devices by Managed Status, Devices by Ownership, and New Devices in a business dashboard. The new UEM Overview report is another example of our efforts to continually improve our extensive portfolio of reports and analytics capabilities. Let’s look at the new UEM Overview report.
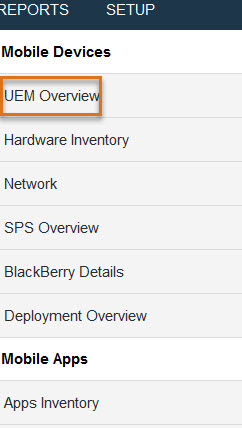
The UEM Overview report can be found in the MaaS360 portal under Reports > Mobile Devices
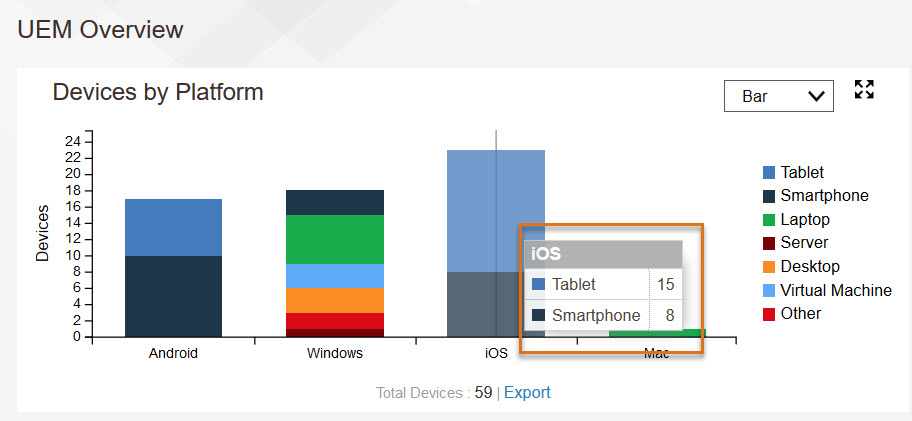
Four graphical snapshots with optional drill down capabilities make up the UEM Overview: Devices by Platform, Devices by Managed Status, Devices by Ownership, and New Devices. A summary graph for each is displayed in one business dashboard so you can quickly analyze your entire UEM environment from one pane.

You can easily set the graph type by selecting Bar, Pie, Line or Area. Administrators can set the default graph type in Administrator Settings > Analytics. Hover over each section of the graph to view the counts. For example, in the iOS data point when you hover your mouse over the graph, you can view the types of iOS devices, in this case there are 8 iOS Smartphones and 8 iOS Tablets. This provides a nice visual of your environment and can help you plan for refreshes and updates or just provide a quick device type count/audit.
For each graph, you can export to a png file, making it easy for you to share the status of your mobile environment for planning and status purposes. To view the detail of the report, click the full screen icon in the upper right of each graph.
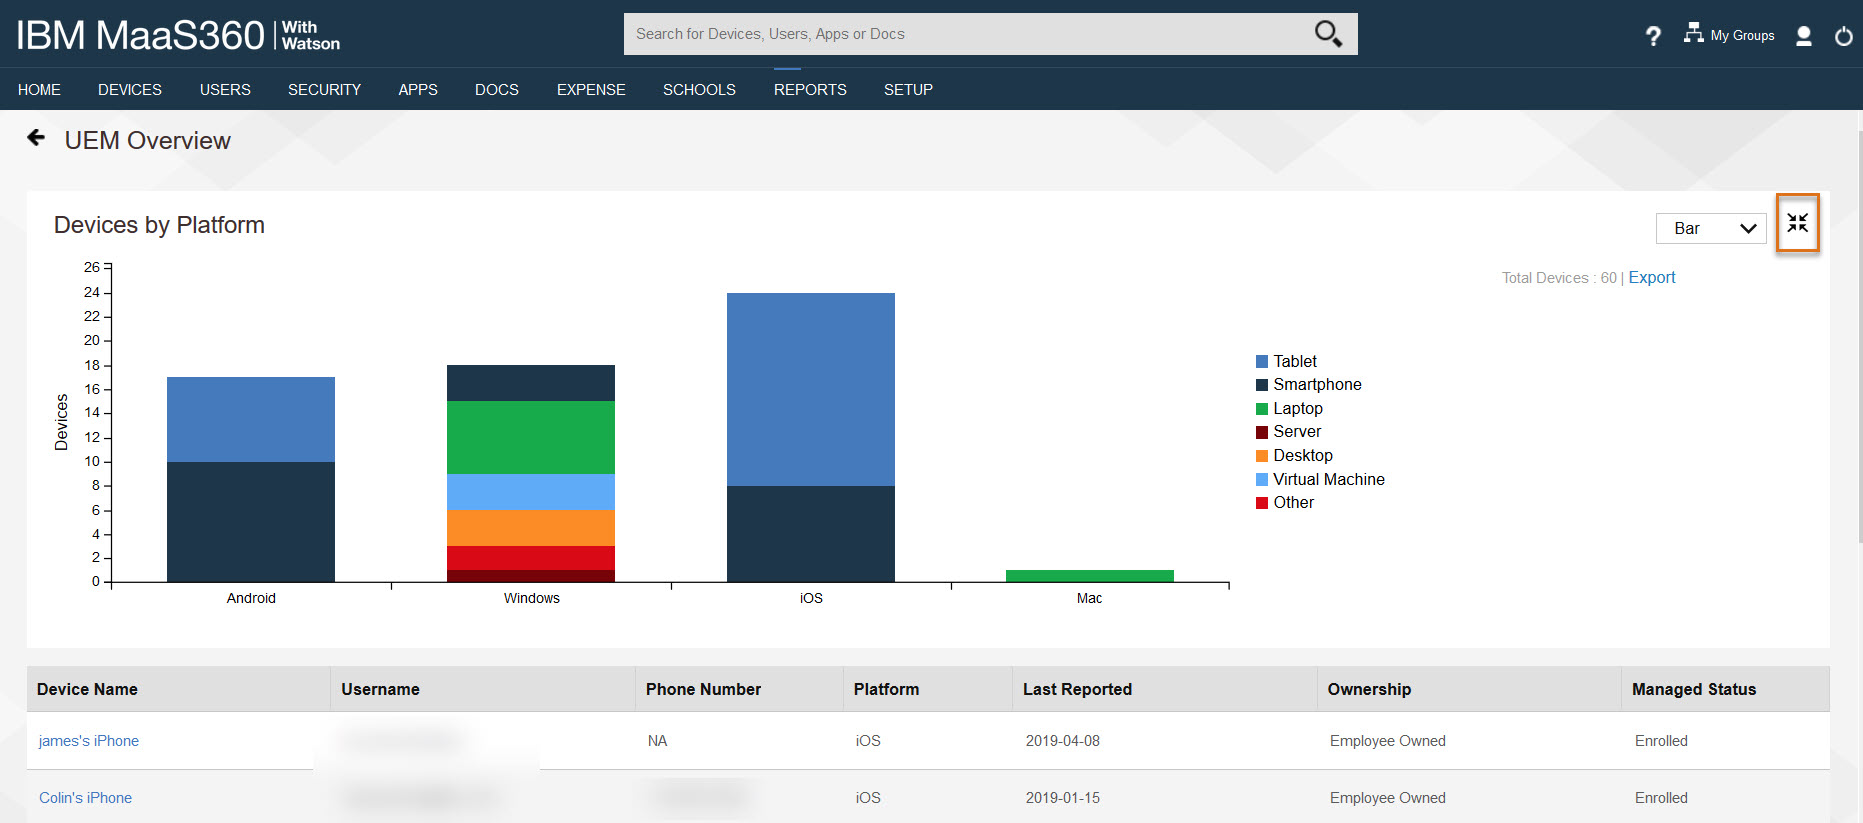
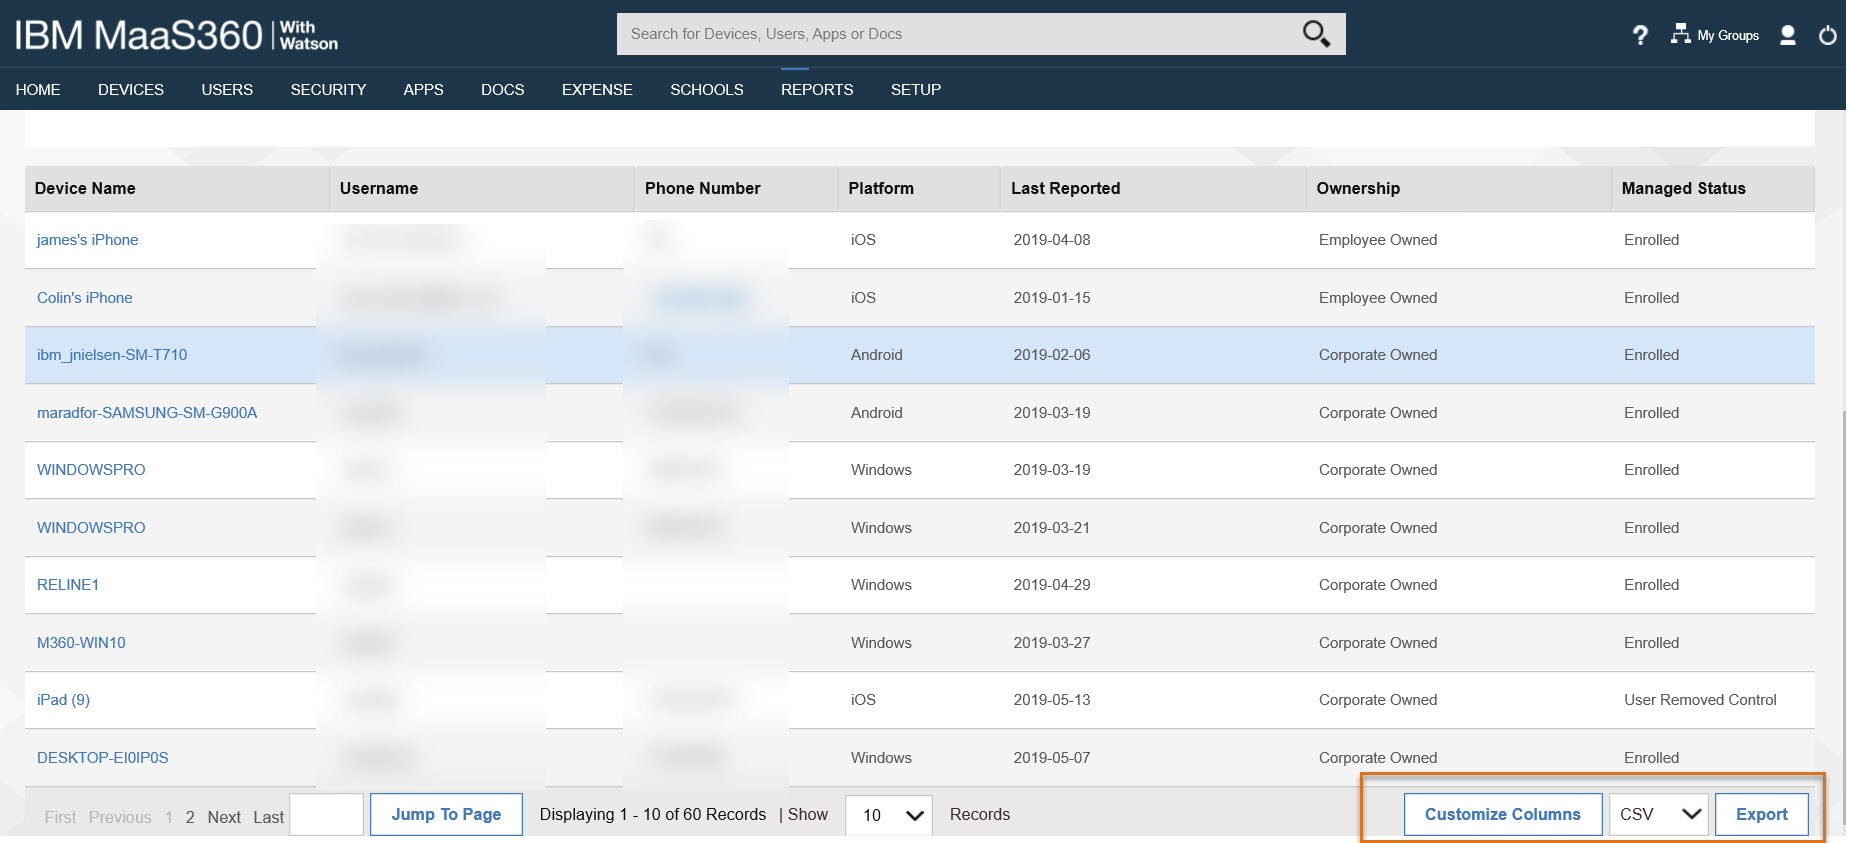
When you expand to full screen mode, the graph and a detailed list of devices that make up the report are displayed. Use the column headers to sort, search, and filter data. After you sort and filter the data, you can export the detail data to a CSV file. There is also an option to customize the column data that is included in the report. For example, you can add the user domain, email, and UPN.
The reports are refreshed every 24 hours. Administrators can also set subscription and UI options in Administrator Settings > Analytics.
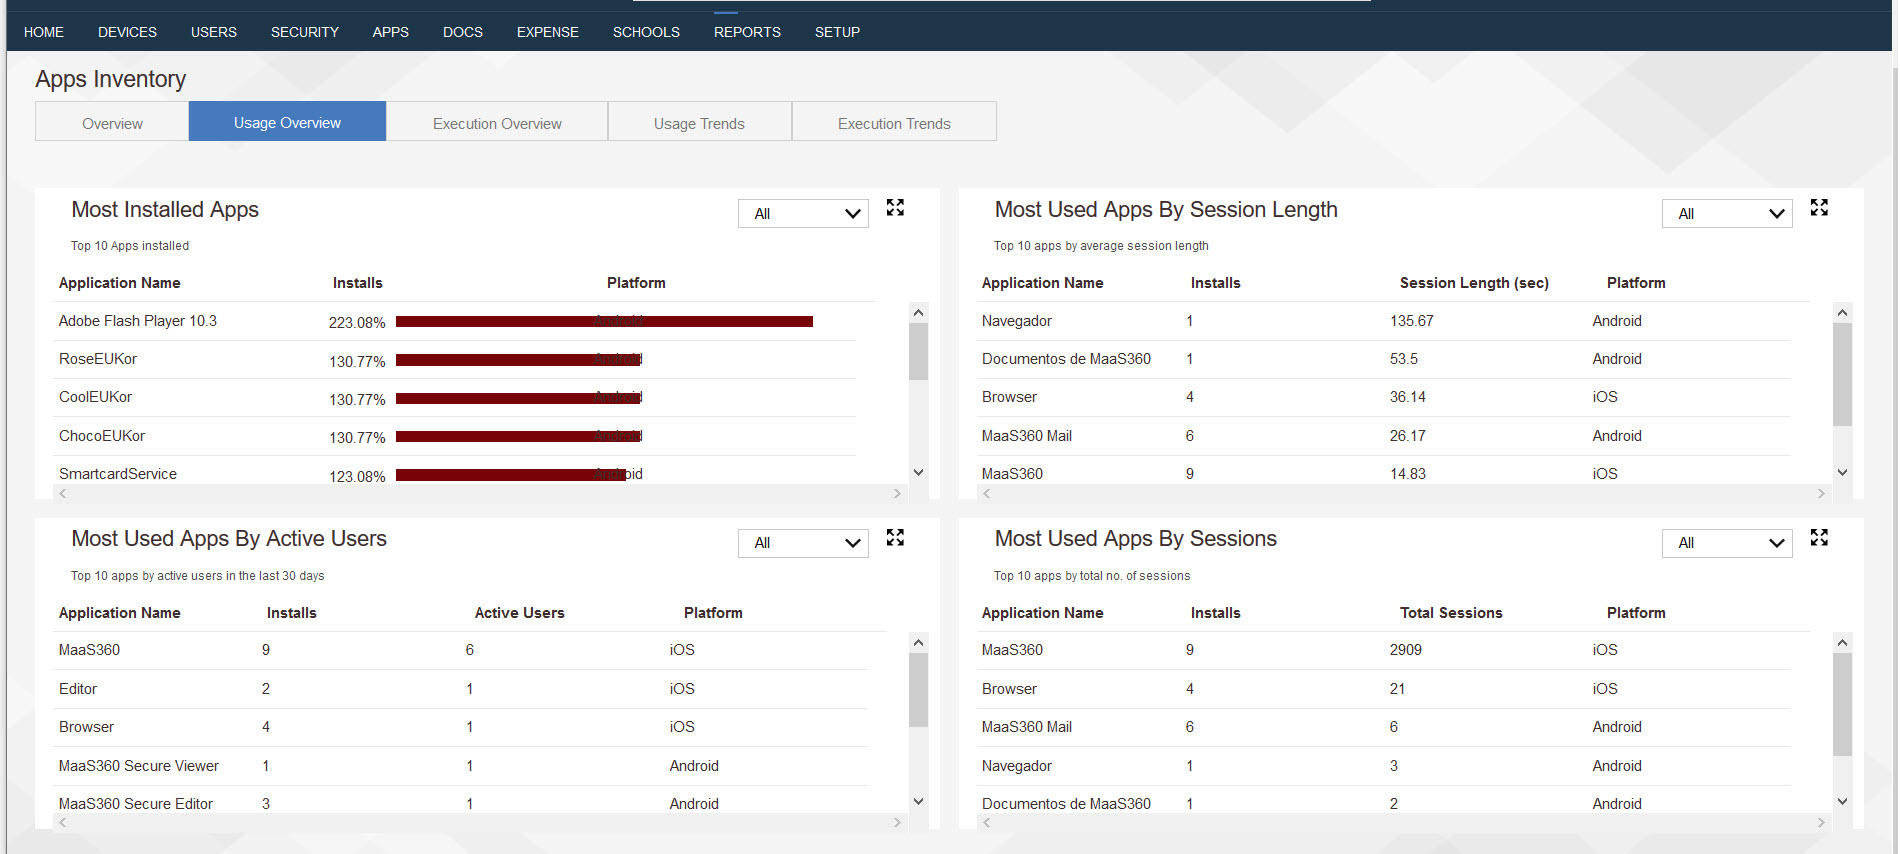
If you have been using Maas360 for a while, you might remember that we began modernizing our reporting and analytics with the App Inventory and Mobile Metrics reports. If you are new to MaaS360 or perhaps you haven’t used the App Inventory analytics yet, App Inventory provides an excellent way to analyze the effectiveness and efficiency of your mobile apps.
For example, let’s take a quick look at the Apps Usage in Apps Inventory. Like the new UEM Overview report, there is one dashboard that graphically summarizes key data points with the option to drill down to the detail for Most Installed Apps, Most Used Apps By Active Users, Most Used Apps By Session Length, Most Used Apps By Sessions.
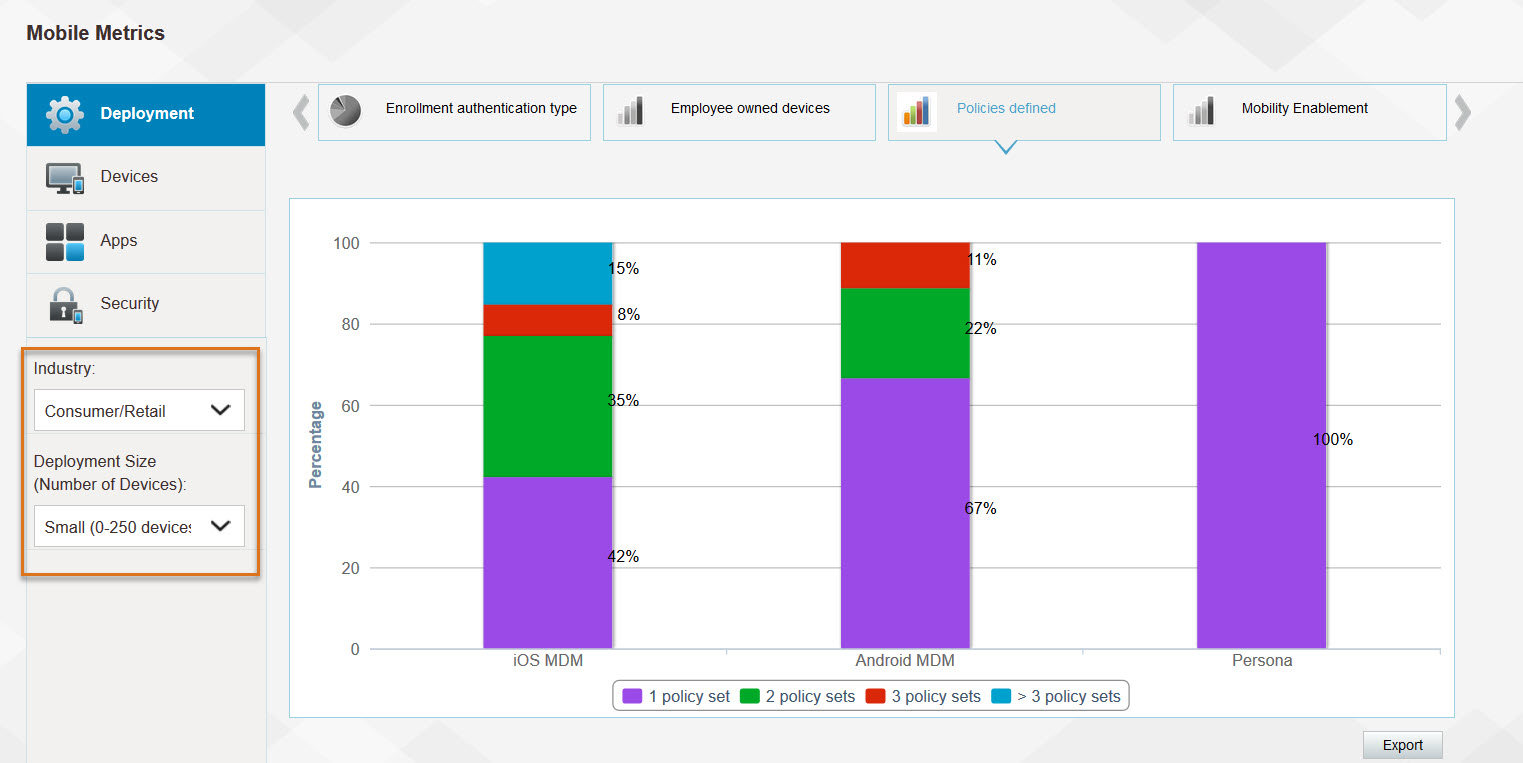
Finally, let’s review Mobile Metrics for MaaS360®. Mobile Metrics is a cloud-based benchmarking tool for Unified Endpoint Management (UEM) deployments. Because MaaS360 is a multitenant cloud service, it has the unique capability which enables you to compare your mobile environment to the MaaS360 Community based on industry and deployment size. For example, if you are a small retail provider you can select the consumer/retail industry and small deployment size to see how your deployment plans stack up to your industry peers based on deployment choices such as authentication type, employee owned devices, number of policies defined, and mobile configurations.
You can also benchmark Devices, Apps, and Security metrics to help you improve security and efficiency. Here is an example of a deployment mobile metric on number of policies used for small retail customer deployments.
In summary, the UEM Overview report is now available in the MaaS360 portal for you to use and joins Mobile Metrics and App Inventory with a newly redesigned UI and analytics capabilities that we can expect to see spread across the rest of the MaaS360 reporting portfolio.
Additional resources
IBM Knowledge Center Product documentation and videos