IBM Instana website automatic instrumentation quickly and easily enables website monitoring by automatically injecting the JavaScript agent into the website with minimum configuration steps and no code changes of the website. For more information, see JavaScript agent.
Assuming you have set up two Apache HTTPd servers on Red Hat OpenShift in different namespaces. Each HTTPd server has two defined websites. This automatic website instrumentation assists you to monitor the performance of the defined websites.
The following figure illustrates a scenario in which individual departments might have same business requirements, such as a query service. The web servers are created in different namespaces, isolating groups of resources within the departmental scope.
Enabling website automatic instrumentation
To enable website automatic instrumentation on the Red Hat OpenShift cluster, complete the following steps:
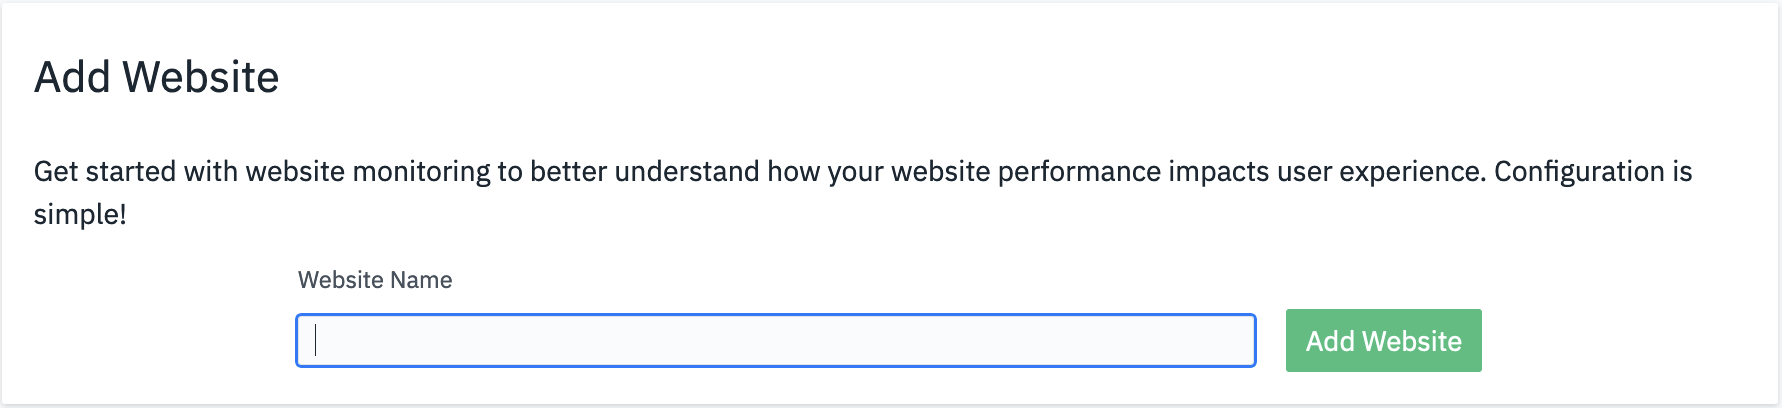
Step 1: Create websites in Instana UI dashboard
1.1 In the Instana UI, go to the Websites dashboard and create four websites with following names.
- shop.dept1.apps.subside.cp.fyre.ibm.com
- query.dept1.apps.subside.cp.fyre.ibm.com
- flight.dept2.apps.subside.cp.fyre.ibm.com
- query.dept2.apps.subside.cp.fyre.ibm.com
1.2 Record the values for reportingUrl, key, and jsAgentUrl for each website.

Step 2: Deploy Instana agent on your Openshift cluster
You can install the Instana agent by using operator, helm chart, and yaml file. For more information, see Installing the host agent on Red Hat OpenShift.
Step 3: Configure Instana agent to enable website automatic instrumentation
By default, the website automatic instrumentation is disabled. You can change the agent configuration to enable this feature. For more information, see Website automatic instrumentation.
You can define the matching rules for your websites as shown in the following:
configuration.yaml: |
com.instana.plugin.eum:
instrumentation:
jsAgentUrl: 'https://eum.instana.io/eum.min.js'
reportingUrl: 'https://eum.instana.rocks'
trackSessions: true
websites:
- name: 'shop.dept1.apps.subside.cp.fyre.ibm.com'
key: 'AmrmgaCpTemMdOHIT8XXZw'
selector:
matchExpressions:
- key: 'k8s/namespace'
operator: 'Equals'
values:
- 'dept1'
- key: 'k8s/podname'
operator: 'StartWith'
values:
- 'httpd-2.4'
- key: 'url/filename'
operator: 'StartWith'
values:
- '/var/www/shop'
- name: 'query.dept1.apps.subside.cp.fyre.ibm.com'
key: 'ALd2cAguTvyZPqSgRTs9oA'
selector:
matchExpressions:
- key: 'k8s/namespace'
operator: 'Equals'
values:
- 'dept1'
- key: 'k8s/podname'
operator: 'StartWith'
values:
- 'httpd-2.4'
- key: 'url/filename'
operator: 'StartWith'
values:
- '/var/www/query'
- name: 'flight.dept2.apps.subside.cp.fyre.ibm.com'
key: 'hQkMV0ISTQemHsUOc-EJsg'
selector:
matchExpressions:
- key: 'k8s/namespace'
operator: 'Equals'
values:
- 'dept2'
- key: 'k8s/podname'
operator: 'StartWith'
values:
- 'httpd-2.4'
- key: 'url/filename'
operator: 'StartWith'
values:
- '/var/www/flight'
- name: 'query.dept2.apps.subside.cp.fyre.ibm.com'
key: '98SNdmCtR-a1Bsia51pGtw'
selector:
matchExpressions:
- key: 'k8s/namespace'
operator: 'Equals'
values:
- 'dept2'
- key: 'k8s/podname'
operator: 'StartWith'
values:
- 'httpd-2.4'
- key: 'url/filename'
operator: 'StartWith'
values:
- '/var/www/query'
When all the match expressions evaluate to true, the HTTP requests to the specified URL through browser are monitored in the format of beacons. Later, these beacons are transmitted to the related website on the reporting URL https://eum.instana.rocks.
To achieve end-to-end monitoring with backend trace correlation, you must enable Apache HTTPd Tracing in agent configuration simultaneously.
com.instana.plugin.httpd:
tracing:
enabled: true
autoRestart: true
Step 4: Access websites and check whether EUM JavaScript is injected
Open the browser developer tools to verify whether the EUM code snippet is added to the <head> section of an HTML document.
![Inspector
q Search HTML
<meta
<tit te>index
<script>
Console
D Debugger
Network
01
( function (s, t, a, [t] I (s [t] ) {n. q. push(arguments)},
n• Date)}) (window, "InstanaEumObject" , "ineum" ) ;
ineum( ' reportingUrl' ,
'https://eum. instana. rocks'); ineum( 'key' ,
' hQkMVØISTQemHsUOc—EJsg i); ineum( 'trackSessions ) ;
</script>
<script defer="" crossorigin="anonymous"
<hl>lt works
ea href—
href—
imp le/doj oget.
">RTTestware/](https://dw1.s81c.com//IMWUC/MessageImages/2a64255075f5474b8b141767fc59e2e5.png)
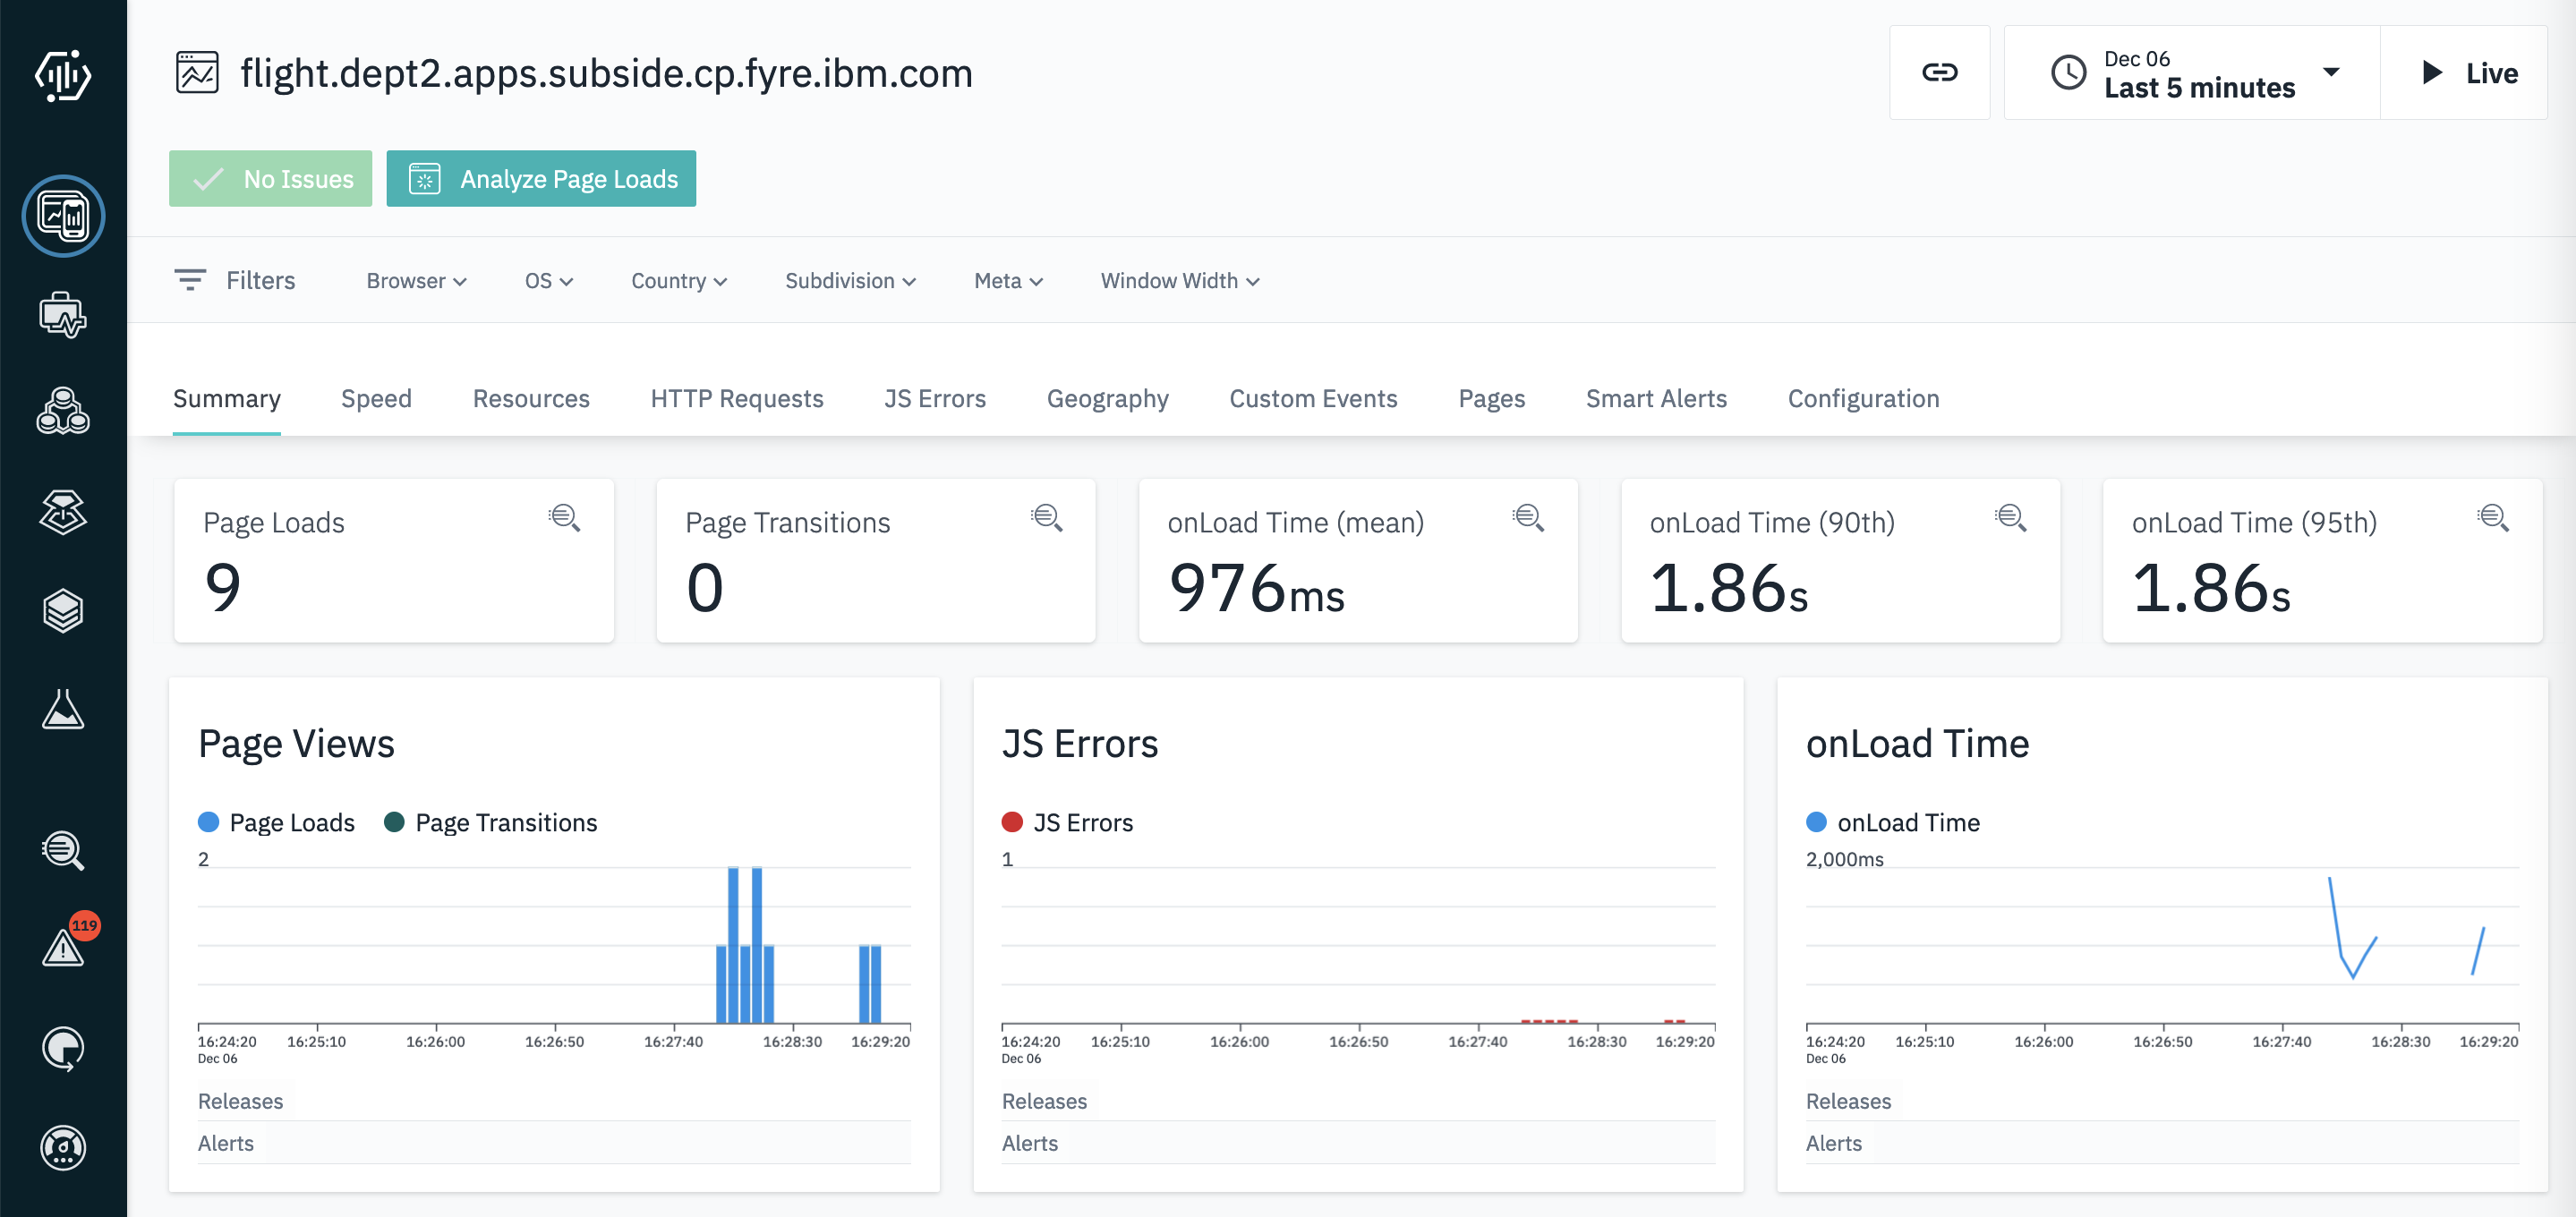
Step 5: Verify the performance data in Instana website dashboard
You can view and verify the website performance data in the website dashboard.
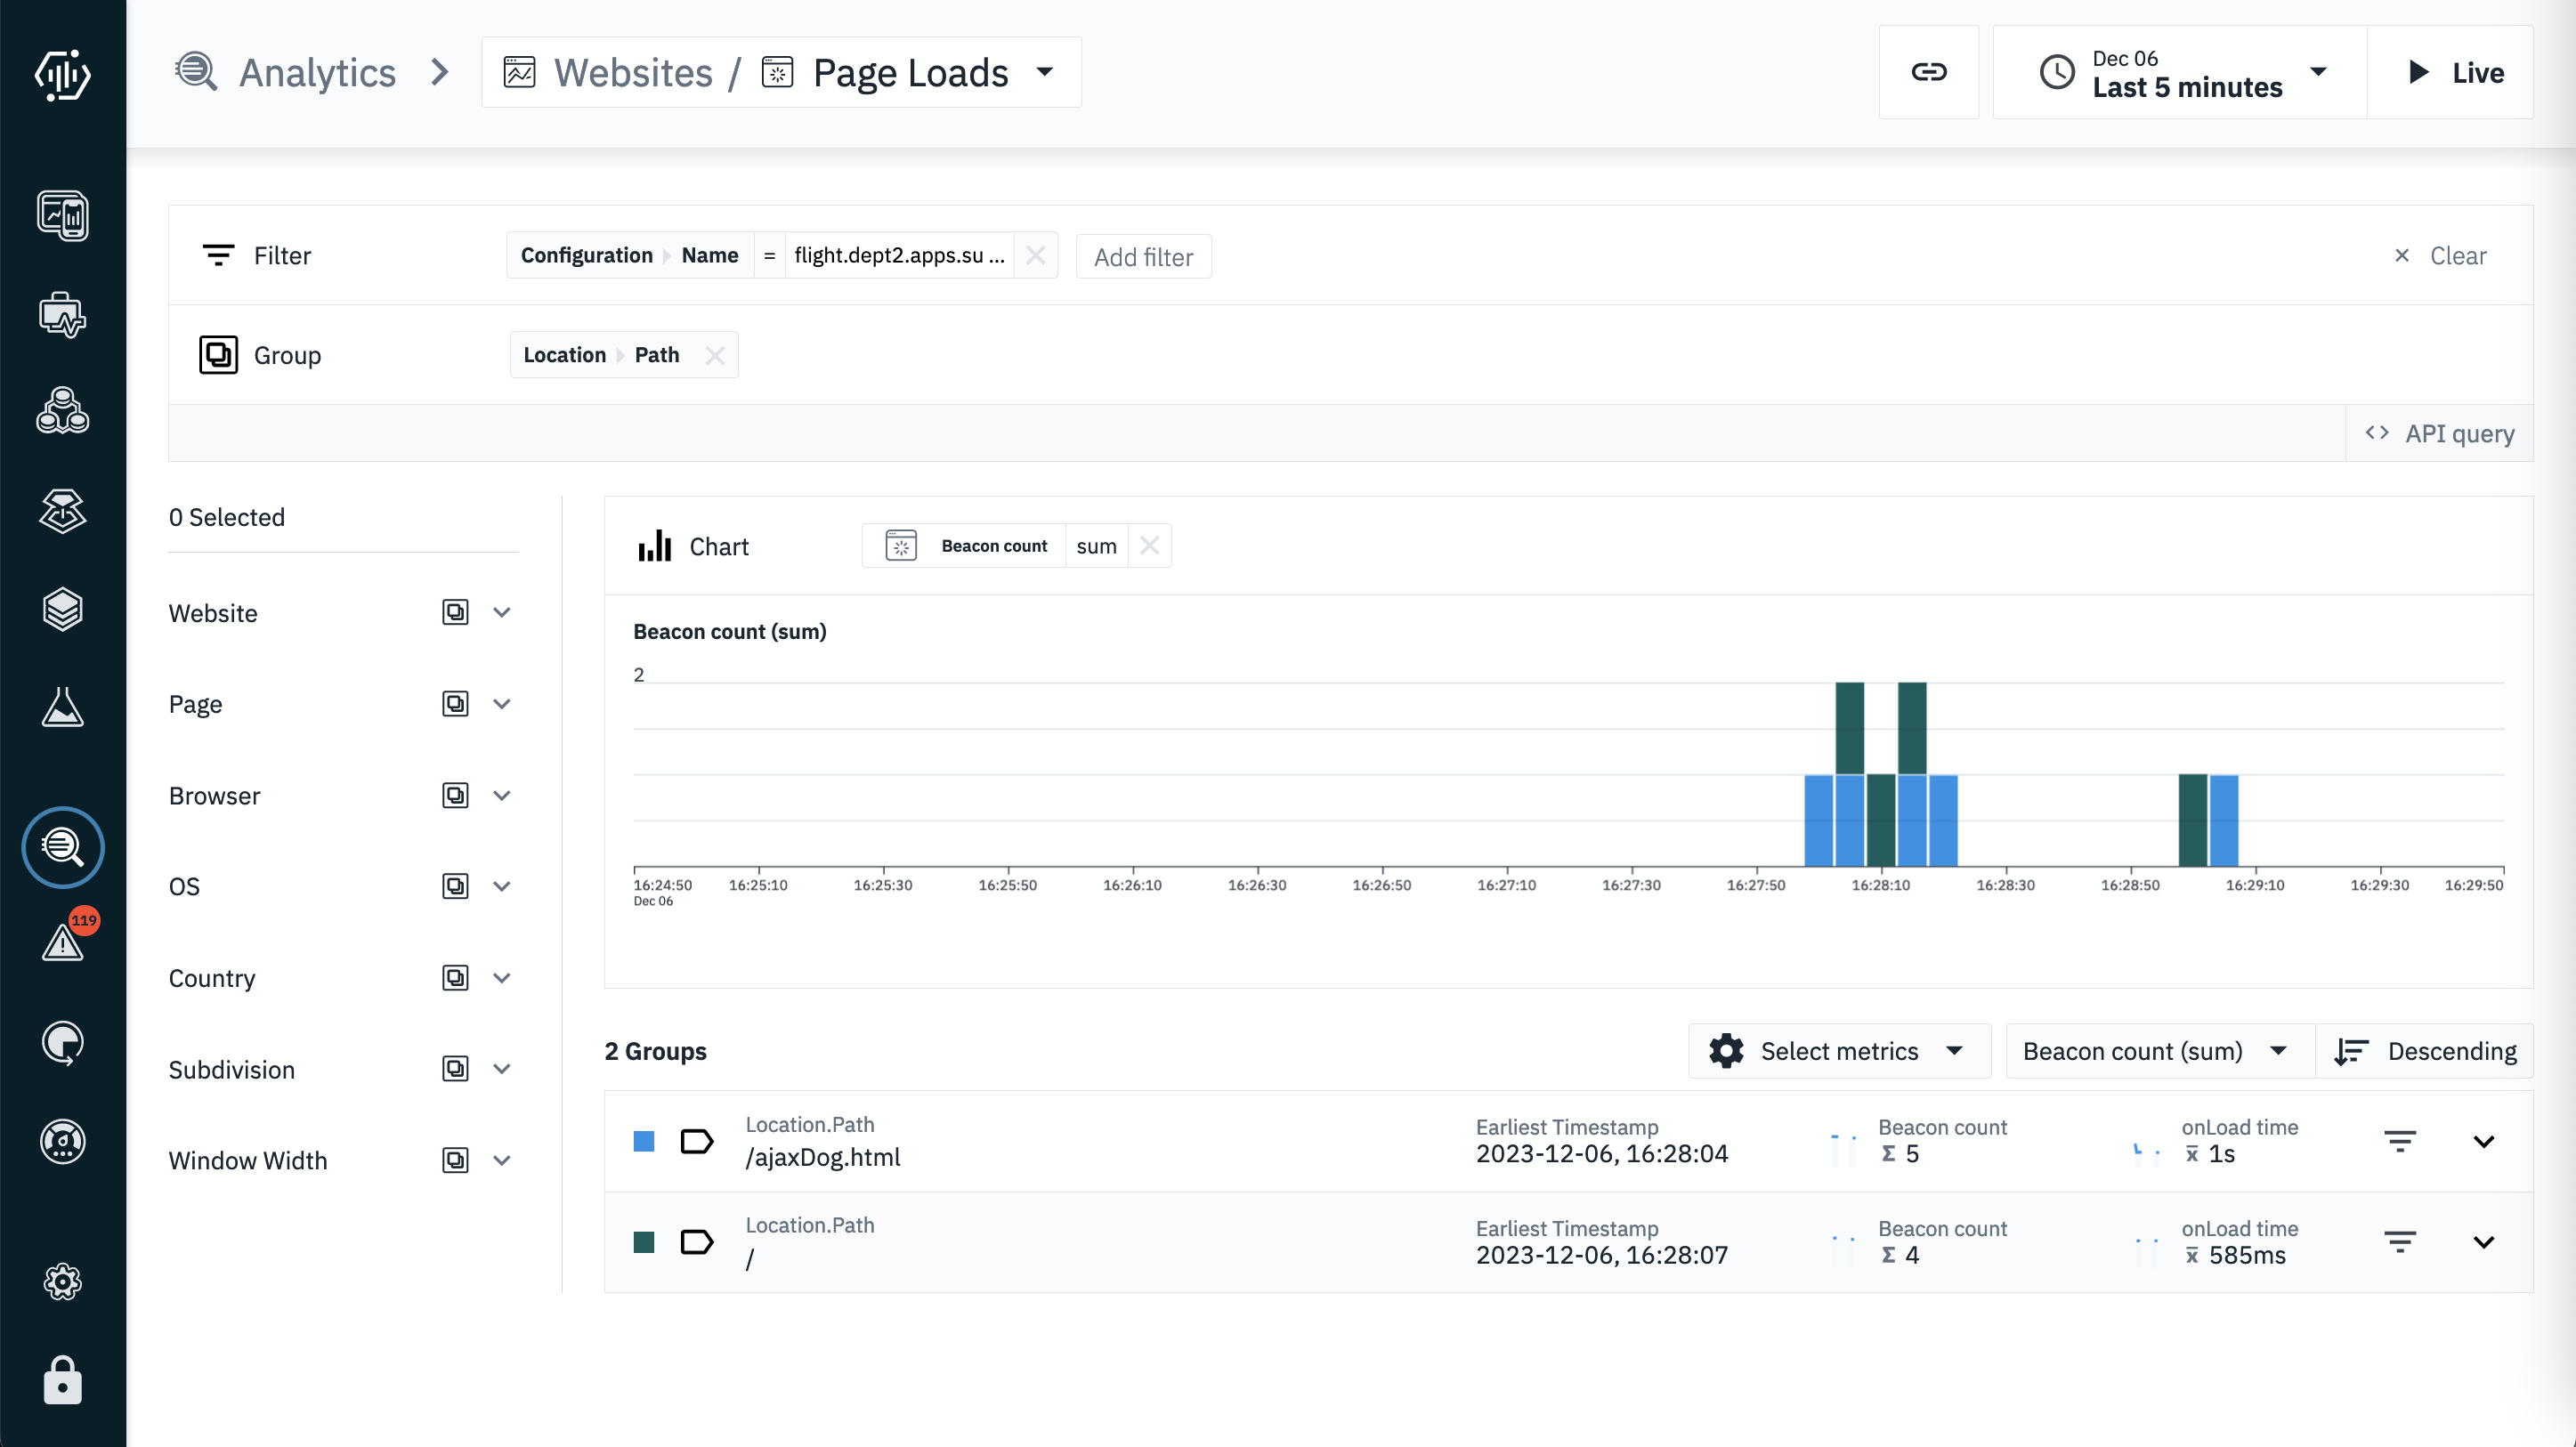
You can also use Instana analytical capabilities to analyze website monitoring data in the analytics view.
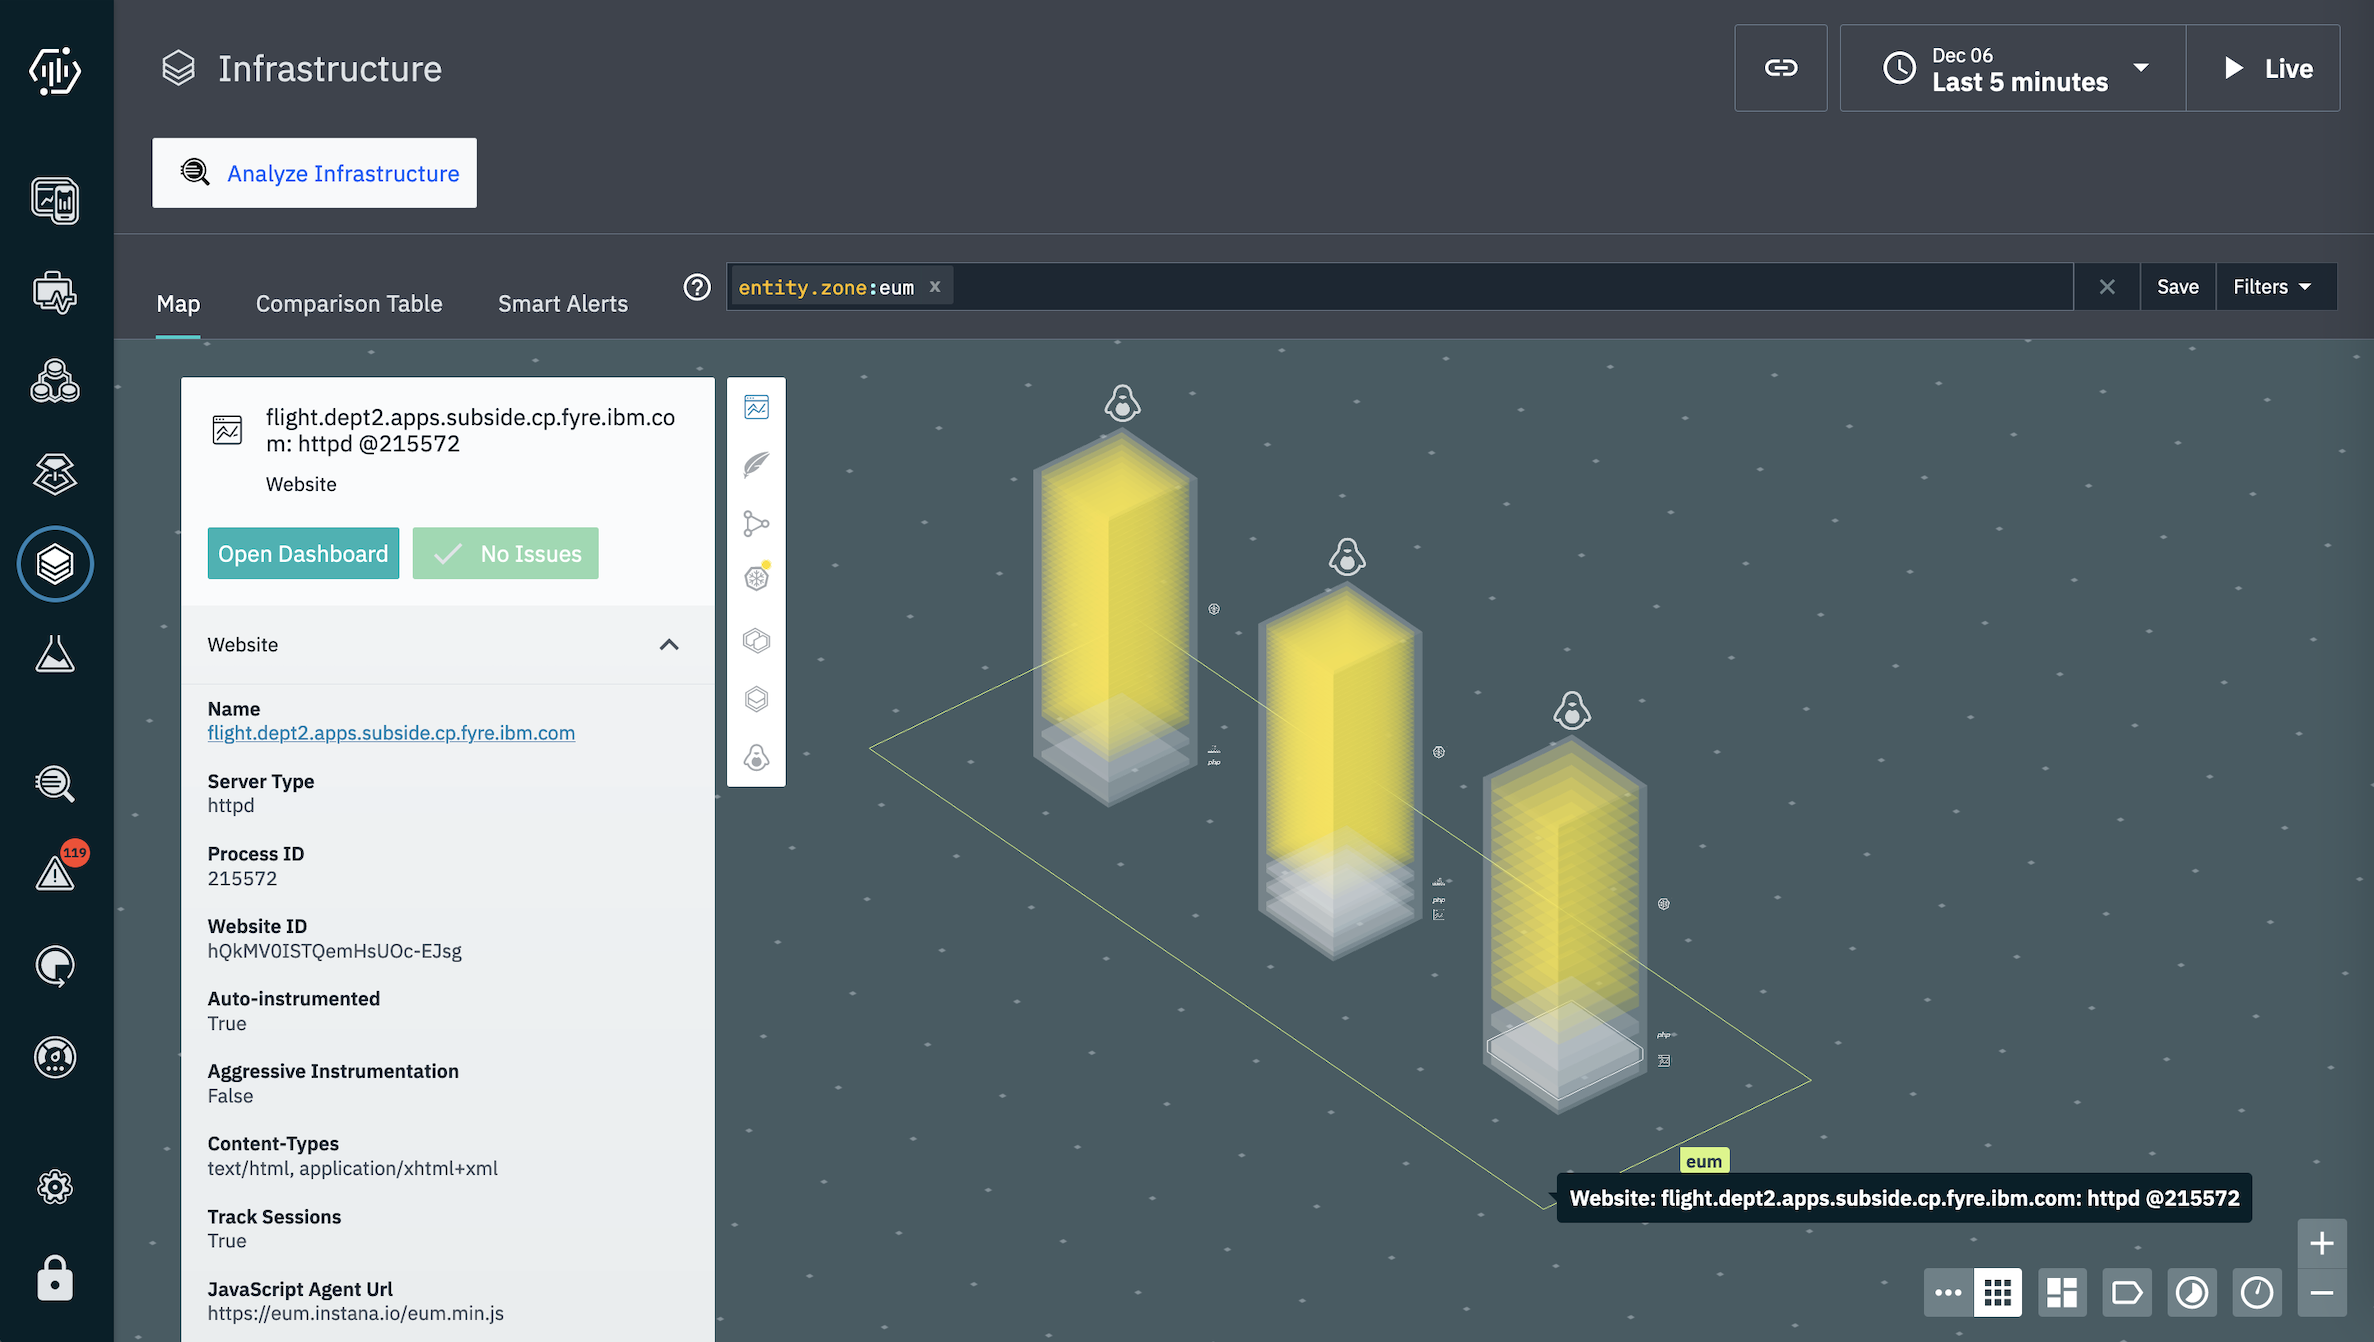
Step 6: Verify the websites in the Instana infrastructure map dashboard
In the Infrastructure Map dashboard, locate your zone. You will observe the website that runs on the system and represented as a block in the pillar. To see the infrastructure hierarchy of the website, click Block.
Summary
Instana website automatic instrumentation reduces the manual efforts to inject JavaScript into the Apache HTTPd websites. This feature helps you to enable website monitoring more efficiently.
Co-Authors:
#EUM #website-monitoring #Apache #httpd
#EUM