Hi!
This is simple tutorial to demonstrate how I integrated IBM DataPower Gateway with Elastic Tools. When I say Elastic Tools, it´s Elastic + Kibana + Logstash.
DataPower logs
First, talking about my DataPower environment, I have a MPGW where I receive all the requests, it´s my front door, and this MPGW has a XSLT file that works as a routing. So, I edited this XSLT to get all the requests and send it to the logs.
You can add an action rule in your MPGW (or XMLFW) and add a XSLT code to do this.
See the example:
<!-- Block for logging -->
<xsl:variable name="ClientIP" select="dp:variable('var://service/client-service-address')"/>
<xsl:variable name="URI" select="dp:variable('var://service/URI')"/>
<xsl:variable name="TimeStamp" select="date:date-time()"/>
<xsl:variable name="RequestSize" select="dp:request-header('Content-Length')"/>
<xsl:message dp:priority="notice">
<xsl:value-of select="substring-before($TimeStamp,'+')"/>,
<xsl:value-of select="substring-before($ClientIP,':')"/>,
<xsl:value-of select="$URI"/>,
<xsl:value-of select="$RequestSize"/>
</xsl:message>
<!-- End of logging block -->
See that in the first blocks I got the variables (rembember, these are just examples) you can get the info you will need, and later in the xsl:message block I´m sending it to logging output.
Note: In my DataPower I´m sending my system log to another server, via logging target.
Now if you see the logs, it will look like:
Aug 20 10:28:29 scv01 [drag2][0x80000001][xsltmsg][notice] mpgw(HTTPS_MPGW_EDP_Drag2): trans(420896205)[request][35.203.243.204] gtid(420896205): 2018-08-20T10:28:29,35.203.243.204,/EDPOnline/CustomerContractV4,841
This part in yellow is the part generated by the XSLT above and the part we will use in the Elastic.
Note: I created a Shell Script, to just grep this part of the logs and send it to another file, so we don´t have the first block of the logs, because, it would be trash to Elastic.
Now, let´s go to Elastic part
First, you can go to Elastic web site and download it: https://www.elastic.co/products
I downloaded the rpm version for my Red Hat server, you can download the version that attend you.
The rpm version will allow me to run it as a service, via systemctl command.
After installed, you can simple run Elastic, Kibana e Logstash. If you read the documentation about all of them, there are no much secret, the magic is only related to the logstash pipeline file, which you will see below.
As soon as you install and run Kibana, you should be able to access it via port 5601, if you installed it locally, you can access: http://locahost:5601
You will see that there are yml config files for each product.
My files are located at: /etc/elastic/elastic.yml, /etc/kibana/kibana.yml and /etc/logstash/logstash.yml
There is no much configuration you should do, I only added an alternative path for the logs, etc, but if you find any issue, check the elastic documentation. The forum is also very good.
If you read how logstash works, you will see there are pipeline configuration files, I created one for my inbound logs (my DataPower environment have inbound and outbound transaction and I separated both)
This is mine inbound.conf
input {
file {
path => "/app/home/Reports/Inbound-completeVersion.txt"
sincedb_path => "/dev/null" # Always read file from beginning
start_position => "beginning"
}
}
filter {
# Simple CSV parsing
csv {
columns => ["begin", "OriginIP", "Flow", "DestinationURI", "Duration(ms)", "RequestSize"]
separator => ","
convert => {
#"Duration(ms)" => "float"
"RequestSize" => "integer"
}
}
}
output {
elasticsearch {
index => ["datapower_inbound"]
hosts => ["localhost:9200"]
}
#stdout { codec => rubydebug }
}
The configuration is simple, as you see.
There are, of course, much to do with this file, for example, if you want to format any value:
grok {
match => ["remoteURL", "http://(?<Backend>\w+)"]
}
In this case I´m getting the remoteURL variable, from the logs (I didn´t add this value in the log example above) and add it to Backend variable for logstash. I´m getting what is after “http://”.
There is also an option to use a dictionary, very useful, if you want to show the hostname instead of the IP address:
translate {
field => "DestinationURI"
destination => "remoteURL"
override => true
dictionary_path => "/etc/logstash/dictionaryInbound.csv"
}
The dictionaryInbound.csv will have the IP and the hostname, separated by “,”.
I know there is maybe any details missing here, but this is just to give you an idea what I did in my environment. You can customize it to what you need.
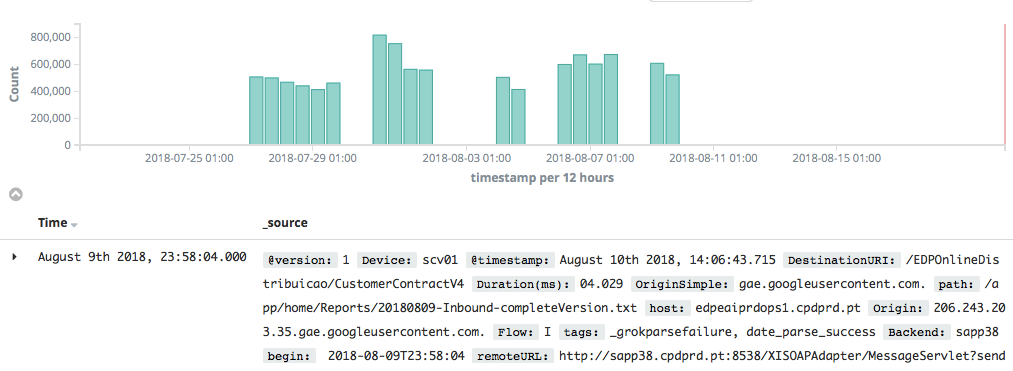
This is an screenshot from Kibana, you should see something similar:
Don´t forget to always check the logs for each of the tool, elastic, kibana and logstash.
Hope you enjoy it!
If you have any questions, leave a comment or get in touch: letakeda@gmail.com
Thanks,
Leandro Takeda