This article describes the message flow performance monitoring and alerting feature implemented in App Connect Enterprise v12.0.7.0 and 11.0.0.20.
Background
Before we start describing this new feature and how to configure it, let's look at the problem statement and the context that motivated this enhancement.
Performance issues in App Connect Enterprise (ACE) can often be caused by poorly performing backend systems. However, this is not always visible to customers or support staff because the initial symptom looks like a flow that takes a long time to run. Diagnosing these issues generally requires a support engineer to analyse a service trace, or to analyse accounting and statistics data provided by the customer. Both of these tasks are time consuming, and some customers are reticent to enable either of these options due to the performance cost incurred. When there are 10s and 100s of message flows running, then it becomes even more difficult to isolate the problematic message flow and the node(s) within the flow that are contributing to the slowness. Performance degradation issues often lead to cascade failures which makes a timely problem resolution even more important.
This feature would enhance message flow nodes in ACE to self-monitor their own performance. The internally implemented analysis service would then monitor these statistics and issue warnings to the system administrator in the form of a BIP message to syslog or console log if significant deviations or degradation over time is detected.
Illustration through an example Scenario:
Let us take an example message flow ‘ProcessAccount’ to understand the concepts.

In the above message flow ‘ProcessAccount’ , the compute node ‘UpdateDatabase ‘ performs few database operations. The HTTPRequest node sends out an synchronous http request to an external webserver and receives the response. Then TCPIP nodes send and receive response from a remote legacy application. In short, in this message flow four nodes are interacting with external applications. If there is an issue with any of these external services, then the respective message flow node can take more time which intern will affect the entire transaction time of the message flow and it can go beyond the accepted level of end to end response times.
This is where the performance alert feature can really help identify quickly which node within the flow is experiencing performance degradation.
Once Performance Alert feature is enabled on the Integration Server, the message flow nodes calculate and maintain the average execution time of the node during the processing of an initial set of messages (called as training phase) by the node. If the message flow node takes more time compared to its average execution time, then an alert message is logged in the system log so that the ACE administrator can notice the performance degradation and take corrective steps if needed. This feature also provides an option to enable Accounting and Statistics of the message flow once a performance degradation is observed on any of the message flow nodes.
How to configure ACE Integration Server for performance alerts:
Performance alert feature can be enabled by amending properties in the PerformanceAlert subsection of the Statistics section in the server.conf.yaml configuration file.
PerformanceAlert:
alertOn: true
alertInterval: 300
warmupMessageCount: 2000
alertMinNodeElapsedTime: 500
alertMinNodeElapsedTimeDeviation: 50
#startMessageFlowStatistics: false
#statisticsCollectionDuration: 10
Explanation of the properties:
alertOn – Valid values are true and false. The default value is false. A value of ‘true’ enables the performance alert feature.
alertInterval – Defines the frequency in seconds at which performance warnings will be logged to the syslog. The default value is 300.
warmupMessageCount - Defines the initial number of input messages (since Integration Server startup) that are used to determine the average elapsed time of a message flow node at per thread level. The default value is 200.
alertMinNodeElapsedTime – Sets the minimum level for the elapsed time in milli seconds for a message flow node to qualify for performance alerts. A message flow node produces an alert only if its elapsed time exceeded this threshold value and its performance degradation is more than the configured alertMinNodeElapsedTimeDeviation value. The default value is 1000 milliseconds.
alertMinNodeElapsedTimeDeviation – Defines the deviation (in percentage) for ElapsedTime for a message flow node which when exceeded, a performance alert event message (BIP warning) is emitted in the syslog or console log. The default value is 50.
startMessageFlowStatistics – This property when set to ‘true’ will auto enable message flow snapshot statistics in ‘csv’ format (if not already enabled) if a performance deviation is observed. The purpose is to log the statistics data into files for offline analysis. The default value is false.
statisticsCollectionDuration – Defines the time in minutes after which the auto enabled ‘csv’ stats will be stopped. The default value is 10 minutes.
Integration server restart is required after making this configuration in server.conf.yaml for changes to take effect.
Once performance alerting is active, if a message flow node resulted in performance degradation then based on the configured property values a BIP8514W will get logged in the system log file.
Apr 6 08:36:33 prevost user:warn|warning ACE[25756408]: IBM App Connect Enterprise v12080 (JBRK12.default) [Thread 27504] (Msg 1/1) BIP8514W: Message flow node 'HTTP Request' in message flow 'ProcessAccount' has taken '10002' milli seconds which is unusually long and the associated message id is '(00006B70-642E7677-000000FA)'. The average time taken by this node during the warmup message processing was '41' milli seconds.
What this alert or warning tells us that the 'HTTP Request' node usually completes its transaction within 41 milliseconds. This ‘41’ number is the average value calculated by the internal monitoring service by observing the node’s performance internally for the certain number of messages as defined by the warmupMessageCount property in server.conf.yaml. But during the processing of message with id ‘00006B70-642E7677-000000F’, the 'HTTP Request' node took '10002' milli seconds which is unusually higher compared to its average execution time.
Note: Each message flow node calculates its average execution time from the initial set of input messages configured as warmupMessageCount property value. During the processing of these initial messages no BIP8514W alert get logged even if there is a performance deviation.
Overall, the administrator gets very pointed information about which node in a message flow is experiencing performance degradation and what is the extent of it by outputting the actual elapsed time of the node.
It is important to correctly tune the properties alertMinNodeElapsedTimeDeviation and alertMinNodeElapsedTime for the following reasons:
alertMinNodeElapsedTime – If this value is set too low, then many nodes in the message flow may get qualified for the monitoring by internal monitoring services and then even the slightest glitch (or a transient issue) in the system/network may trigger flood of warnings in the syslog. So it is advisable that the alertMinNodeElapsedTime is set to a reasonable value that caters to most complex nodes and external service interacting nodes. A good guidance could be the end to end response time that you may have defined as the NFRs of your message flow (service).
alertMinNodeElapsedTimeDeviation – If this value is set too low then even for very short and transient issues on the system, you might see performance alerts. It is important that you use this value in combination with alertInterval to arrive at a conclusion that the message flow is really experiencing performance degradation. For example, if you continue to see alerts at regular interval as configured via alertInterval then that would indicate that system indeed has an ongoing problem and not just one off occurrence.
If you want to set performance alert for nodes where
· You want the nodes to learn its avg processing times through first 5000 messages
· You want to monitor nodes whose elapsed time is > 800 ms
· Raise alert when deviation goes beyond 50%
· receive alerts in syslog every 60 seconds.
Then, you would set the following properties in the PerformanceAlert subsection of the Statistics section in the server.conf.yaml configuration file.
PerformanceAlert:
alertOn: true
alertInterval: 60
warmupMessageCount: 5000
alertMinNodeElapsedTime: 800
alertMinNodeElapsedTimeDeviation: 50
NOTE: This feature is available across all form factors of ACE v12, i.e. ACE on-prem vm based deployment, ACE in CP4I, ACEcc, ACEaaS in AWS.
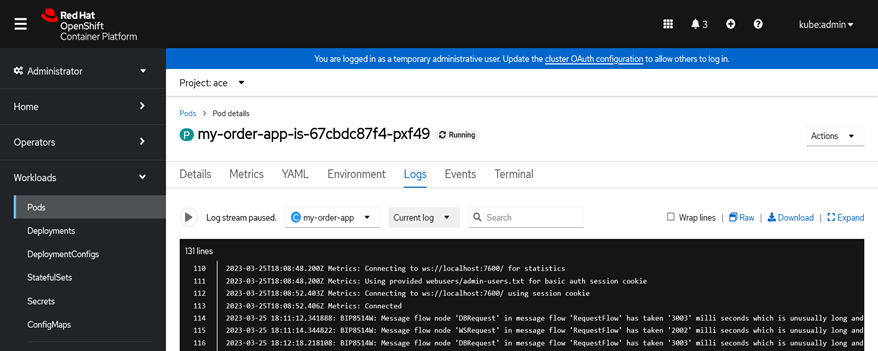
ACE on CP4I :
The performance alert warning message BIP8514W is logged in console log / pod log of the integration server.
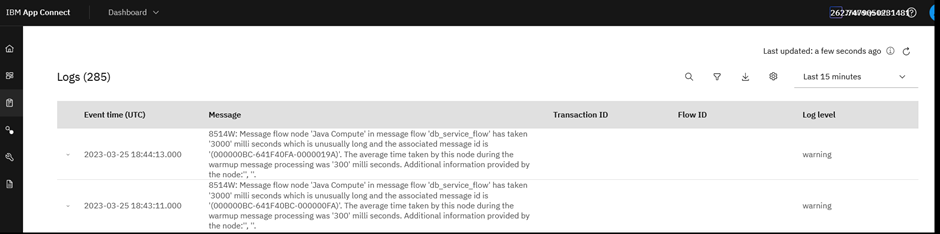
ACEaaS on AWS: You can view the alerts in the Logs section of ACE Dashboard
Conclusion:
Message flow Performance alert feature available in ACE 12.0.7.0 and ACE 11.0.0.20 onward.
This enhancement would allow ACE to automatically notify system administrators of performance issues with backend systems in real time and allow them to take pre-emptive action before cascade failures occur.
This will also enable support engineers to identify failing message flow node much more quickly and provide better time-to-resolution for message flow performance cases.
Acknowledgement: Amar Shah, David Crighton, William Marlow