Many companies continue to deploy their business services on traditional Windows servers and virtual machines, whether on the cloud or on-premise.
To effectively monitor Windows applications and servers, some organizations choose to use OSS Prometheus and the Windows exporter. However, this approach requires a multi-step configuration process for both Prometheus and the Windows exporter.
With the new IBM Cloud Monitoring Windows Prometheus Bundle, you have the ability to monitor the health, performance, and troubleshooting aspects of your Windows servers and services across your hybrid infrastructure through a single interface. This installer offers a native Windows installation process, enabling you to start monitoring for your Windows servers quickly and at scale, enhancing overall operational efficiency.
What is the Windows Prometheus bundle
The Windows Prometheus bundle is a comprehensive package that installs and configures the Open Source-licensed, community-supported Prometheus Agent and Windows Exporter and then automatically sends your Windows servers‘ metrics, using remote write, to your IBM Cloud Monitoring instance.
The Windows Prometheus Bundle installs the Prometheus agent and Windows exporter as services to initiate them automatically when the server is started or restarted without manual action.
Windows users can pick which metrics they want to collect by selecting from various available collectors, such as IIS, MSSQL, services, processes, server resource utilization for CPU, Memory, Storage, Network and others.
How to get started with IBM Cloud Monitoring Windows Prometheus Bundle
The Windows Prometheus Bundle provides an all-in-one-package using a MSI file, so users don’t need anything else to start monitoring their Windows servers.
As a prerequisite, you need to have one IBM Cloud Monitoring instance in your IBM Cloud account.
-
Start by downloading the binary installer from the latest release of this project.
-
Run the installer in your Windows server
-
Configure the remote write endpoint and Monitor API Token.
-
Select the collectors you want to enable to generate metrics.The most commonly used collectors are available in the wizard and additional Windows Exporter collectors can be added as a comma separated list.

5. Click “Install” and wait until the installation has finished.
Note: In order to automate the installation process, system administrators can run the installer via the .command line or PowerShell. You can get more information about using CLI and all options in this document.
Benefit: Get full infrastructure visibility with out-of-the-box Dashboards and Alerts
Once you have completed the installation in your first Windows server, access your IBM Cloud Monitoring instance and start reviewing the out-of-the-box dashboards, alerts and explore your metrics.
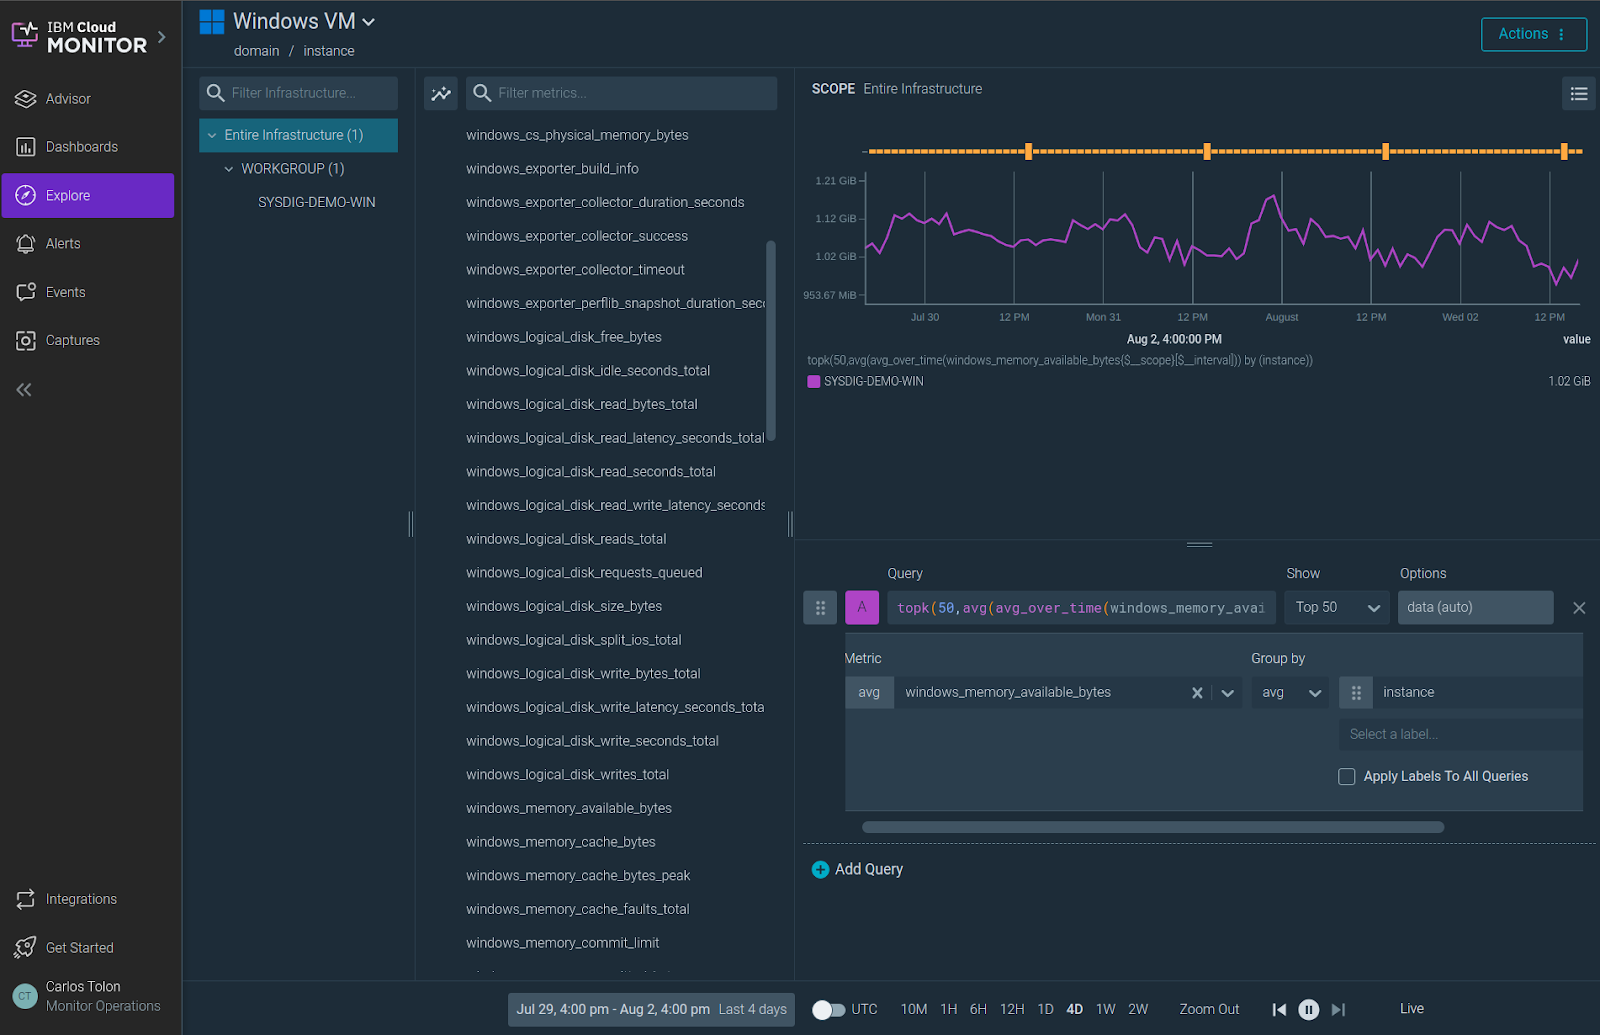
Get control over your Windows infrastructure from IBM Cloud Monitoring Explore with the available Windows views:
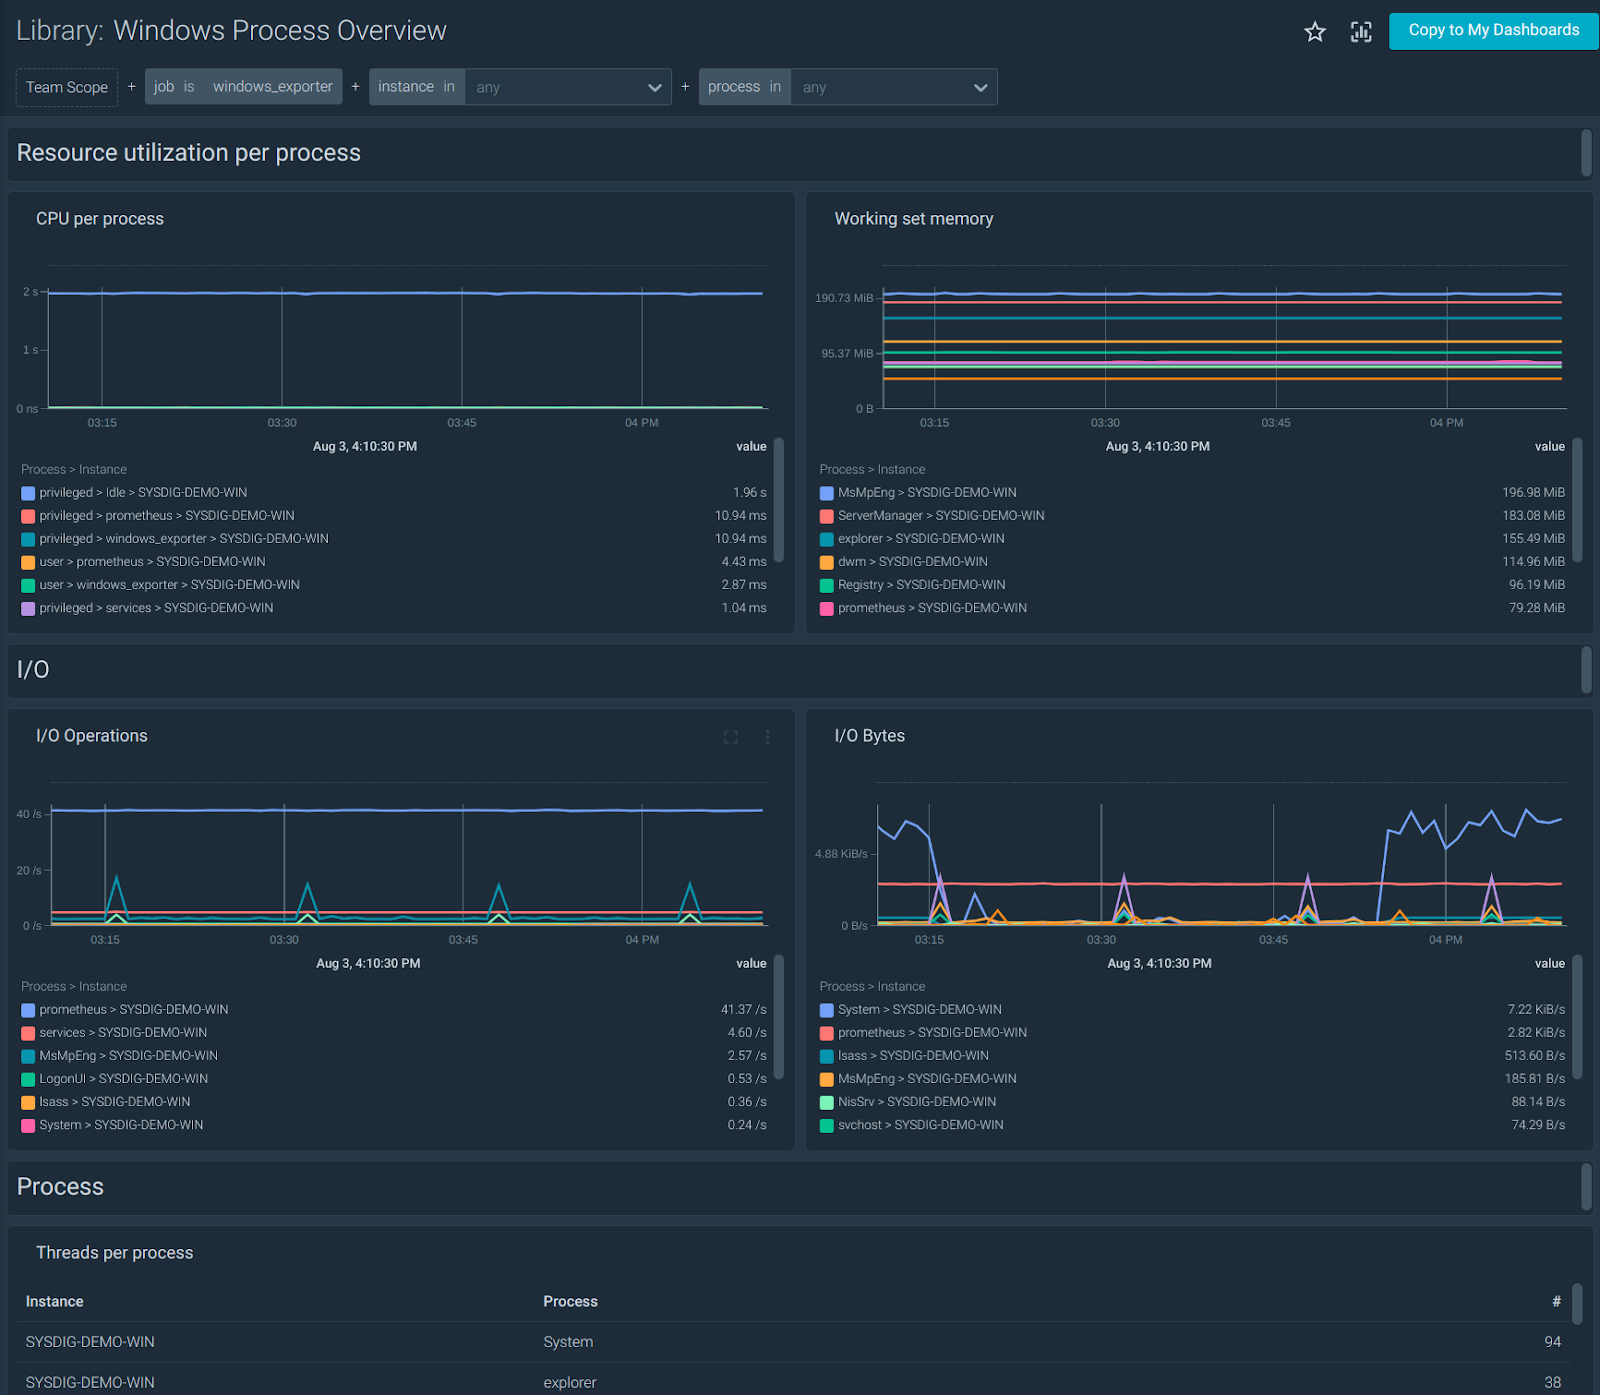
As soon as you start integrating your Windows servers, you can access the out-of-the-box dashboards under Dashboard Library / Application. The “Windows Host Overview” dashboard shows an overview of your hosts’ availability, capacity and CPU, memory, network and disk utilization.

Note: If you enable the “service” or “process” collector, the “Windows Services Overview” and “Windows Process Overview” dashboards will be available.
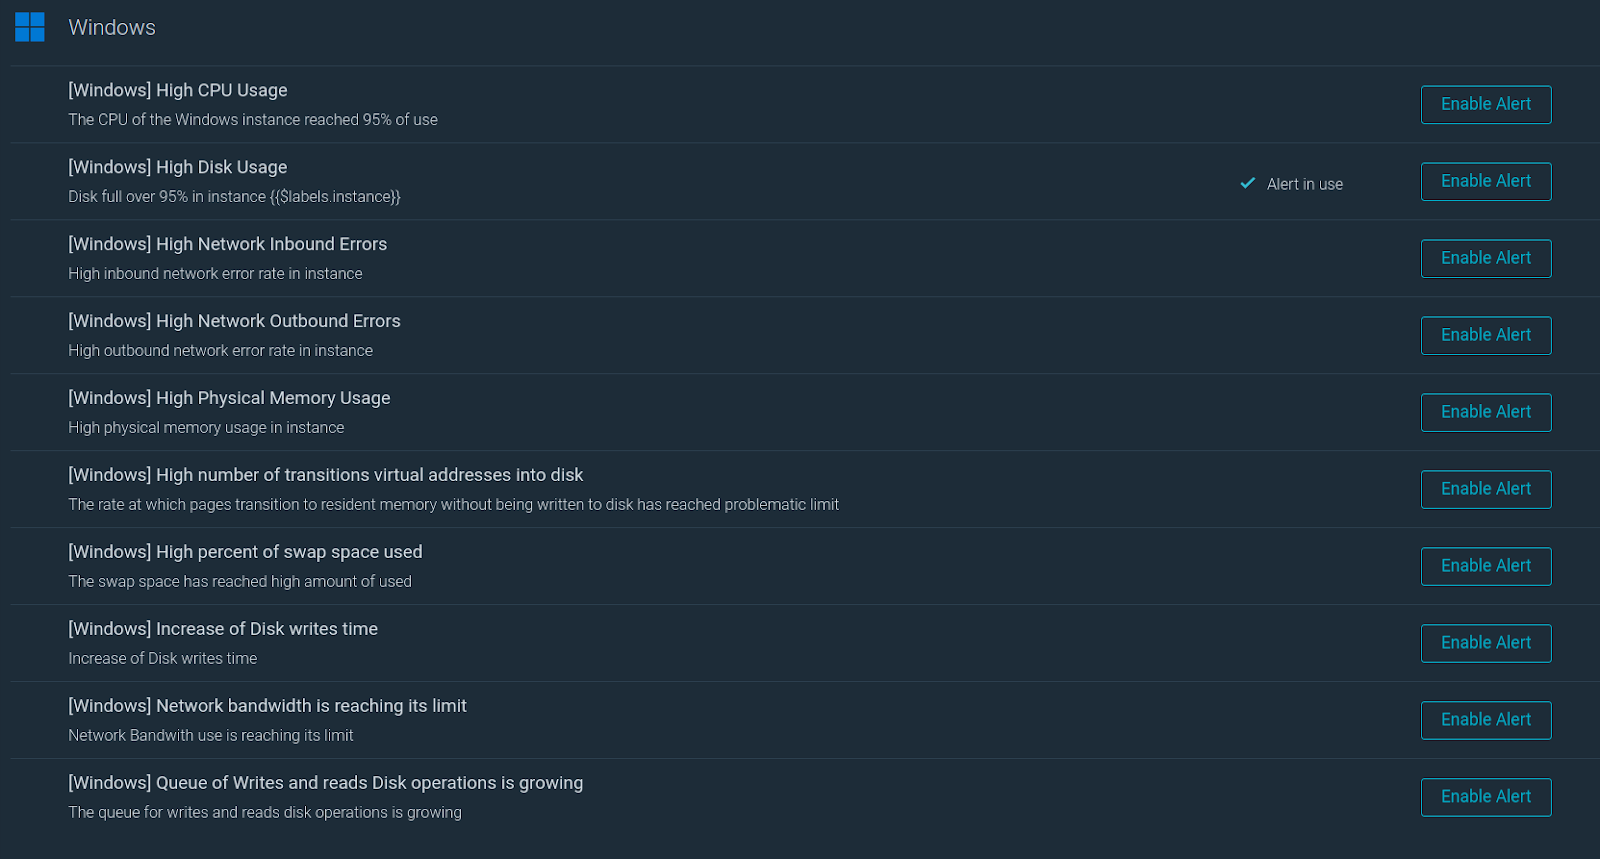
In addition to the out-of-the-box dashboards, IBM Cloud Monitoring provides Windows Alert templates in the Alerts Library for different scenarios. These templates can be used to configure the sending of alerts as soon as an undesired situation occurs.
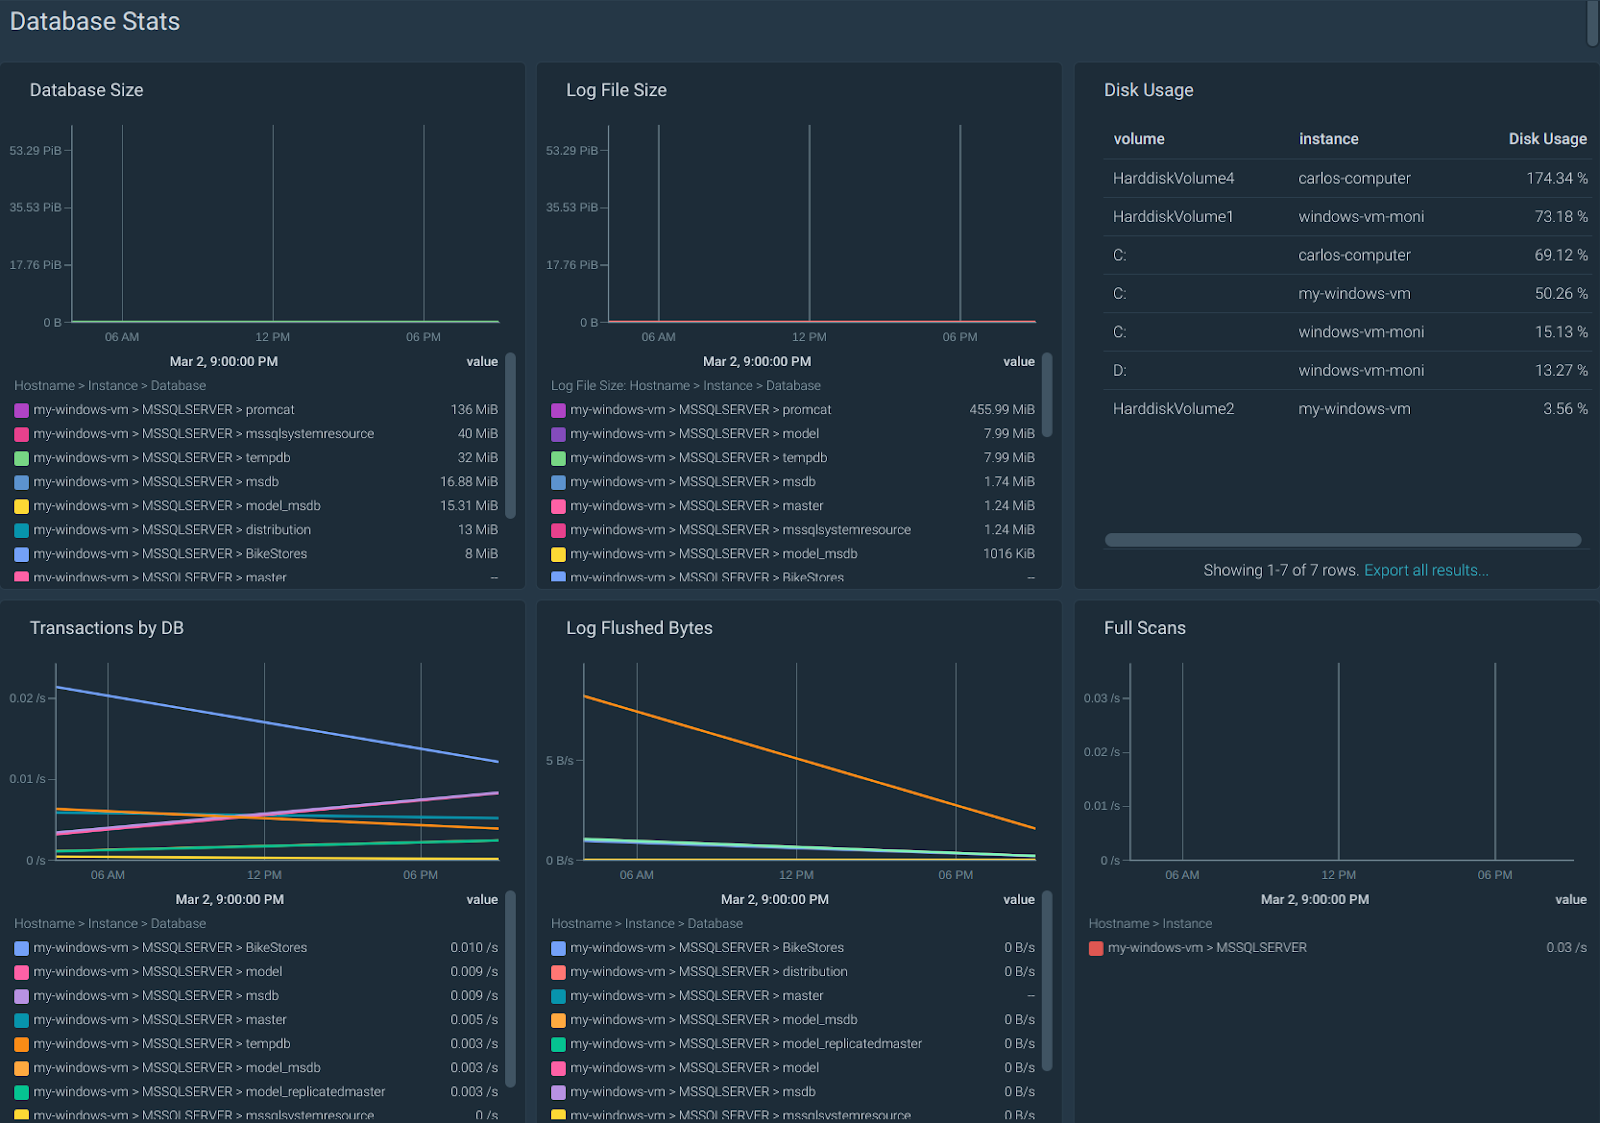
Benefit: MSSQL and IIS Integrations
Microsoft SQL Server and Internet Information Services (IIS) are both frequent services on Windows servers. These services play a vital role in supporting production-grade business applications, requiring comprehensive and meticulous monitoring.
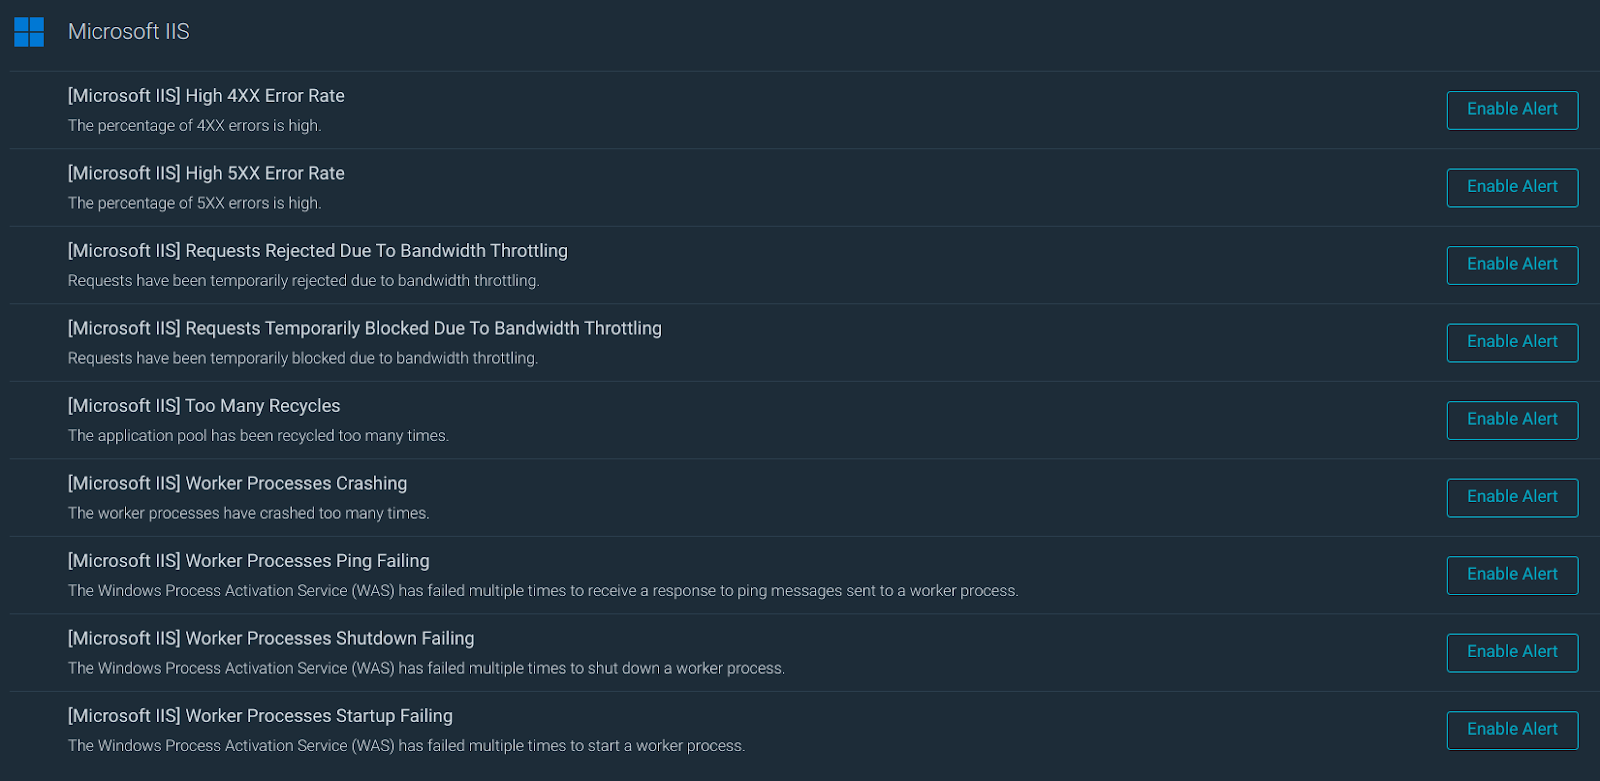
IBM Cloud Monitoring offers enhanced monitoring capabilities for Microsoft SQL Server and Internet Information Services (IIS). These functionalities can be accessed by enabling the corresponding collectors in the Windows installer.
There are over ten different Alert templates and three out-of-the-box dashboards that come ready to use for these services in IBM Cloud Monitoring. So, you'll have plenty of options to choose from!
Conclusion
The new IBM Cloud Monitoring Windows Prometheus bundle simplifies and improves the installation process. By simply deploying the Windows installer across all your systems, you can effortlessly access the full power of IBM Cloud Monitoring, enabling you to monitor, troubleshoot, and optimize your entire infrastructure.
Whether it's your Windows environment, Linux hosts or Kubernetes and OpenShift setups, IBM Cloud Monitoring empowers you to take control of your whole infrastructure from a single pane of glass.
If you want to learn more about how IBM Cloud Monitoring can help with virtual machines and Windows monitoring and troubleshooting, visit the IBM Cloud catalog for IBM Cloud Monitoring and start your 30-days free instance. You will be up and running in minutes!