IBM Developer for z/OS Code Coverage: You need it for assembler
As companies move to using a DevOps pipeline to meet the needs for continuous integration and continuous delivery demanded by customers, the use of tools and approaches for automated testing of applications increases. The question then becomes:
Is your testing coverage good enough to ensure that you are delivering quality solutions? There are several techniques that can be used to increase your confidence. In this blog I discuss the use of Code Coverage in an automated testing pipeline. With Code Coverage you can see what lines of codes are executed from your automated testing. While code coverage isn’t the complete answer, it provides an excellent baseline to understand your testing quality.
While most business applications today are written in Java, COBOL, PL/1, there is still a lot of Assembler around that performs critical business operations.
Can Assembler, long considered an “archaic” language can be part of this automated pipeline? The answer is a resounding
YES. You can’t afford
not to validate that your Assembler applications are meeting your quality criteria.
In this blog I am going to describe how to capture Code Coverage for an Assembler application using IBM Developer for z/OS 14.2 and IBM Debug for z/OS 14.2.
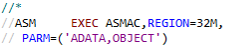
PreparationAssembling your applicationThe only requirement is to generate SYSADATA information from your assembly. When the ADATA option is specified, HLASM collects associated data and writes it to the associated data file. You define the associated data file with the
SYSADATA DDNAME on z/OS. Here is an example taken from a JCL for how to specify that option:
Next, specify where to save the ADATA file using SYSADATA DDNAME
 Creating the EQALANGX file
The EQALANGX file is a file that contains the debug data needed for a debug session as well as Code Coverage data capture session. This file is created by running the EQALANGX program, which is shipped as part of what is called the Common Component. It is in IPV.SIPVMODA. It is the same as the IDILANGX alias that IBM Fault Analyzer uses and the CAZLANGX alias that IBM Application Performance Analyzer uses. IPVLANGX extracts information from the SYSADATA file that you created in the assembler step and creates a second file with that information in a format that is more convenient for debug data retrieval. The following is a snippet of the JCL use to create the EQALANGX file.
 Setup for capturing Code Coverage
The steps in setting up for code coverage capture are similar to the ones needed for debugging the application. The main difference is that when capturing code coverage, the debugger runs in unattended mode until the application terminates and the code coverage is captured.
The steps described here are for capturing code coverage for a Non-LE Assembler application, that is, it runs without a runtime library like Language Environment. With a few exceptions most assembler applications are this way.
How to tell the debugger to capture code coverageI’ll start with the following snippet to make it easy to describe each parameter in the invocation of the debugger:

To debug an Assembler program that does not run under the control of Language Environment®, it is necessary to use the z/OS® Debugger program EQANMDBG to start z/OS Debugger. This apply to capturing code coverage as well. EQANMDBG is a program “stub” that takes the name of the main program, in the example above the main program is BAS1 and read the runtime options specified in the step. Let me expand on the JCL statement above:
- EQANMDBG: Stub program provided by the debugger to launch the assembler main program
- Make sure that the z/OS Debugger SEQAMOD and SEQABMOD libraries are in the load module search path.
- BAS1: The main assembler main program
- TEST: The test runtime option
- Error: Determines what high-level language conditions raised by your program cause z/OS Debugger to gain control of your program
- CMDS: Determines which primary commands file is used as the initial source of commands. This is described in more detail below
- PROMPT: Determines whether an initial commands list is unconditionally run during program initialization. PROMPT indicates to start code coverage at the start of the job.
- DBMDT&TSFANAY:*: Specifies the session parameter and a file that you can use to specify default settings for your debugging environment, such as customizing the settings on the z/OS Debugger Profile panel. DBMDT indicates that for this session to use the Debug Manager (DBMDT) and the second string after & is the USERID of the client that authenticated with IDz RSE.
- ENVAR: The environment variable EQA_STARTUP_KEY is used to tell the debugger to capture code coverage
- PARM1: To enable code coverage, specify CC.
- PARM2: Name of the program, usually the main module used to start the application. If not specified it defaults to all programs in the job or transaction. Here you could have specified BAS1 as the program name if you only wanted code coverage for this program. Not specifying a name default to all programs in the job or transaction.
- PARM3: For example: EQA_STARTUP_KEY=CC,,testid=test01,savesource=trueenables code coverage, assigns the results to testcase test01 and save source with the results
How to tell the debugger where to find the EQALANGX fileIn order for the debugger to find the EQALANGX file, you need to specify a PDS concatenation to search, specified by the
EQADEBUG DD name. Each CSECT will have a correspondingly named PDS member. Here is an example:
 Loading the debug information
For languages like COBOL and PL/1, the debugger can scan the load module and figure out whether the program(s) are application programs and that debug information is available for a debug session. That is not the case with Assembler programs since there isn’t a standard signature area in the load module to find this information. The debugger instead lets the developer specify whether a program in the job or transaction is of interest using the
LDD debug command.
LDD is short for
load debug data. Further explanation can be found here:
https://www.ibm.com/support/knowledgecenter/en/SSQ2R2_14.2.0/com.ibm.debugtool.doc/rmdita/tlddforassemblerandnonlecobol.htmlHow to pass the LDD command to the debugger As I mentioned before, the second parameter in the TEST runtime option is provided specifying a file with debug commands for the debugger to act on.

In the following example I specify the LDD commands that are needed to capture code coverage for the programs in this job directly inline.

The application that I am using includes three CSECTS: BAS1, BAS2, and BAS3 and I want code coverage for all three CSECTS.
Getting Code CoverageNow, I am ready to submit the job and capture the code coverage for this Assembler application

Now, after the run IDz provides you with a consolidated report view of the code coverage results

You can adjust the threshold to limit the entries . In the example below the threshold is 80%

After applying the threshold, you now just get overall summary statistics since there are no entries below or equal to the threshold

Now, I am going to set the threshold to Off, and select a display of the entries by modules rather than files

In the top right corner is the Export pull down. You can export the results to PDF, SonarQube, and CCzip.

CCzip allows you to use the new Code Coverage as a Service (CCaaS) feature. All the code coverage data can now be accessed using CCAPI. For more information in the following blog tells you more about it:
https://developer.ibm.com/mainframe/2019/09/11/introducing-code-coverage-as-a-service-ccaas/Navigating the Code Coverage information is very intuitive with IDz as you can see below. Let’s start from the Code Coverage by FILE view

Expanding one of the entries in the view you can see the CSECTS included in the file. In the example it is just one BAS1

Double clicking on the BAS1 entry displays the corresponding assembler listing annotated with colors indicating what instructions were executed (green) and which ones are not (red)

The following blog also contains additional information regarding the navigation of the code coverage data results
https://developer.ibm.com/mainframe/2018/12/07/the-new-code-coverage-web-reports-in-idz-14-1-5/In this blog I have discussed the capture of code coverage with IDz which implies having a client available to drive the data capture. You can also capture code coverage without having to start IDz. This other method is named Headless Code Coverage which is more appropriate to be part of a DevOps pipeline. I am also including a link to a blog that describes the Headless Code Coverage in more detail.
https://developer.ibm.com/mainframe/2018/03/13/capture-code-coverage-without-starting-idz/I hope you find this blog helpful and that it encourages you to take advantage for this important capability for Assembler applications.
Francisco M. Anaya
Senior Architect for Application Delivery Foundation for z/OS