|
QRadar contains functionality that allows it to accumulate data with a series of pre-defined searches called "Global Views" which can be quickly retrieved. This can be a valuable capability to optimize your QRadar system to provide necessary data to the user.
The Global Views are currently used for the reporting engine, anomaly detection engine, the traditional dashboards and the log and flow viewers.
There are some limitations in how the data can be accumulated, as the accumulation engine does not understand all the potential combinations of AQL, thus it cannot do sub queries, session by, etc. The limits to its capabilities are the same as the traditional QRadar Log and Flow viewer experiences. Also, you cannot create a Global View using the API, they must be created in the traditional QRadar interface.
Data, once accumulated, can be queried using AQL and used for other analytics or reports that the user needs to execute frequently. In this blog I will use a real-world example that many of our users face which involves pulling statistics about the volume of events they are receiving into their system.
Building Per Log Source Average EPS Using AQL & The Accumulator
Out of the box QRadar does not maintain a per log source average EPS over an extended period of time, but it can be easily built using AQL and leveraging the accumulator.
To start this process, we will define the data we want to accumulate which is the number of events per log source per interval (60 seconds).
Navigate to the log viewer and craft an AQL statement similar to this:
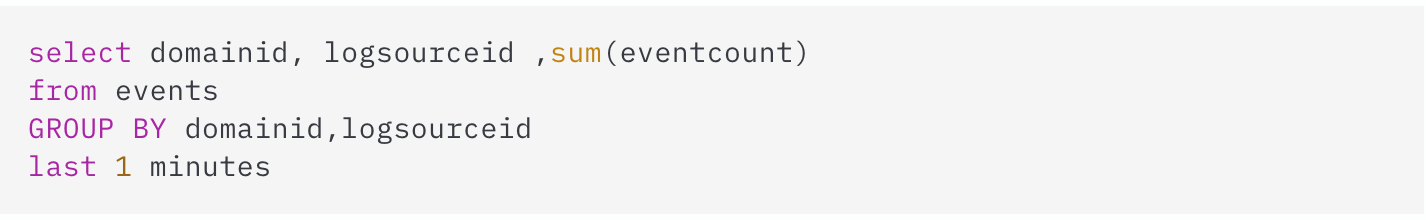 |
Execute the search and when happy with the results save it. The name of the search is going to be significant, for this example assume it was named "Event Count by Log Source"
Once we have saved the search, change the graph at the top of the viewer to be a time series chart displaying "SUM(eventcount)", then click 'Capture Time Series Data' and save the value to begin accumulation of data.
NOTE: Data is only accumulated from the time the searched is saved; the system does not retroactively process the data already collected in the system
Data will now be accumulated for this search in a global view, you can find out more about accumulators and global views here
Now that we have data accumulating, we can work on retrieving it, to do this we will use AQL to search against the global view we created, this cannot be done in the log viewer of the traditional QRadar UI, however it can be done in the Analyst Workflow experience and API. Our search will start out looking like this:
The value in the GLOBALVIEW function is the exact name of the saved search, in this case we saved our search as "Event Count by Log Source", to query the available fields from the view you could issue the following query:
Any of the fields returned are candidates for usage in AQL statements, so we could apply filters for log source ID and timeframe or apply math to plot these values over time. If we wanted the average per minute EPS per log source over 30 days, we would divide our total event count by the number of seconds in 30 days like this:
This will give us the average EPS of the log sources over the last 30 days, though it is important to note that the EPS values are going to be very smoothed out- spikes in traffic rates are not going to be reflected in the results.
Now that we have this query, we need to decide how we are going to use it. We can use some of the following techniques to make use of it:
Running our query across an accumulated view allows QRadar to quickly search through pre-calculated data. Without the accumulated data we would need to query directly against the raw events which would require that the system would need to read in ALL the events to count the values. This could be billions of events for the timeframe of the report which would be very IO intensive. The accumulated view gives us a per minute count of the events in one place, this allows us to easily count the numbers as opposed to opening the raw events directly.
This technique can be used for a number of queries which need to handle large volumes of data that need to be counted or otherwise aggregated.
|