IBM Cloud Paks Applied to a Real-Life Scenario: Cognitive Insurance Claims (Part 2)
By: Michele Chilanti & Sundari Voruganti
In Part 1 of this blog series we illustrated how a combination of IBM Cloud Paks support the creation and deployment of a sophisticated claim processing solution. Here is the architecture of the solution for your review.

In this blog we discuss the operational aspects of the cognitive insurance claims solution. To ensure a satisfactory SLA and prevent outages, we used IBM Instana, IBM Turbonomic, and IBM Cloud Pak for Watson AIOps to monitor and manage our Cognitive Claims application.
We used IBM Instana to gain insights into the various components and IBM Turbonomic to obtain operational recommendations about changes that might be beneficial for the health of the deployment.
We also used IBM Cloud Pak for Watson AIOps to intelligently monitor application logs, and actively spot anomalies in the logs, which could be indicative of issues in the application.
Gaining Observability with IBM Instana
Monitoring is the first step to managing your system. Instana provides out-of-the-box visibility for a large variety of technologies, including Java-based applications and databases. Getting started is as easy as registering the Openshift cluster with an Instana instance – there are various ways to do that, as described here.
Once your cluster is visible on Instana, you immediately gain insights into the infrastructural components (like nodes, pods, containers, and more). In order to get visibility into applications, you can define an application in Instana in many different ways: the simplest method is to define it as a collection of services:
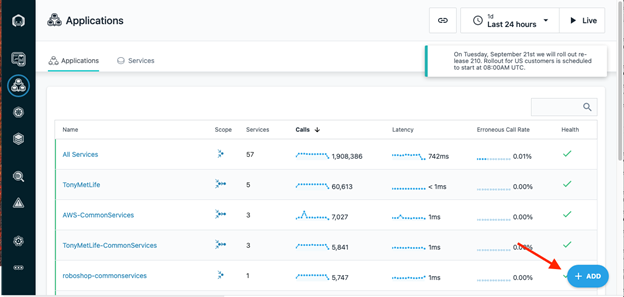
- From the Instana Application view, you can click + Add as shown below:
2. Then, click
New Application Perspective and select
Services or Endpoints.
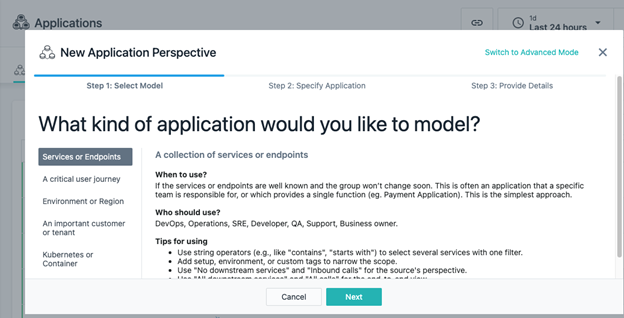
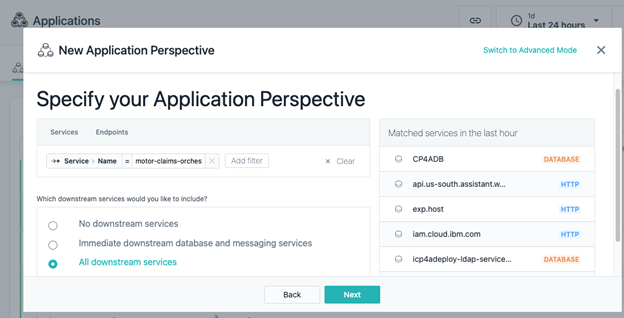
3. Click
Next. Now, specify a filter on the service name. Our Cognitive Claims solution includes a “gateway” micro-service called the “orchestrator”, which mediates the interactions between the mobile app and the back-end services. We picked that as the initial filter and specified that we want to include all the downstream services. Instana automatically includes those services in the application definition, as shown below:
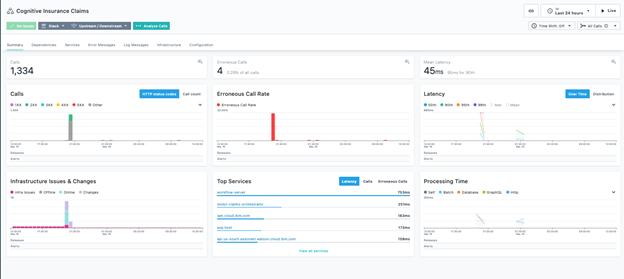
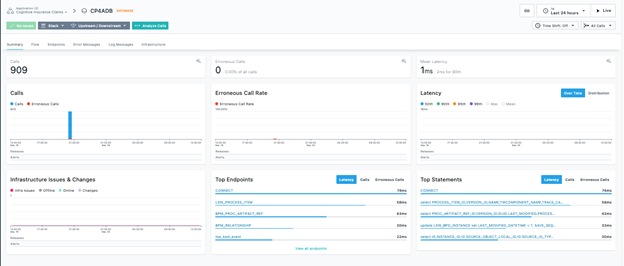
That’s really all you need to do to define an application in Instana. Once the definition is done, you can obtain all kinds of metrics and insights on your application – as displayed in the dashboard below:
You can also discover and observe the topology and dependencies of your application, by switching to the Dependencies tab:

From this diagram, you can drill down to the individual services. For example, you can click on the CP4DB element on the right hand side (that’s a database used by the IBM Cloud Pak for Automation) and select Go to dashboard. You’ll be able to gain all kinds of insights about that database usage, performance, and availability, including the most popular SQL statements executed against it:
Notice that we didn’t have to add any specific instrumentation to most of the services that appeared in the dependencies view, including the database shown above – all that visibility is gained just by adding the Instana agent to your cluster.
However, some services do require instrumentation – in particular, NodeJS microservices. The “orchestrator” service we mentioned above is one of those. If you are interested about the small changes that are needed to make this service observable, you can read this blog:
Maintaining Operational Efficiency with IBM Turbonomic
Observability is of paramount importance – but it is sometimes hard to make sense of a lot of disparate information and derive a set of actions that can improve the stability of your environment or optimize your cloud spending. This is exactly what IBM Turbonomic can do for you.
Turbonomic can work with or without Instana. If you only register your cluster with Turbonomic, you will obtain recommendations about optimizing your infrastructure only – suggestions on scaling up or down pods, adding nodes, and so on. By combining Instana and Turbonomic, those recommendations can be tailored to optimizing specific applications.
Setting up Turbonomic is simple: you need to install Kubeturbo on your cluster (see https://github.com/turbonomic/kubeturbo/wiki). Then you need to register your Instana instance with Turbonomic.
After "a while" Turbonomic starts providing recommendations. The power of Turbonomic is that it won’t only provide “point-in-time” recommendations: it will in fact assess the behavior of your environment over time, and provide advice based on longer term trends. The recommended actions may avoid future crises, or help reducing resource allocation – and cost – if your application is overprovisioned.
Here’s what we found out once Turbonomic was configured to monitor our Cognitive Insurance Claims environment:
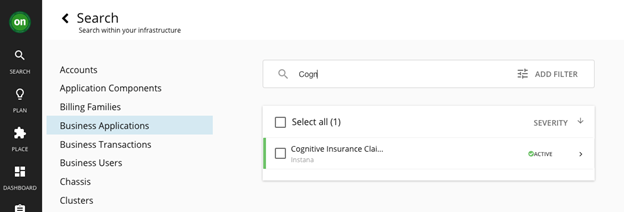
- Once you log in to Turbonomic, click Search and then pick Business Applications. Filter by your application name (in our case, Cognitive Insurance Claims):
- Click on the application of interest. You will be displayed a component diagram that represents the structure and dependencies of the application – highlighting which components need attention. Notice the recommended actions too:
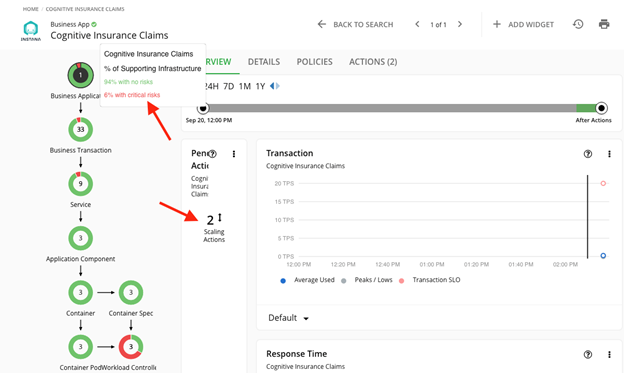
- If you click on the actions, you can see the details. In this case, Turbonomic detected that a couple of IBM Cloud Pak for Business Automation components could use some additional memory – they need to scale up:
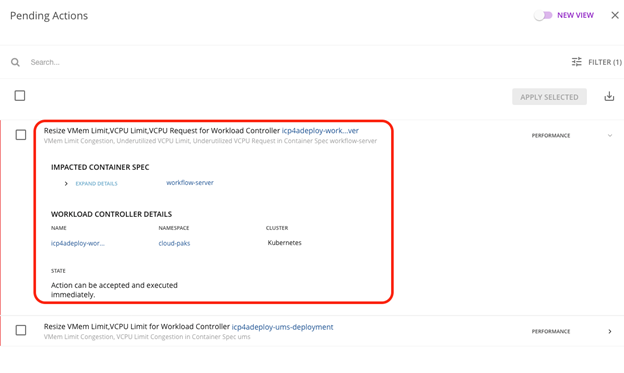
These actions can then be implemented appropriately. For example, if Turbonomic recommends changes to services you fully control, you could let Turbonomic itself implement those actions. In this case, since the components are controlled by a cloud pak controller, it would be more appropriate making those changes to the corresponding Custom Resource.
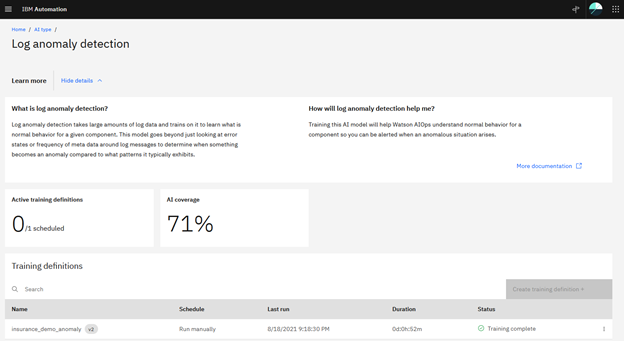
Log anomaly detection with IBM Cloud Pak for Watson AIOps
IBM Cloud Pak for Watson AIOps provides a wide range of operational capabilities that can dramatically transform and improve how your IT Ops organization works. Here we describe how we used one of the most recent additions to the plethora of functions of IBM Cloud Pak for AIOPs – log anomaly detection. This capability relies on machine learning: training of the models occurs by analyzing a representative sample of the solution’s logs. The models are then deployed and used to analyze the actual logs in near real time. If anomalies are spotted, alerts are generated.
The following diagram describes the high level flow:
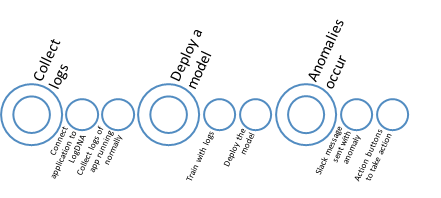
Since our solution is deployed on IBM Cloud, we used LogDNA to aggregate the logs produced by the various components of the Cognitive Claims solution and we hooked up IBM Cloud Pak for Watson AIOps to LogDNA to analyze the logs:
- First we ensured that we collected enough logs of the application running “normally”, that is, without errors.
- Then, we used IBM Cloud Pak for Watson AIOps to train a model using the log data collected for at least 7 days.
As you can see, the model is deployed, so when there is an error (anomaly) in the microservices of the application, or a pod dies, a slack message is sent.
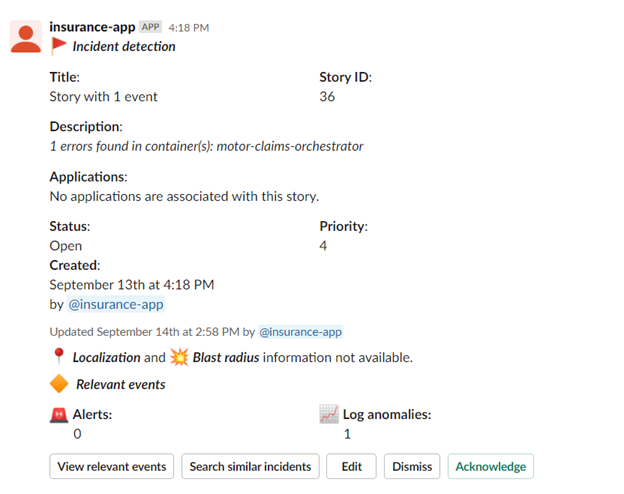
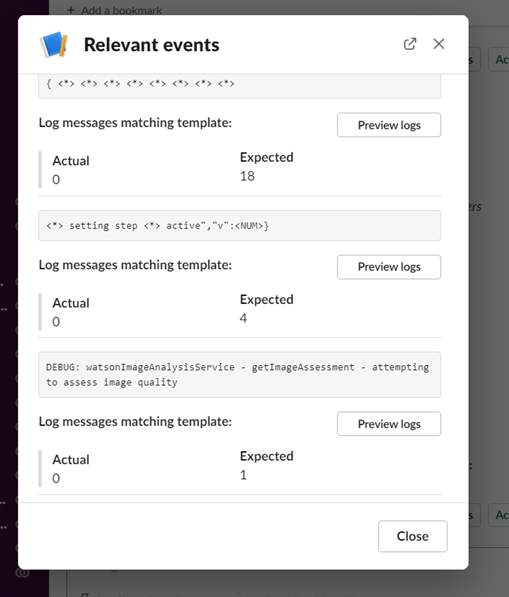
This allows the SRE team to deal with the anomalies.
In this two part blog series, we demonstrated how the IBM Cloud Paks can be used to build a real-life industry solution and monitor and manage it.
#CloudPakforBusinessAutomation#cloudpak#CloudPak4Data#cloudpak4integration#Instana#turbonomic