DMN Rules monitoring - IBM Business Automation Manager Open EditionsGoal of the postIn this post I want to address the topic of measuring the metrics applicable to the rules in DMN notation based on the Kogito framework.
We will see some rules and their logical structure and complexity of elaboration.
Below we will see how to configure a Kogito application for metrics management, its deployment in the Openshift environment.
For the measurement of the metrics we will use Prometheus in an extremely simple way.
We will then see for each rule the various payloads used to differentiate the usage and consumption counters of CPU/RAM resources.
Finally, a mention of the always complex and not easily resolved issue of the estimation and sizing of solutions based on DMN rules in containerized Kogito technology.
Scenario descriptionThe scenario involves the use of an application that exposes a series of rules in DMN notation, some rules are extremely simple, one in particular of medium complexity.
The deployment of the application is in OpenShift environment; the use of the services involves interaction via REST services.
To generate the workload, tools such as 'Apache Bench' and the simple but very powerful 'curl' are used.
The use of 'curl' was necessary because the current version of 'Apache Bench' does not support HTTP/1.1 and therefore cannot correctly manage the transmission of large payloads in 'chunked transfer-encoding' mode.
For metrics monitoring I chose to use Prometheus because it is simple and ready to use (it was already present in my OpenShift clusters).
Operating environmentThe operating environment is OpenShift 4.10 and the runtime of the DMN rules is obviously 'IBM Business Automation Manager Open Editions'.
Application descriptionThe containerized application displays some DMN rules based on Kogito/Quarkus, the rules are of various nature, some extremely simple (Is Adult ?), others with one or more Decision Services based on 3/4 rules, one based on a case of real use which, based on the input payload and its possible combinations, can consume a lot of CPU and a large amount of memory.
The application 'MyKogitoPerformanceDm' is available on my public GitHub account at the link https://github.com/marcoantonioni/IBM-BAM-OE-demos
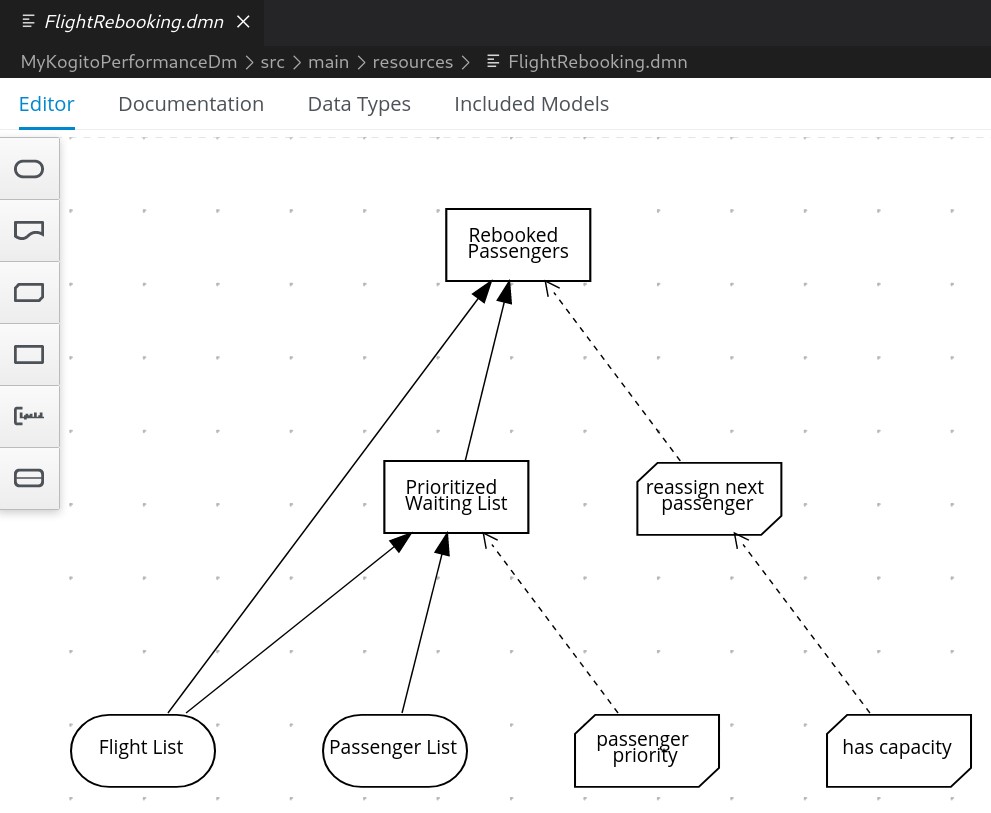
The most interesting and resource intensive rule is the 'Flight Rebooking (FlightRebooking.dmn)'.
The 'FlightRebooking' rule is used to reallocate the passengers of a canceled flight, as input to the rule the canceled flight is sent (with its basic information from/to/flight number/date/etc...) and the list of passengers who are to be booked on other equivalent flights; the reassignment will take place with priority defined by customer loyalty (status [golde|silver|bronze] and miles already flown).
For the creation of the test payloads for complex scenarios I used a 'fake data' generation tool; you can find several for free use by searching on your favorite search engine using the key 'fake data generator'.
Kogito application configuration for metricsFor the generation of runtime metrics I used the following configuration in the pom.xml file of the application
<dependency> <groupId>org.kie.kogito</groupId> <artifactId>monitoring-prometheus-quarkus-addon</artifactId></dependency>from RH link
https://access.redhat.com/documentation/en-us/red_hat_decision_manager/7.13/html/getting_started_with_red_hat_build_of_kogito_in_red_hat_decision_manager/con-rhpam-kogito-operator-with-prometheus-and-grafana_deploying-kogito-microservices-on-openshiftApplication deployment typeFor the containerized deployment of the application I deployed the following CR that you can repeat with a simple cut&paste if you have the necessary grants on your OpenShift cluster.
Kogito Build CRapiVersion: rhpam.kiegroup.org/v1kind: KogitoBuildmetadata: name: my-kogito-performance-dm namespace: my-performance-dmspec: gitSource: contextDir: MyKogitoPerformanceDm uri: 'https://github.com/marcoantonioni/IBM-BAM-OE-demos' type: RemoteSourceKogito Runtime CRapiVersion: rhpam.kiegroup.org/v1kind: KogitoRuntimemetadata: name: my-kogito-performance-dm namespace: my-performance-dmspec: image: >- image-registry.openshift-image-registry.svc:5000/my-performance-dm/my-kogito-performance-dm:latest replicas: 1 resources: limits: cpu: '1' requests: cpu: '0.5' runtime: quarkusThe application build provides the S2I mode with the sources present on the GitHub repository.
You will have to wait a few minutes for the application container build operation and related image creation within your OCP cluster.
For more infos about Kogito Operator deployment (OperatorGroup and Subscription) see
https://community.ibm.com/community/user/automation/blogs/marco-antonioni/2022/11/05/use-ibm-kogito-operator-to-deploy-pamdm-applicatioRule trigger and payloadFor triggering the rules as well as using the 'curl' tool from your desktop for a single test you can use 'Apache Bench'.
Here are some examples for the two tools.
'curl'URL=http://...your-fqdn.../FlightRebookingcurl -s -X POST -H 'accept: application/json' -H 'Content-Type: application/json' -d @./payload-big ${URL}'ab' (Apache Bench)URL=http://...your-fqdn.../FlightRebookingab -c 1 -n 1 -k -T "application/json" -p ./payload-small ${URL}Monitoring toolFor monitoring via Prometheus the following configurations were performed
Service Monitor CRapiVersion: monitoring.coreos.com/v1kind: ServiceMonitormetadata: labels: app: monitor-my-kogito-performance-dm name: monitor-my-kogito-performance-dm namespace: my-performance-dmspec: endpoints: - interval: 15s port: http targetPort: 8080 path: /q/metrics scheme: http namespaceSelector: matchNames: - my-performance-dm selector: matchLabels: app: my-kogito-performance-dmThis CR instructs Prometheus to monitor user applications defined in a specific namespace.
For global Prometheus configuration for 'user-defined projects' see link
https://docs.openshift.com/container-platform/4.10/monitoring/enabling-monitoring-for-user-defined-projects.htmlObserved metricsNow the most interesting part.
To run the following tests clone the repository
https://github.com/marcoantonioni/IBM-BAM-OE-demosand run the project
MyKogitoPerformanceDmLet's now focus on the metrics exposed by our test application.
First of all, let's run some tests locally on our desktop.
We start the application with the command '
quarkus dev', from a different shell we start the command
curl -s http://localhost:8080/q/metrics | grep MyKoNo metrics will be displayed as no invocation has ever triggered a rule yet.
We then execute the command to trigger the 'FlightRebooking' rule.
 curl -s -H 'accept: application/json' -H 'Content-Type: application/json' -X POST http://localhost:8080/FlightRebooking -d @./payload-small | jq .
For the content of the 'payload-small' file see the Resources section of this post.
Let's run the command once more
curl -s http://localhost:8080/q/metrics | grep FlightRebookingthis time 'grep' will filter among the various metrics also those related to the 'FlightRebooking' rule
api_execution_elapsed_seconds_max{artifactId="MyKogitoPerformanceDm",endpoint="FlightRebooking",version="1.0.0-SNAPSHOT",} 0.0api_execution_elapsed_seconds{artifactId="MyKogitoPerformanceDm",endpoint="FlightRebooking",version="1.0.0-SNAPSHOT",quantile="0.1",} 0.0api_execution_elapsed_seconds{artifactId="MyKogitoPerformanceDm",endpoint="FlightRebooking",version="1.0.0-SNAPSHOT",quantile="0.25",} 0.0api_execution_elapsed_seconds{artifactId="MyKogitoPerformanceDm",endpoint="FlightRebooking",version="1.0.0-SNAPSHOT",quantile="0.5",} 0.0api_execution_elapsed_seconds{artifactId="MyKogitoPerformanceDm",endpoint="FlightRebooking",version="1.0.0-SNAPSHOT",quantile="0.75",} 0.0api_execution_elapsed_seconds{artifactId="MyKogitoPerformanceDm",endpoint="FlightRebooking",version="1.0.0-SNAPSHOT",quantile="0.9",} 0.0api_execution_elapsed_seconds{artifactId="MyKogitoPerformanceDm",endpoint="FlightRebooking",version="1.0.0-SNAPSHOT",quantile="0.99",} 0.0api_execution_elapsed_seconds_count{artifactId="MyKogitoPerformanceDm",endpoint="FlightRebooking",version="1.0.0-SNAPSHOT",} 1.0api_execution_elapsed_seconds_sum{artifactId="MyKogitoPerformanceDm",endpoint="FlightRebooking",version="1.0.0-SNAPSHOT",} 0.038020706http_server_requests_seconds_count{method="POST",outcome="SUCCESS",status="200",uri="/FlightRebooking",} 1.0http_server_requests_seconds_sum{method="POST",outcome="SUCCESS",status="200",uri="/FlightRebooking",} 0.118602782http_server_requests_seconds_max{method="POST",outcome="SUCCESS",status="200",uri="/FlightRebooking",} 0.0api_http_response_code_total{artifactId="MyKogitoPerformanceDm",endpoint="FlightRebooking",identifier="200",version="1.0.0-SNAPSHOT",} 1.0The metrics related to the 'FlightRebooking' endpoint now appear.
We immediately notice the 'api_http_response_code_total' counter which has a value of 1.0, we only performed one request.
Then we notice the 'api_execution_elapsed_seconds' family of metrics which represent times with 'quantile', 'max', 'sum', 'count'.
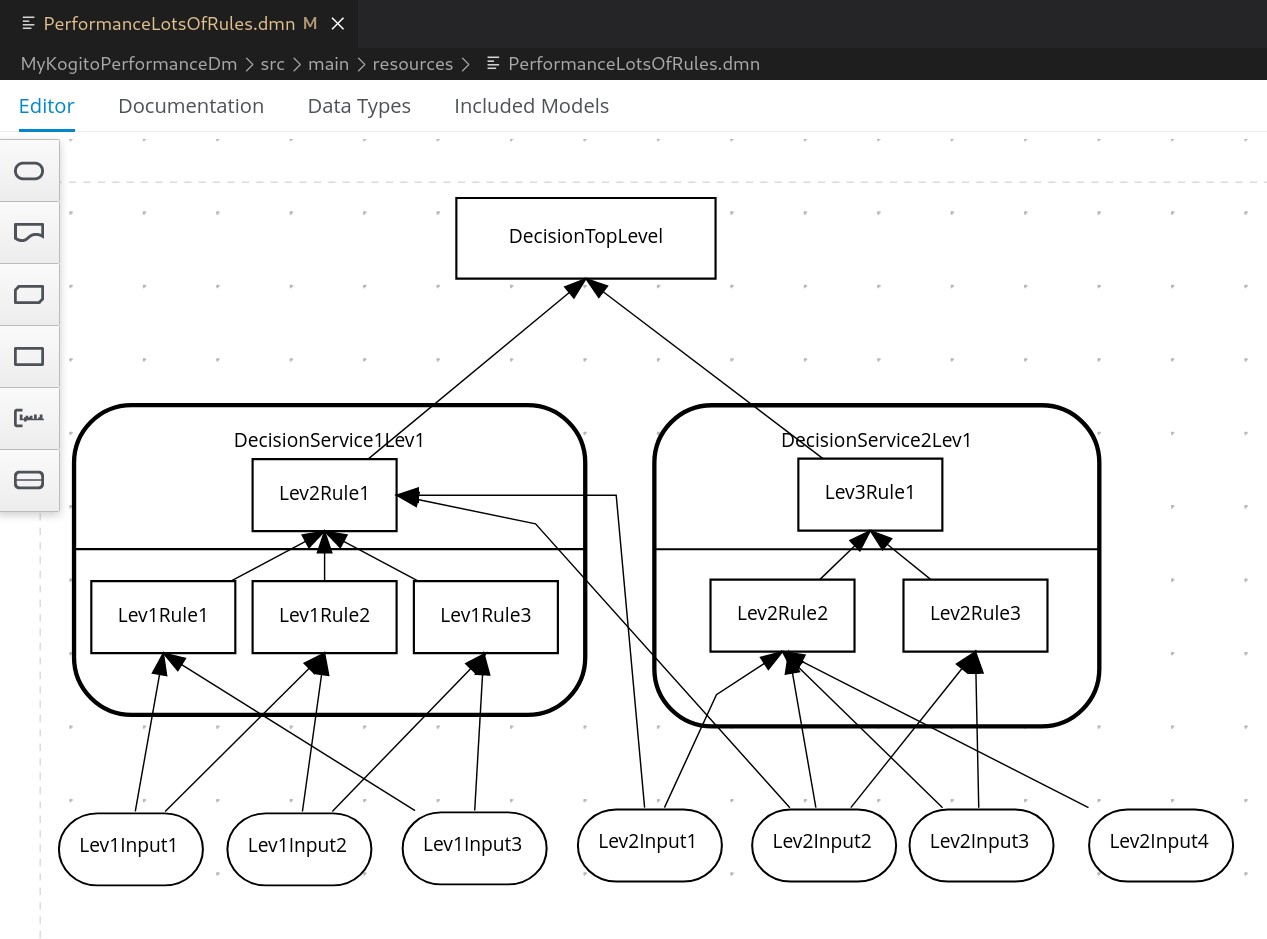
Let's now execute the 'PerformanceLotsOfRules' rule (non-sense rule...just to consumer resources)
with the command
curl -s -X POST http://localhost:8080/PerformanceLotsOfRules \ -H 'accept: application/json' \ -H 'Content-Type: application/json' \ -d '{ "Lev1Input1": true, "Lev1Input2": 5, "Lev1Input3": true, "Lev2Input1": "GOOD", "Lev2Input2": true, "Lev2Input3": 20, "Lev2Input4": "HIGH" }' | jq .Let's run the metrics read command again this time with filter on 'PerformanceLotsOfRules' metrics
curl -s http://localhost:8080/q/metrics | grep PerformanceLotsOfRules
In the result, in addition to the metrics typology already seen previously, we find
api_execution_elapsed_seconds_max{artifactId="MyKogitoPerformanceDm",endpoint="PerformanceLotsOfRules",version="1.0.0-SNAPSHOT",} 0.003576053api_execution_elapsed_seconds{artifactId="MyKogitoPerformanceDm",endpoint="PerformanceLotsOfRules",version="1.0.0-SNAPSHOT",quantile="0.1",} 0.001179648api_execution_elapsed_seconds{artifactId="MyKogitoPerformanceDm",endpoint="PerformanceLotsOfRules",version="1.0.0-SNAPSHOT",quantile="0.25",} 0.001179648api_execution_elapsed_seconds{artifactId="MyKogitoPerformanceDm",endpoint="PerformanceLotsOfRules",version="1.0.0-SNAPSHOT",quantile="0.5",} 0.001179648api_execution_elapsed_seconds{artifactId="MyKogitoPerformanceDm",endpoint="PerformanceLotsOfRules",version="1.0.0-SNAPSHOT",quantile="0.75",} 0.00360448api_execution_elapsed_seconds{artifactId="MyKogitoPerformanceDm",endpoint="PerformanceLotsOfRules",version="1.0.0-SNAPSHOT",quantile="0.9",} 0.00360448api_execution_elapsed_seconds{artifactId="MyKogitoPerformanceDm",endpoint="PerformanceLotsOfRules",version="1.0.0-SNAPSHOT",quantile="0.99",} 0.00360448api_execution_elapsed_seconds_count{artifactId="MyKogitoPerformanceDm",endpoint="PerformanceLotsOfRules",version="1.0.0-SNAPSHOT",} 2.0api_execution_elapsed_seconds_sum{artifactId="MyKogitoPerformanceDm",endpoint="PerformanceLotsOfRules",version="1.0.0-SNAPSHOT",} 0.004783911http_server_requests_seconds_count{method="POST",outcome="SUCCESS",status="200",uri="/PerformanceLotsOfRules",} 2.0http_server_requests_seconds_sum{method="POST",outcome="SUCCESS",status="200",uri="/PerformanceLotsOfRules",} 0.022093238http_server_requests_seconds_max{method="POST",outcome="SUCCESS",status="200",uri="/PerformanceLotsOfRules",} 0.014688685api_http_response_code_total{artifactId="MyKogitoPerformanceDm",endpoint="PerformanceLotsOfRules",identifier="200",version="1.0.0-SNAPSHOT",} 2.0boolean_dmn_result_total{artifactId="MyKogitoPerformanceDm",decision="Lev1Rule2",endpoint="PerformanceLotsOfRules",identifier="false",version="1.0.0-SNAPSHOT",} 2.0boolean_dmn_result_total{artifactId="MyKogitoPerformanceDm",decision="Lev3Rule1",endpoint="PerformanceLotsOfRules",identifier="true",version="1.0.0-SNAPSHOT",} 2.0boolean_dmn_result_total{artifactId="MyKogitoPerformanceDm",decision="Lev1Rule1",endpoint="PerformanceLotsOfRules",identifier="true",version="1.0.0-SNAPSHOT",} 2.0boolean_dmn_result_total{artifactId="MyKogitoPerformanceDm",decision="Lev2Rule1",endpoint="PerformanceLotsOfRules",identifier="false",version="1.0.0-SNAPSHOT",} 2.0boolean_dmn_result_total{artifactId="MyKogitoPerformanceDm",decision="Lev2Rule2",endpoint="PerformanceLotsOfRules",identifier="false",version="1.0.0-SNAPSHOT",} 2.0boolean_dmn_result_total{artifactId="MyKogitoPerformanceDm",decision="Lev2Rule3",endpoint="PerformanceLotsOfRules",identifier="false",version="1.0.0-SNAPSHOT",} 2.0boolean_dmn_result_total{artifactId="MyKogitoPerformanceDm",decision="DecisionTopLevel",endpoint="PerformanceLotsOfRules",identifier="false",version="1.0.0-SNAPSHOT",} 2.0boolean_dmn_result_total{artifactId="MyKogitoPerformanceDm",decision="Lev1Rule3",endpoint="PerformanceLotsOfRules",identifier="false",version="1.0.0-SNAPSHOT",} 2.0among these appear some metrics that indicate the counters relating to the number of triggers of the individual rules in combination with the possible results, in this case the 'decisions' are present once with the 'identifier' valued 'true' and once valued 'false' .
curl -s http://localhost:8080/q/metrics | grep PerformanceLotsOfRules | grep decision | sortboolean_dmn_result_total{artifactId="MyKogitoPerformanceDm",decision="DecisionTopLevel",endpoint="PerformanceLotsOfRules",identifier="false",version="1.0.0-SNAPSHOT",} 2.0boolean_dmn_result_total{artifactId="MyKogitoPerformanceDm",decision="Lev1Rule1",endpoint="PerformanceLotsOfRules",identifier="true",version="1.0.0-SNAPSHOT",} 2.0boolean_dmn_result_total{artifactId="MyKogitoPerformanceDm",decision="Lev1Rule2",endpoint="PerformanceLotsOfRules",identifier="false",version="1.0.0-SNAPSHOT",} 2.0boolean_dmn_result_total{artifactId="MyKogitoPerformanceDm",decision="Lev1Rule3",endpoint="PerformanceLotsOfRules",identifier="false",version="1.0.0-SNAPSHOT",} 2.0boolean_dmn_result_total{artifactId="MyKogitoPerformanceDm",decision="Lev2Rule1",endpoint="PerformanceLotsOfRules",identifier="false",version="1.0.0-SNAPSHOT",} 2.0boolean_dmn_result_total{artifactId="MyKogitoPerformanceDm",decision="Lev2Rule2",endpoint="PerformanceLotsOfRules",identifier="false",version="1.0.0-SNAPSHOT",} 2.0boolean_dmn_result_total{artifactId="MyKogitoPerformanceDm",decision="Lev2Rule3",endpoint="PerformanceLotsOfRules",identifier="false",version="1.0.0-SNAPSHOT",} 2.0boolean_dmn_result_total{artifactId="MyKogitoPerformanceDm",decision="Lev3Rule1",endpoint="PerformanceLotsOfRules",identifier="true",version="1.0.0-SNAPSHOT",} 2.0Let's run a new rule 'PerformanceConsumeCpuForTime' with the command
curl -s -X POST http://localhost:8080/PerformanceConsumeCpuForTime \ -H 'accept: application/json' \ -H 'Content-Type: application/json' \ -d '{ "milliseconds": 100 }' | jq .We execute the metric reading command once again this time with a filter on 'PerformanceConsumeCpuForTime' metrics
curl -s http://localhost:8080/q/metrics | grep PerformanceConsumeCpuForTimeapi_execution_elapsed_seconds_max{artifactId="MyKogitoPerformanceDm",endpoint="PerformanceConsumeCpuForTime",version="1.0.0-SNAPSHOT",} 0.101550828api_execution_elapsed_seconds{artifactId="MyKogitoPerformanceDm",endpoint="PerformanceConsumeCpuForTime",version="1.0.0-SNAPSHOT",quantile="0.1",} 0.096468992api_execution_elapsed_seconds{artifactId="MyKogitoPerformanceDm",endpoint="PerformanceConsumeCpuForTime",version="1.0.0-SNAPSHOT",quantile="0.25",} 0.096468992api_execution_elapsed_seconds{artifactId="MyKogitoPerformanceDm",endpoint="PerformanceConsumeCpuForTime",version="1.0.0-SNAPSHOT",quantile="0.5",} 0.096468992api_execution_elapsed_seconds{artifactId="MyKogitoPerformanceDm",endpoint="PerformanceConsumeCpuForTime",version="1.0.0-SNAPSHOT",quantile="0.75",} 0.100663296api_execution_elapsed_seconds{artifactId="MyKogitoPerformanceDm",endpoint="PerformanceConsumeCpuForTime",version="1.0.0-SNAPSHOT",quantile="0.9",} 0.100663296api_execution_elapsed_seconds{artifactId="MyKogitoPerformanceDm",endpoint="PerformanceConsumeCpuForTime",version="1.0.0-SNAPSHOT",quantile="0.99",} 0.100663296api_execution_elapsed_seconds_count{artifactId="MyKogitoPerformanceDm",endpoint="PerformanceConsumeCpuForTime",version="1.0.0-SNAPSHOT",} 2.0api_execution_elapsed_seconds_sum{artifactId="MyKogitoPerformanceDm",endpoint="PerformanceConsumeCpuForTime",version="1.0.0-SNAPSHOT",} 0.201873437http_server_requests_seconds_count{method="POST",outcome="SUCCESS",status="200",uri="/PerformanceConsumeCpuForTime",} 2.0http_server_requests_seconds_sum{method="POST",outcome="SUCCESS",status="200",uri="/PerformanceConsumeCpuForTime",} 0.216193777http_server_requests_seconds_max{method="POST",outcome="SUCCESS",status="200",uri="/PerformanceConsumeCpuForTime",} 0.110728206api_http_response_code_total{artifactId="MyKogitoPerformanceDm",endpoint="PerformanceConsumeCpuForTime",identifier="200",version="1.0.0-SNAPSHOT",} 2.0string_dmn_result_total{artifactId="MyKogitoPerformanceDm",decision="ConsumeCpuForTime",endpoint="PerformanceConsumeCpuForTime",identifier="done",version="1.0.0-SNAPSHOT",} 2.0We can iterate the rule triggers several times to see the metrics vary over time.
We'll see better these animated variations once deployed in OpenShift environment with the help of Prometheus.
Note: The name of the metrics is defined by the framework set in the project's pom.xml file.
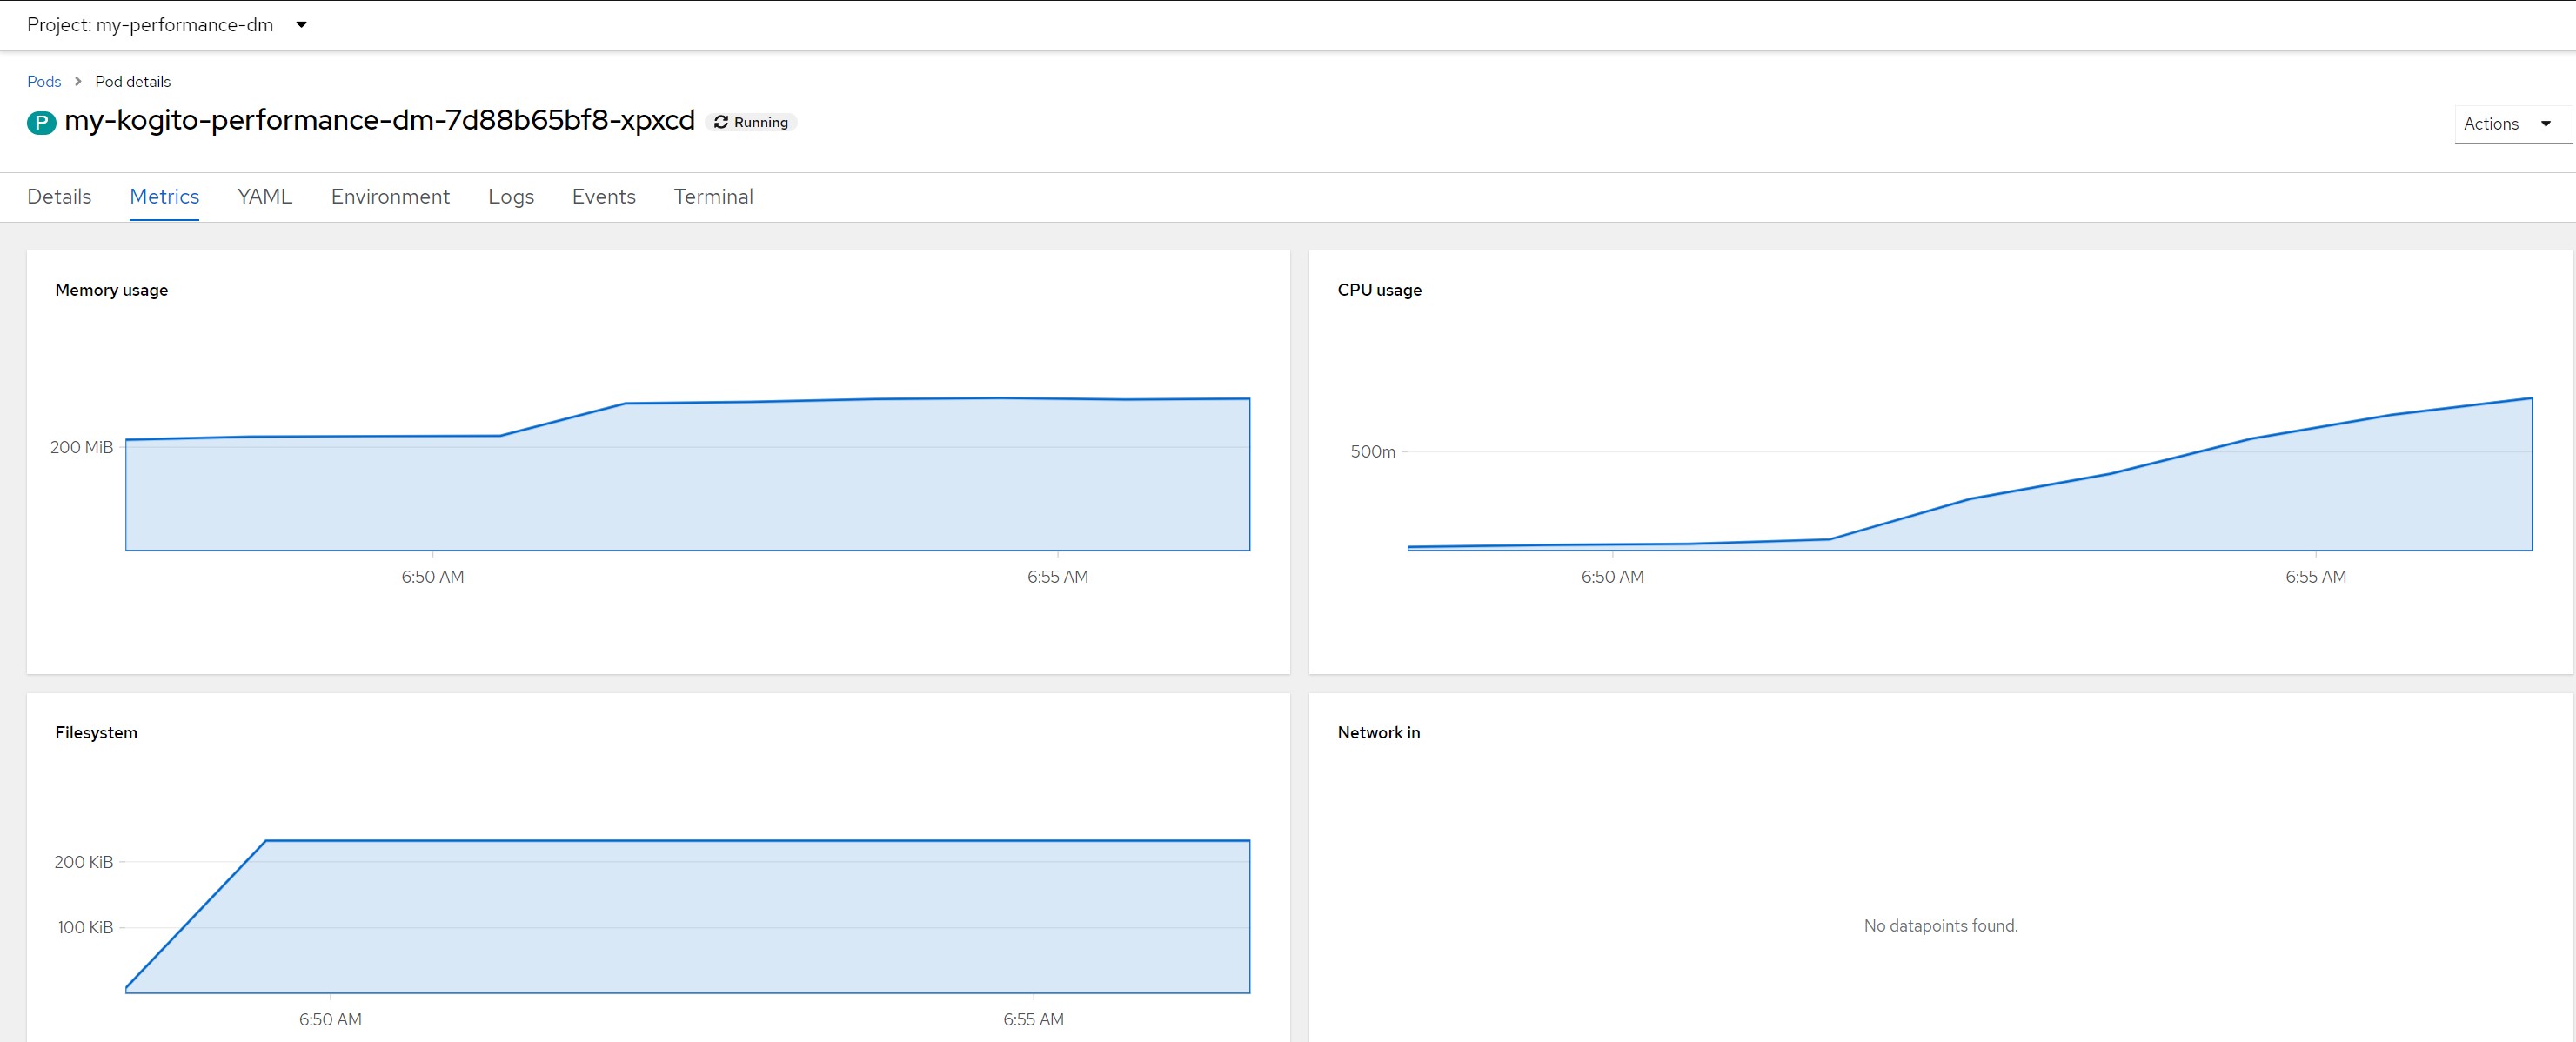
Load scenariosThe reports that we will see for all the following scenarios refer to a single pod with a single container with resources limited to a single core (cpu=1)
List of load scenarios and resource consumption target
Scenario 1Periodic invocation of 'FlightRebooking' rule with small payload, single virtual user, 3 second delay between successive invocations.
Scenario 2Periodic invocation of the 'FlightRebooking' rule with large payloads, single virtual user, 5 second delay between successive invocations.
Scenario 3Periodic invocation of the 'PerformanceConsumeCpuForTime' rule with duration of 100 milliseconds, a single virtual, 1 second delay between successive invocations.
Scenario 4Periodic invocation of the 'PerformanceConsumeCpuForTime' rule, two concurrent virtual users, one with payload duration of 100 milliseconds, one with payload duration of 300 milliseconds, 1 second delay between successive invocations.
Scenario 5Periodic invocation of the 'PerformanceLotsOfRules' rule, 500 concurrent virtual users, 0.1 second delay between successive invocations.
Scenario 7Same as scenario 6 with 1000 virtual users.
Scenario 8Generated DDoS, we create a very high number of parallel requests (mix of scenarios), we bring the CPU to the maximum allowed consumption and we slow down the execution of all requests ... even those of the pod liveness probe ;)
Prometheus queriesFor each scenario, the metrics relating to the following queries were observed
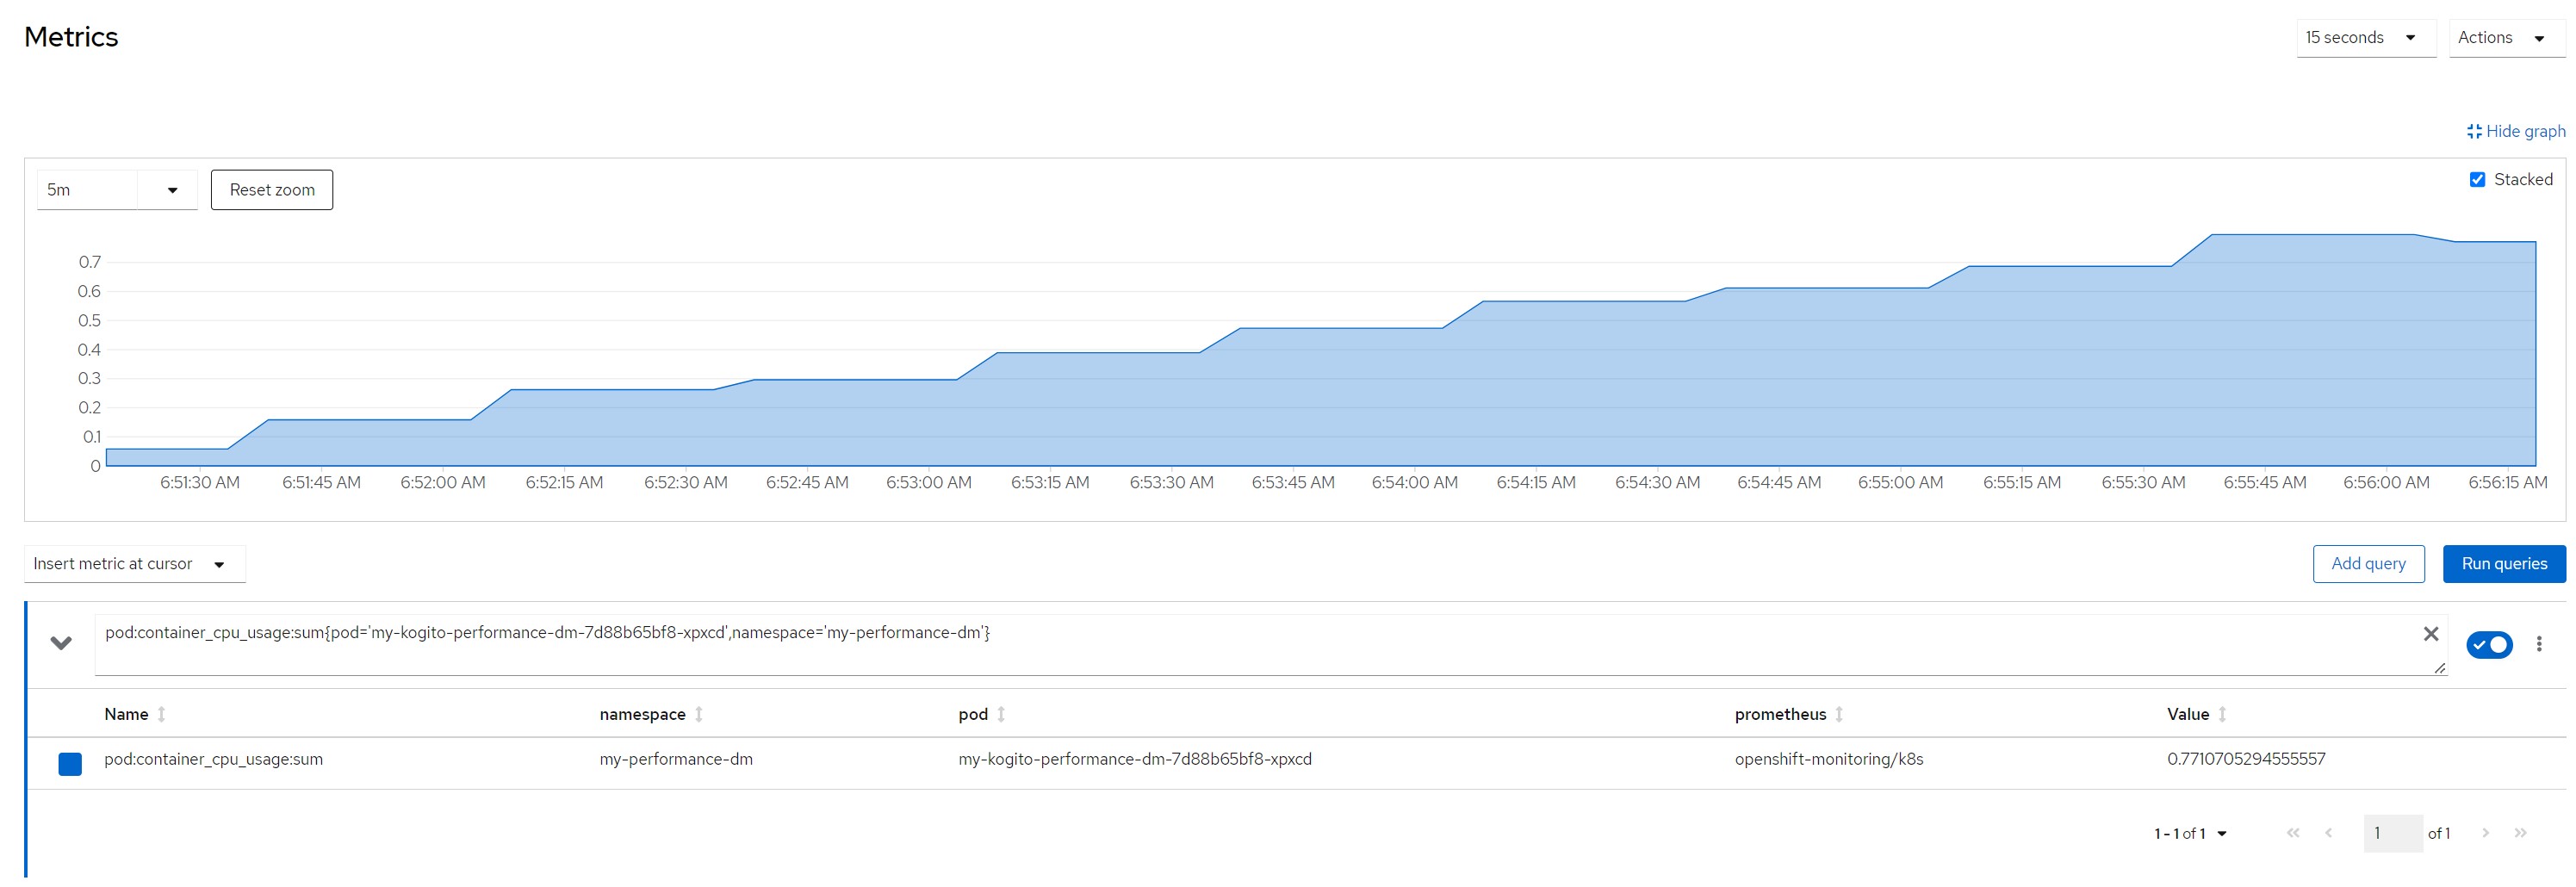
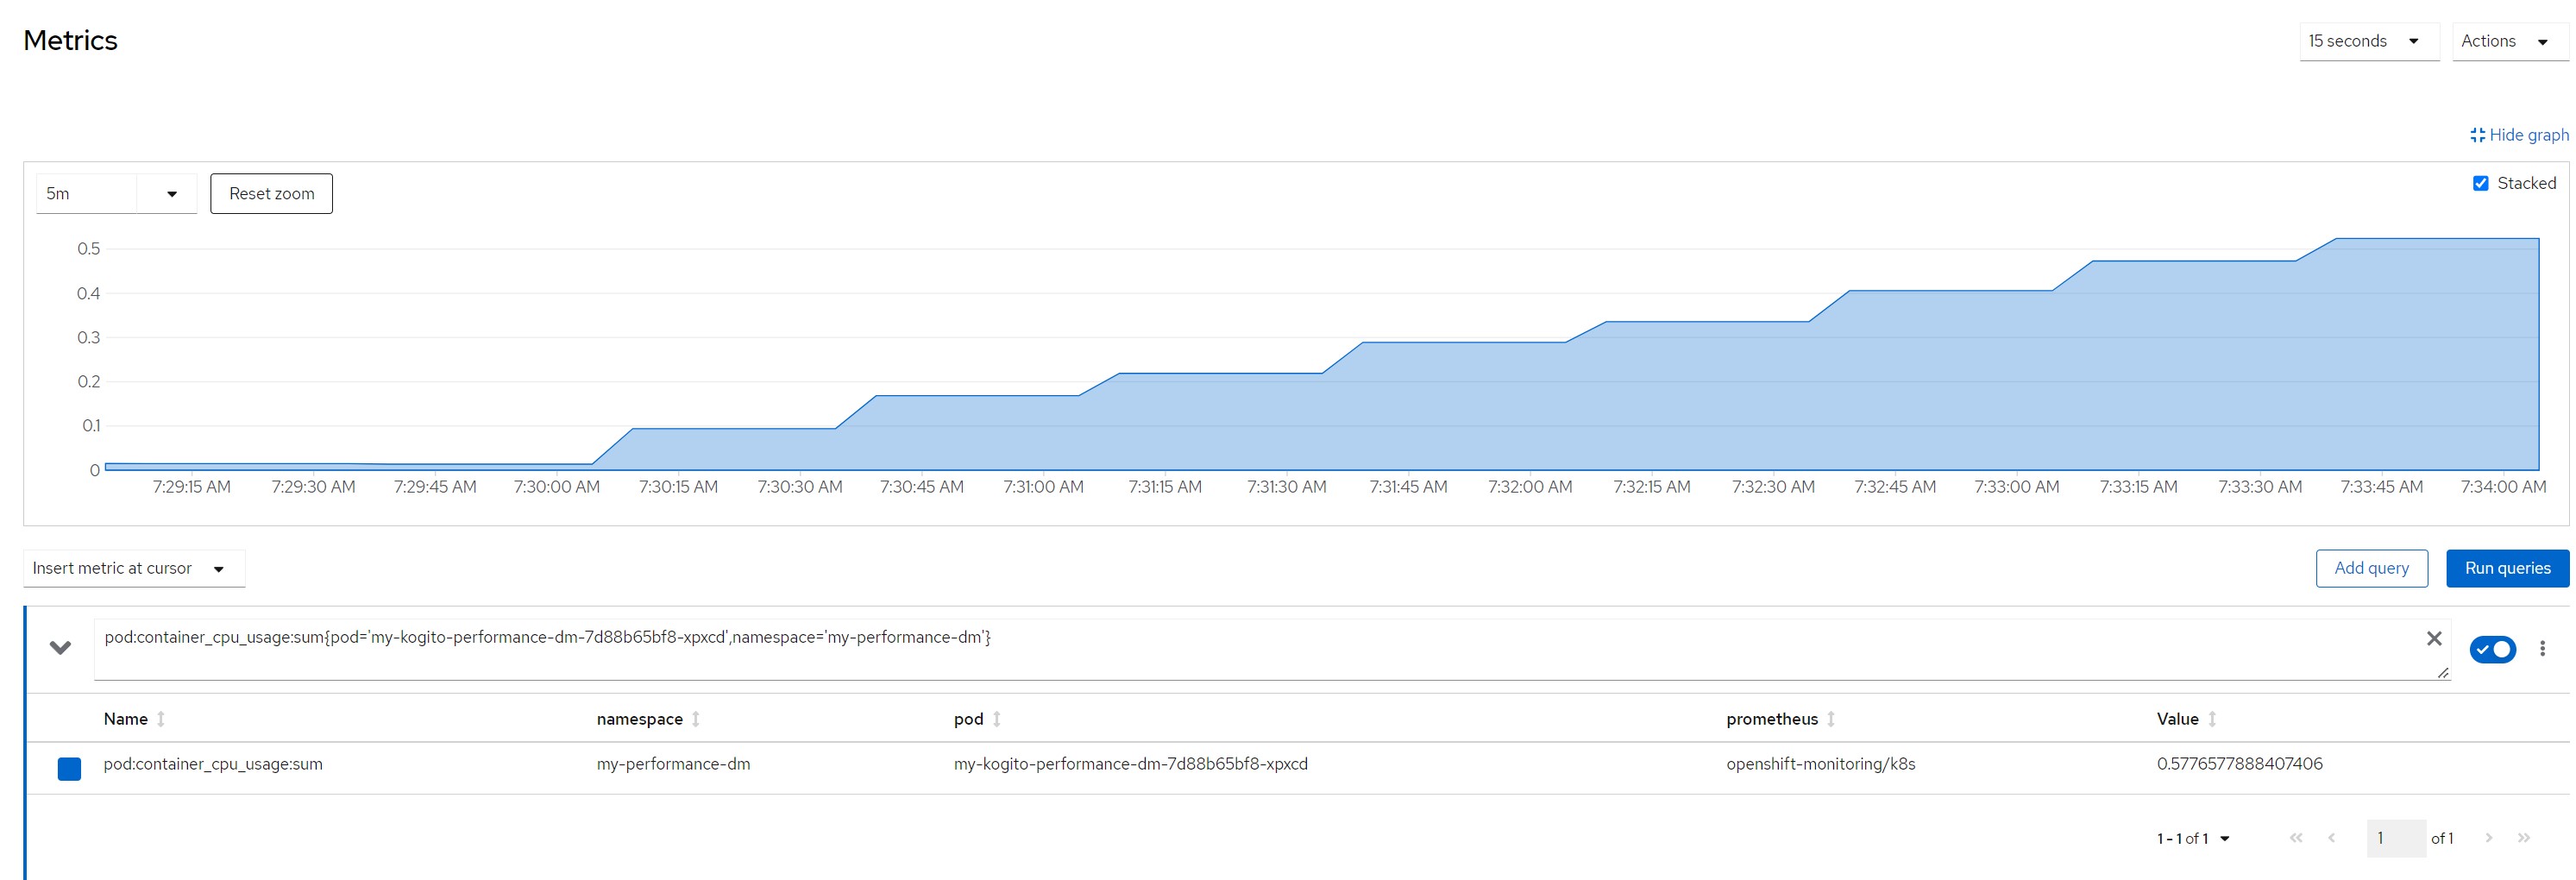
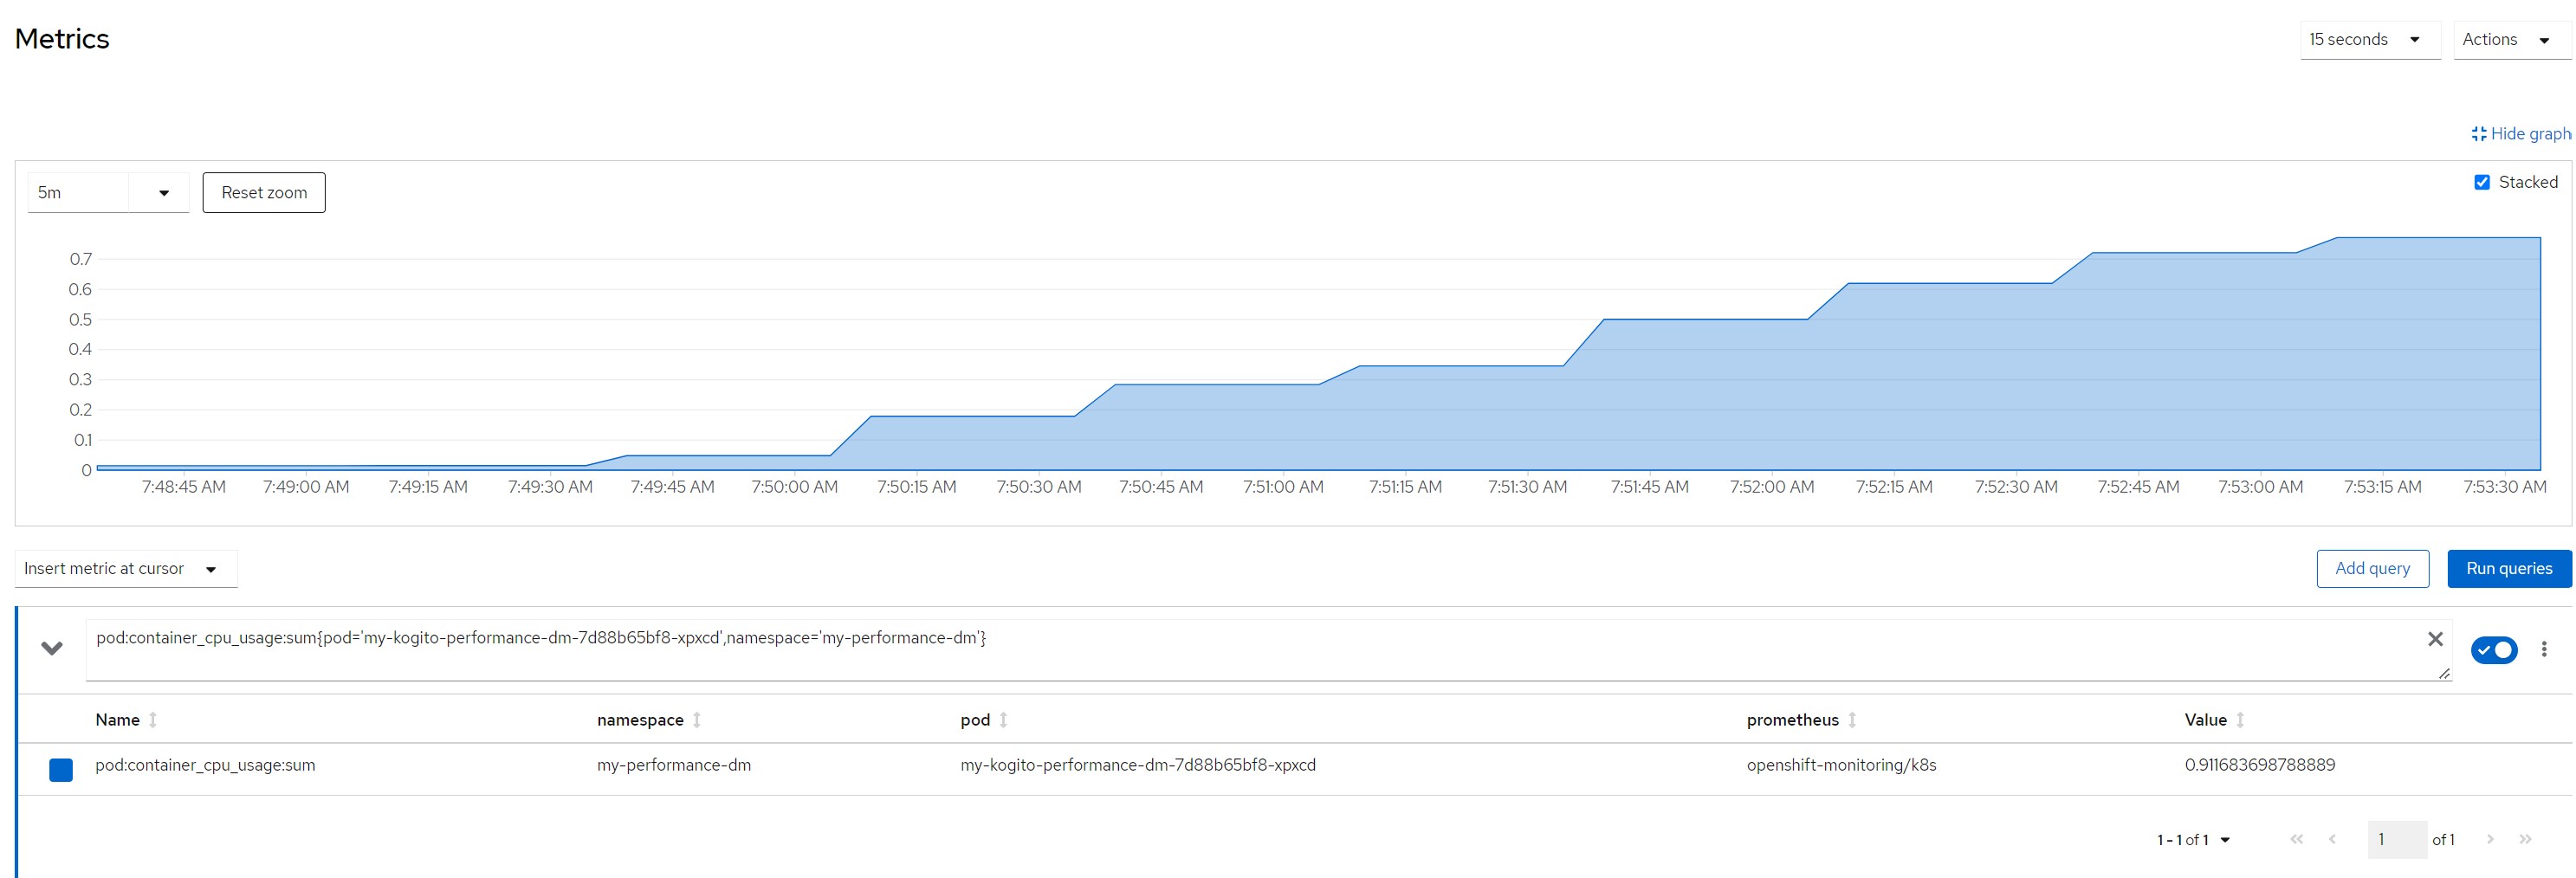
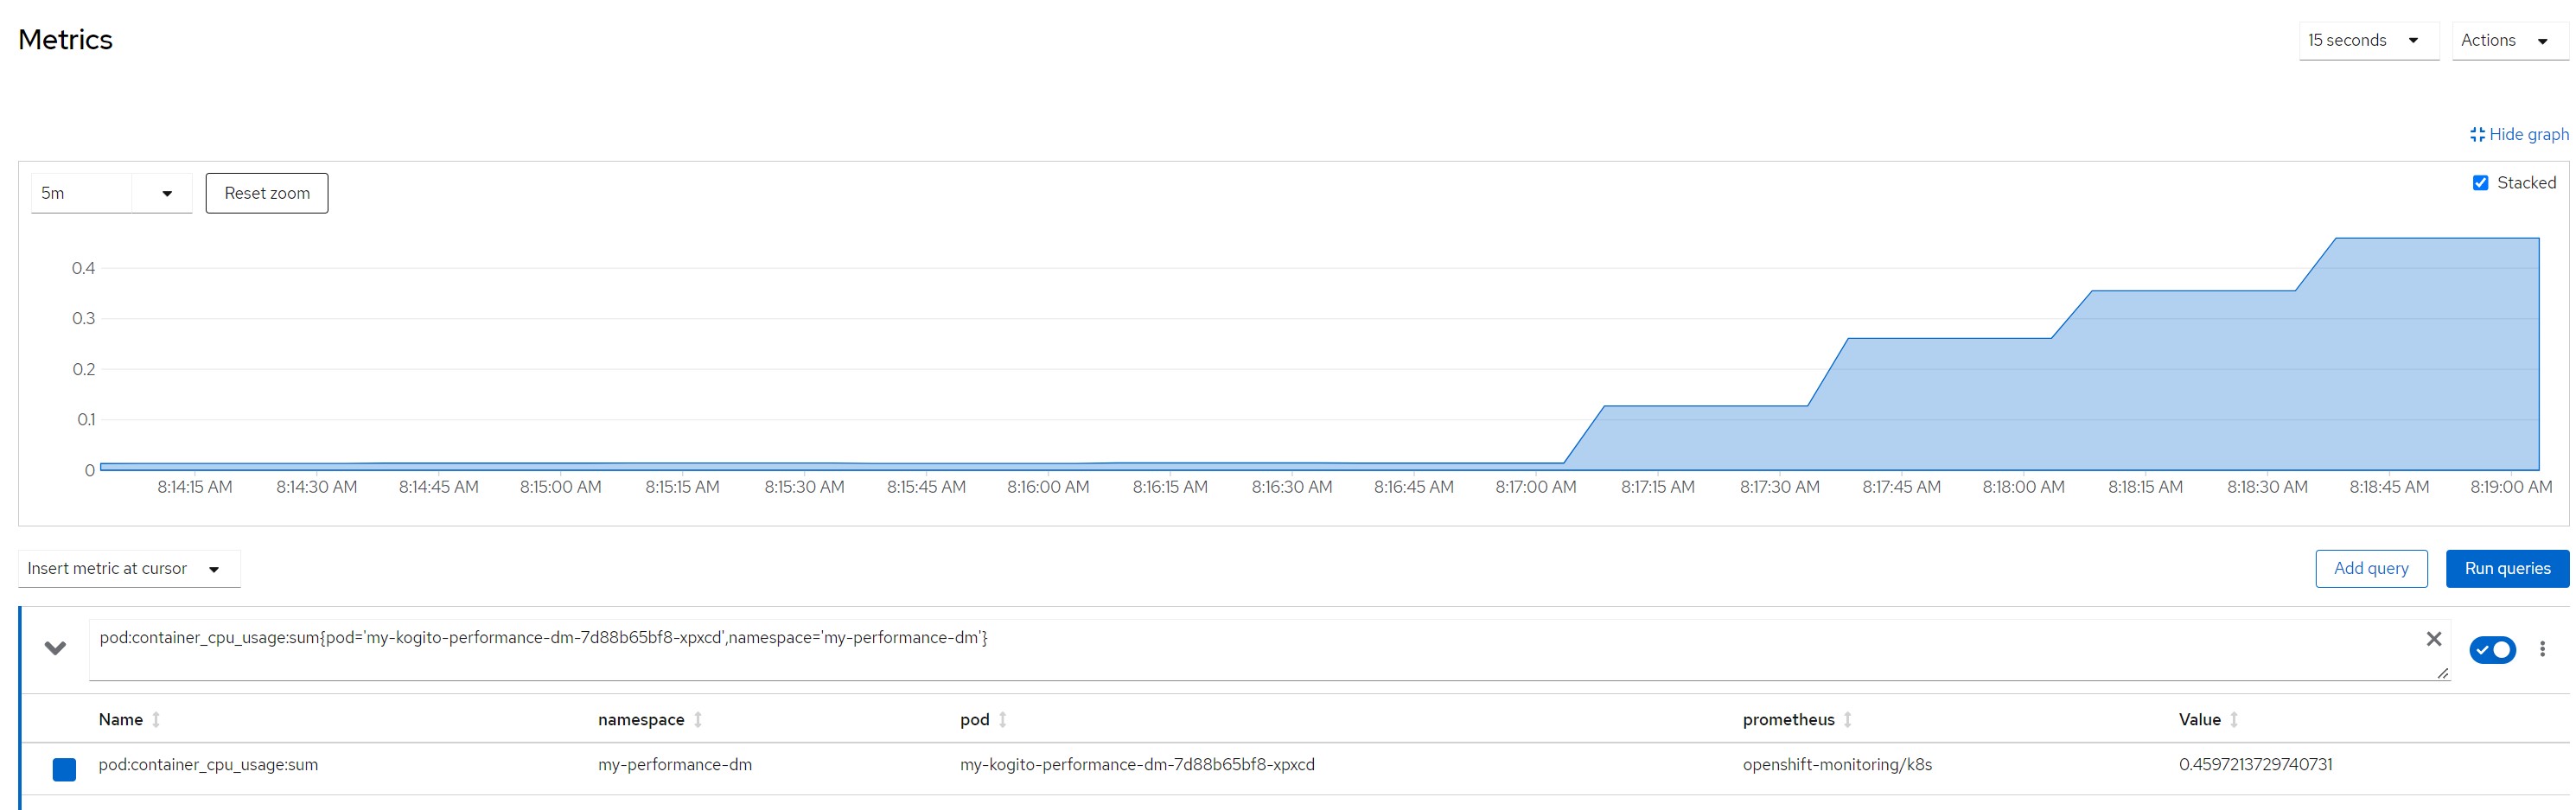
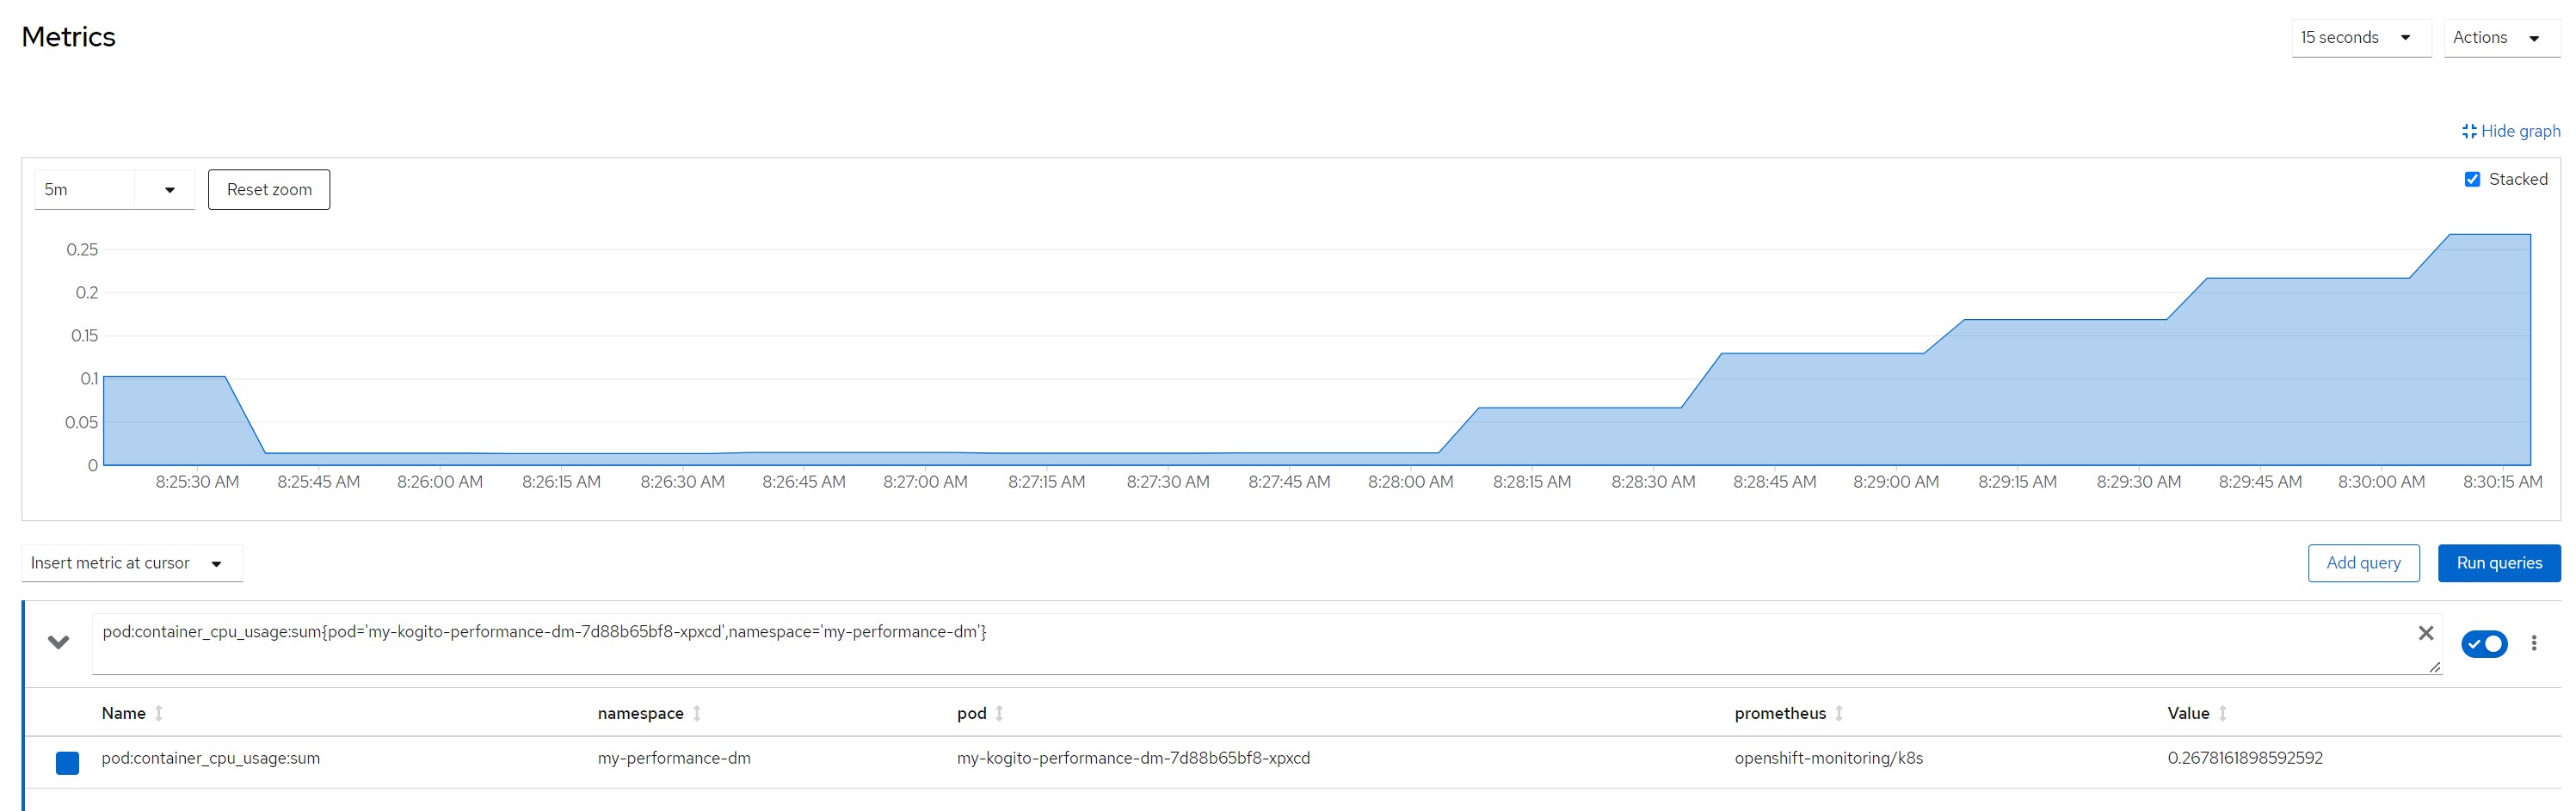
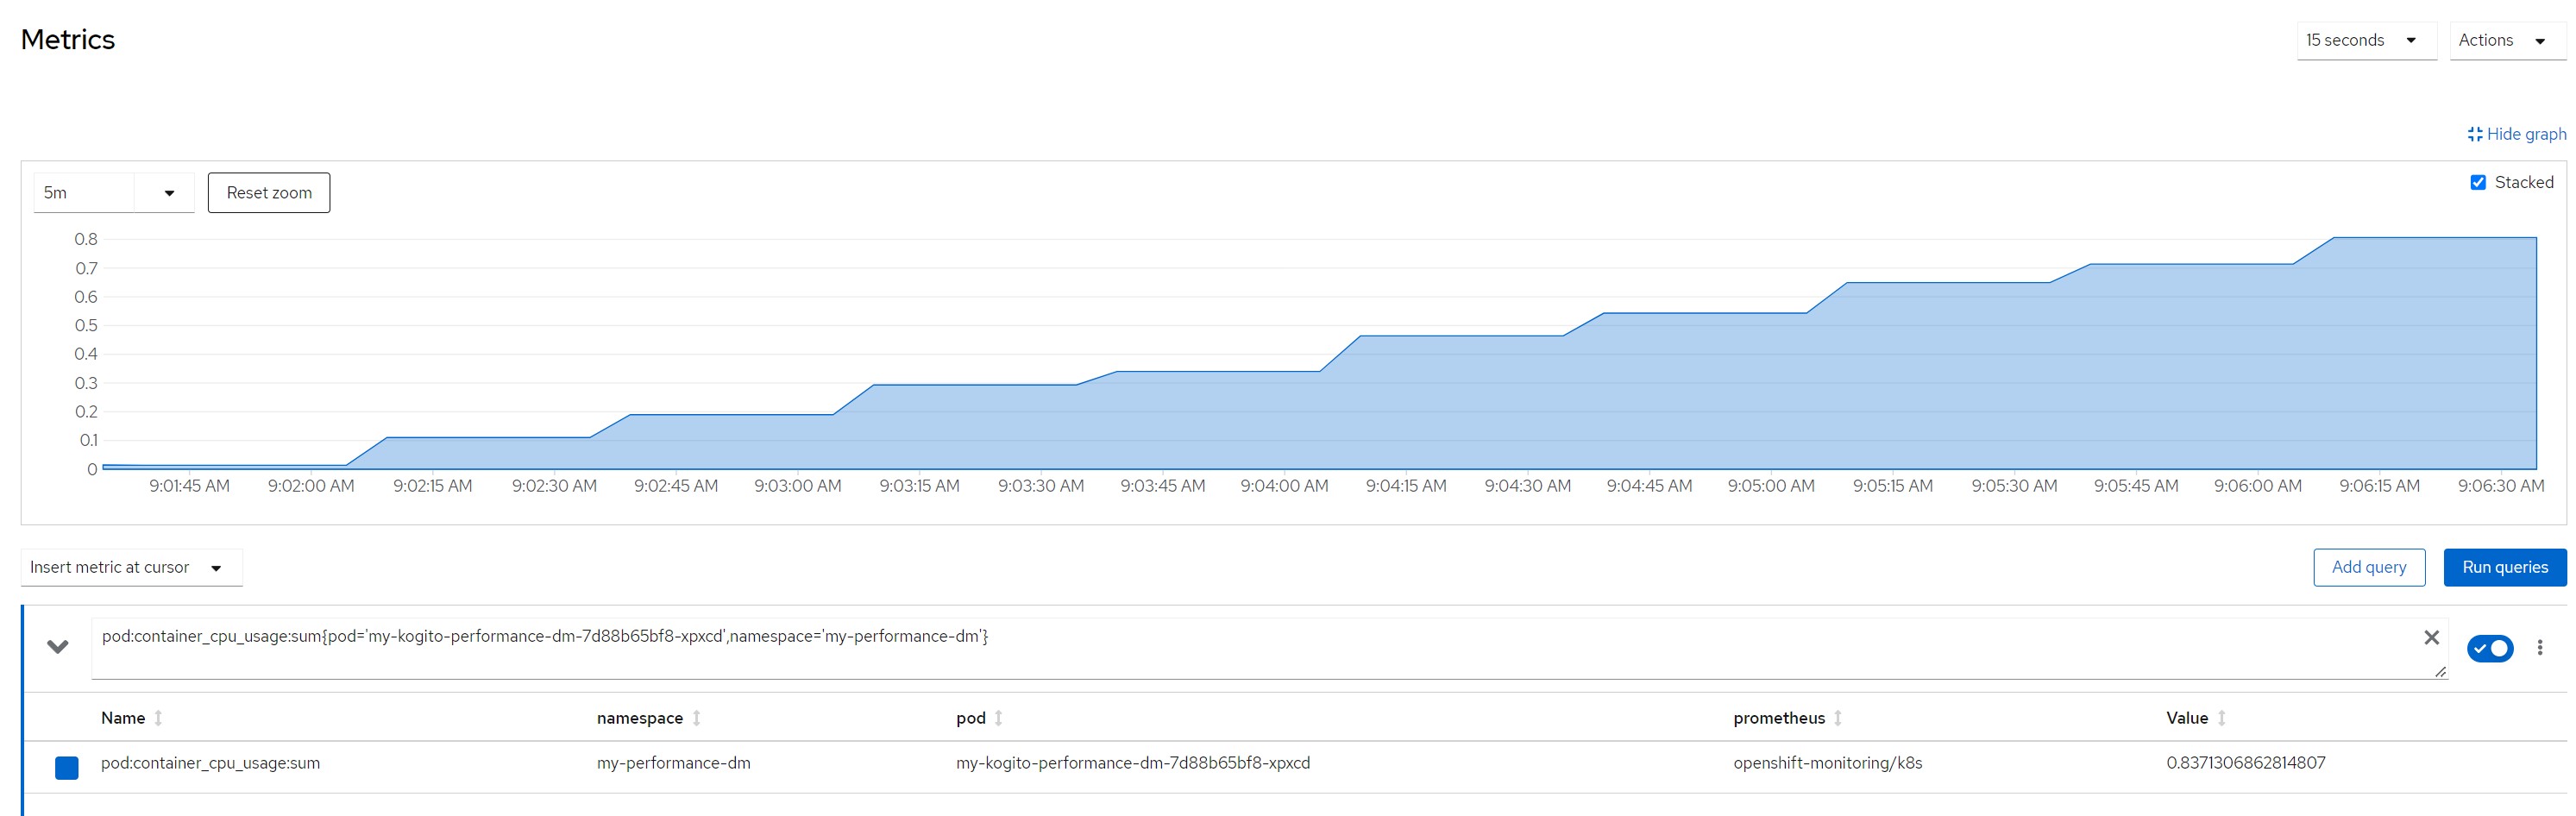
pod cpu
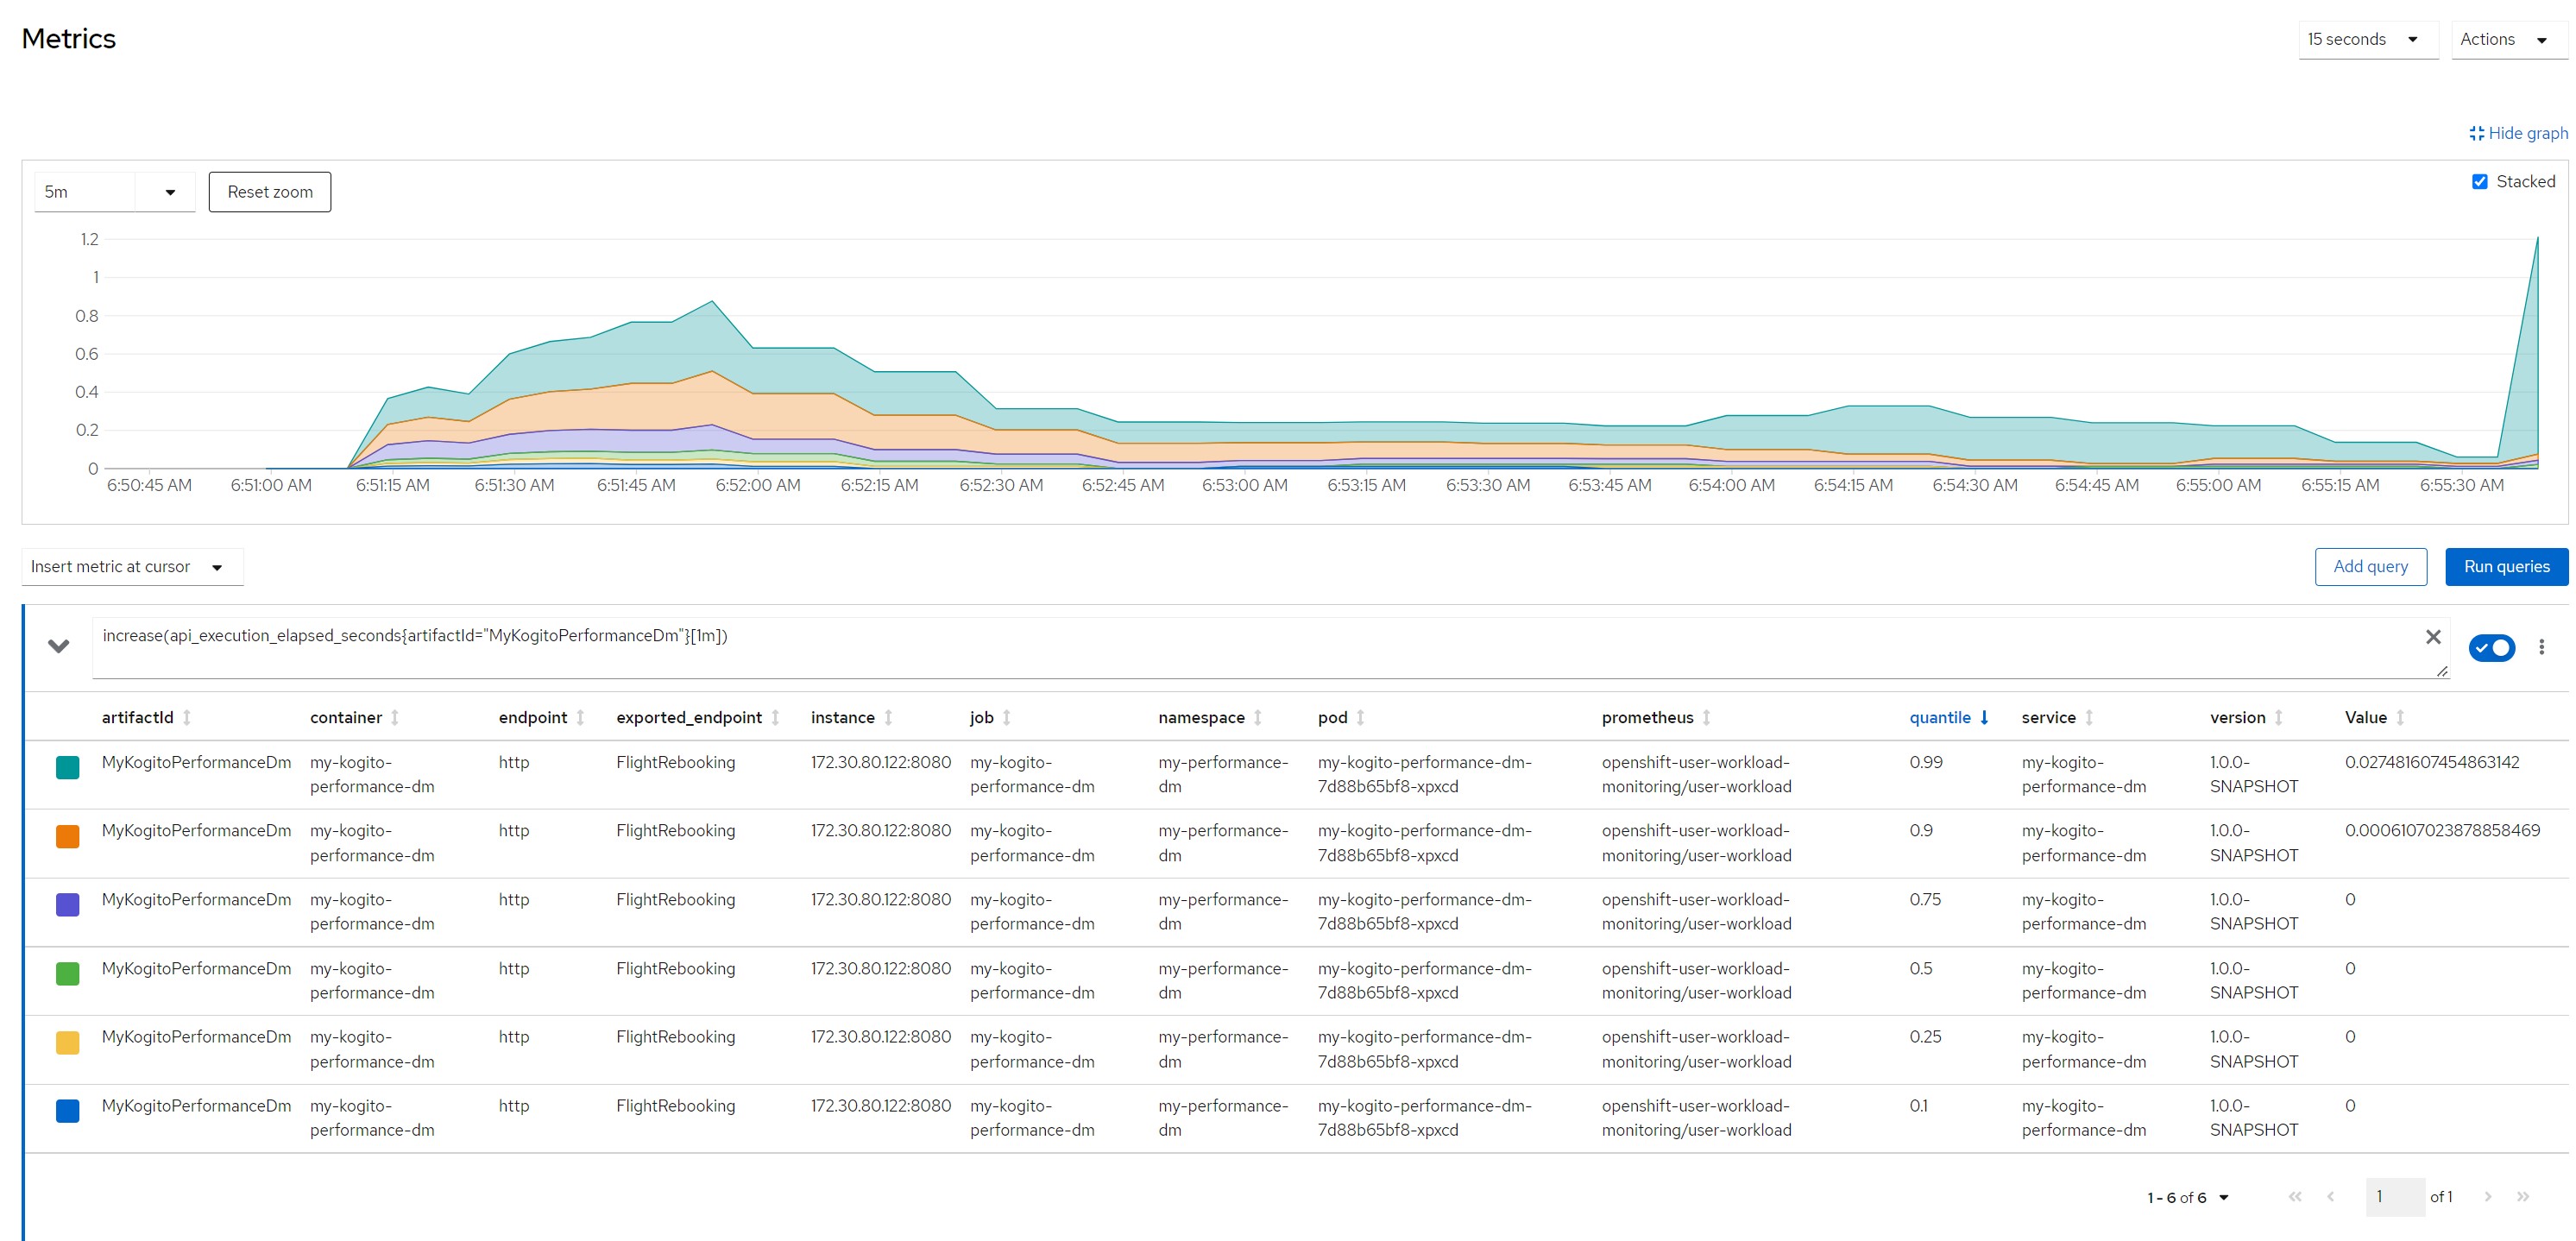
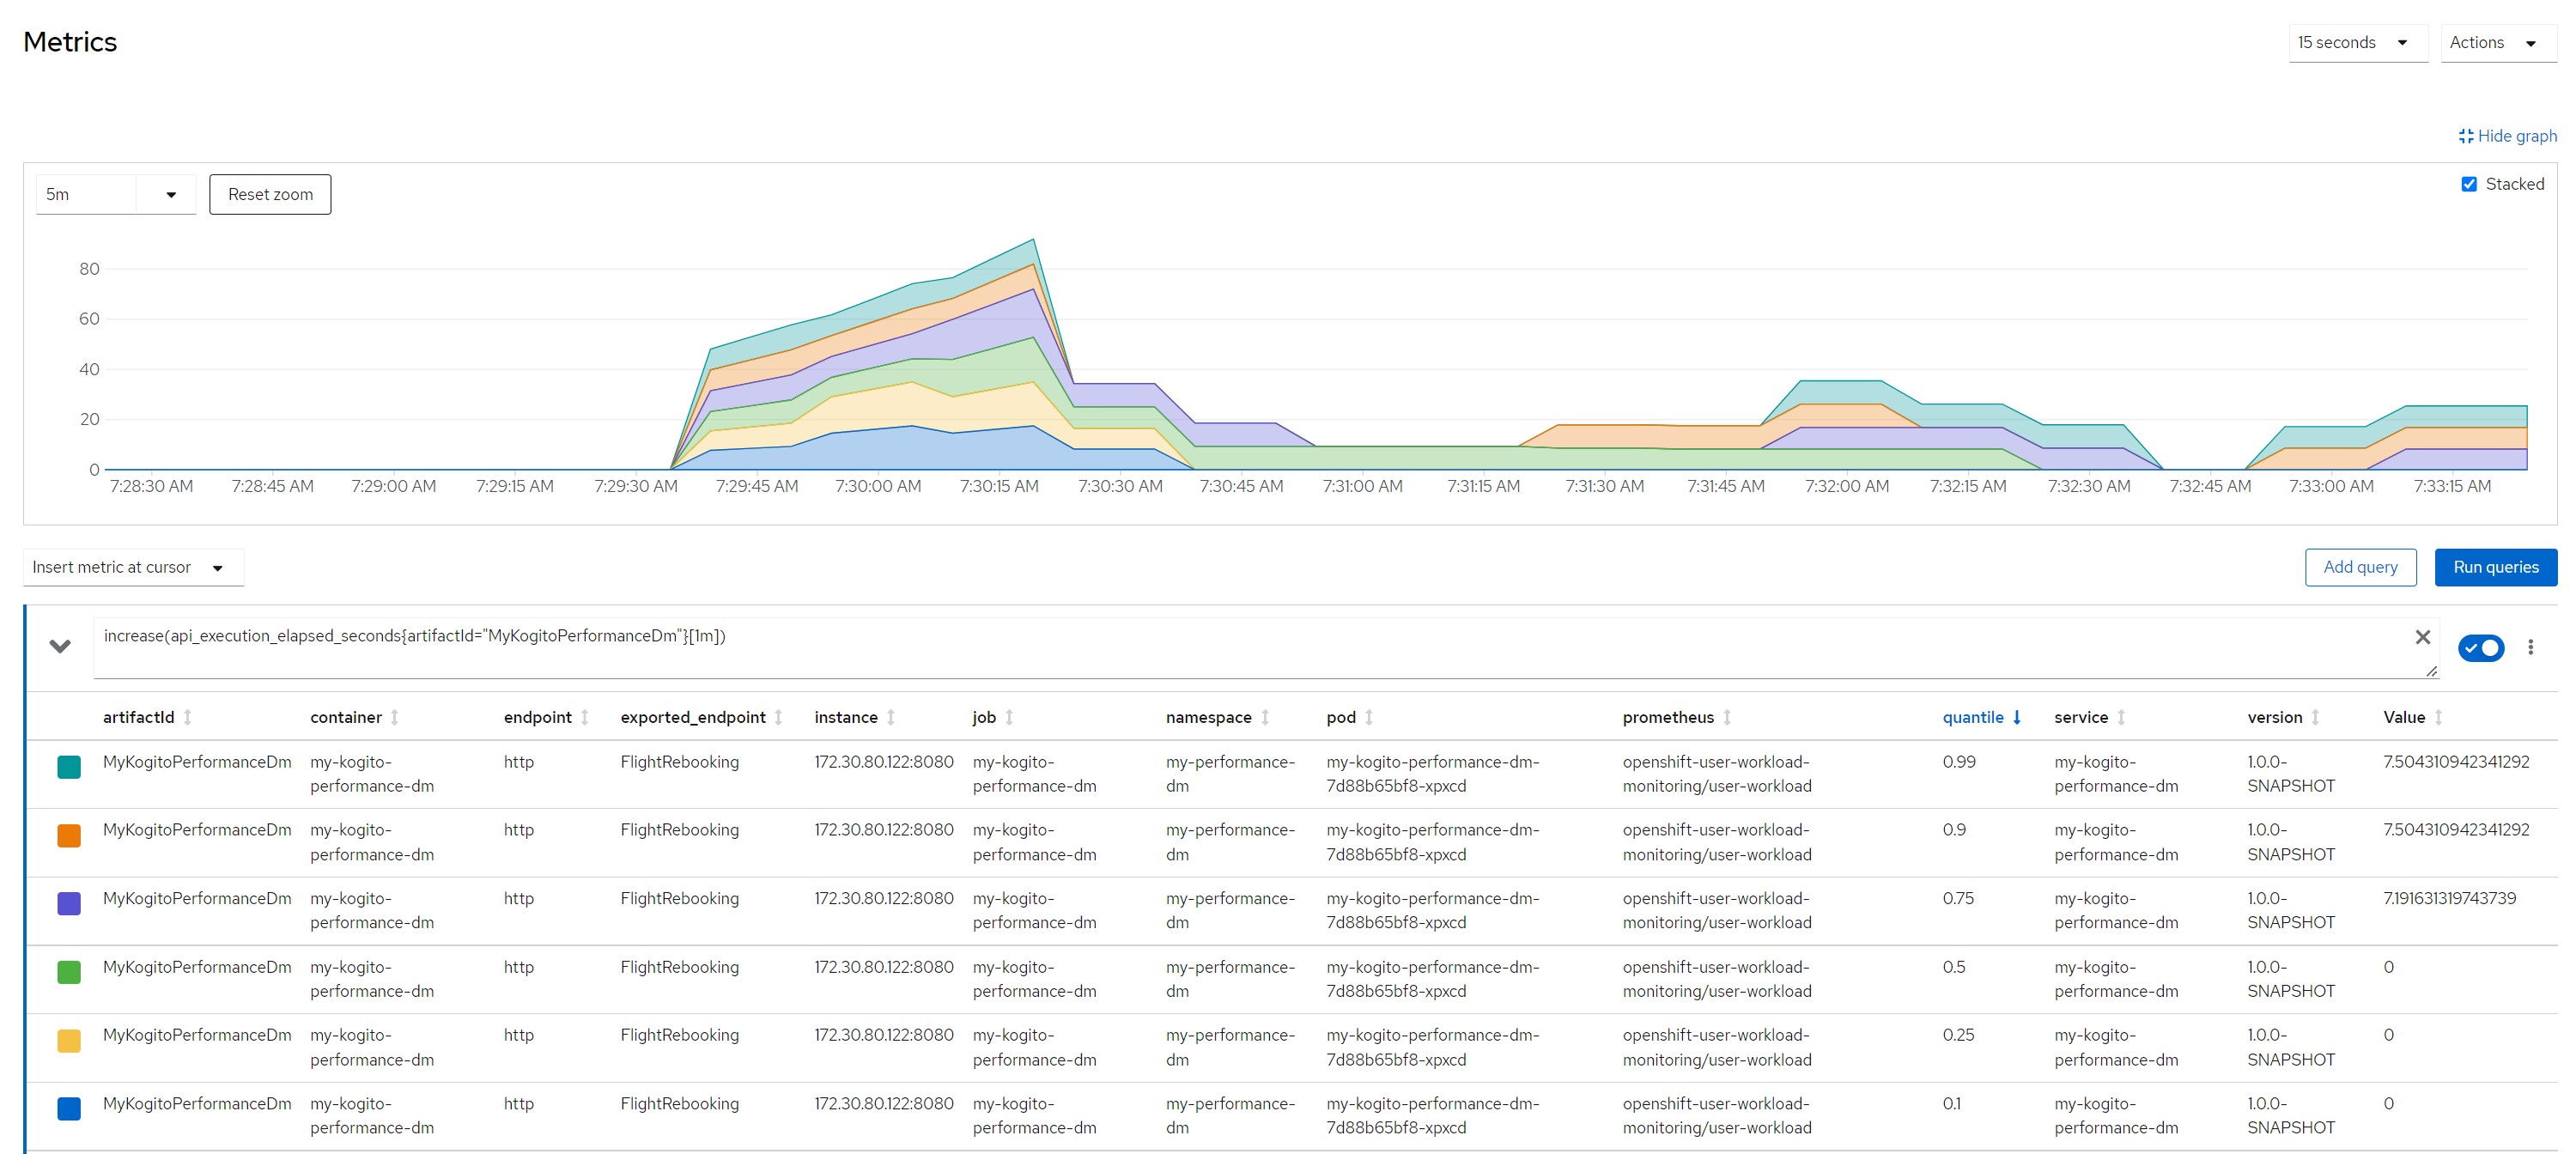
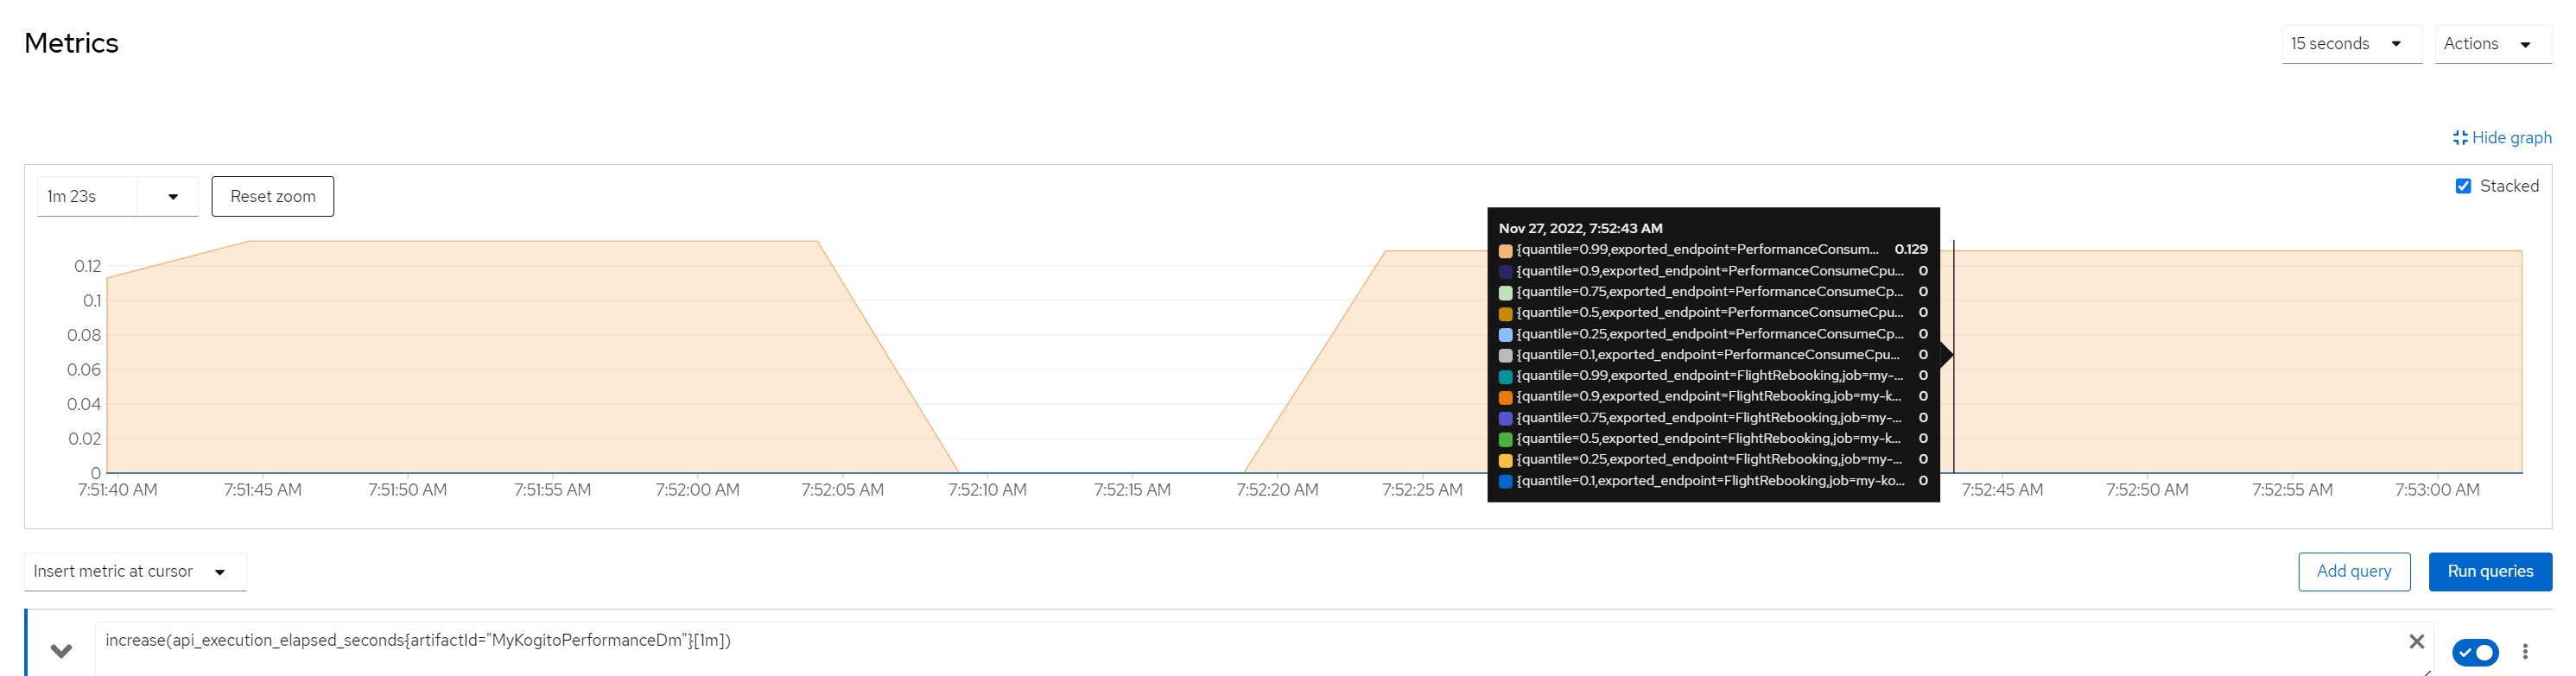
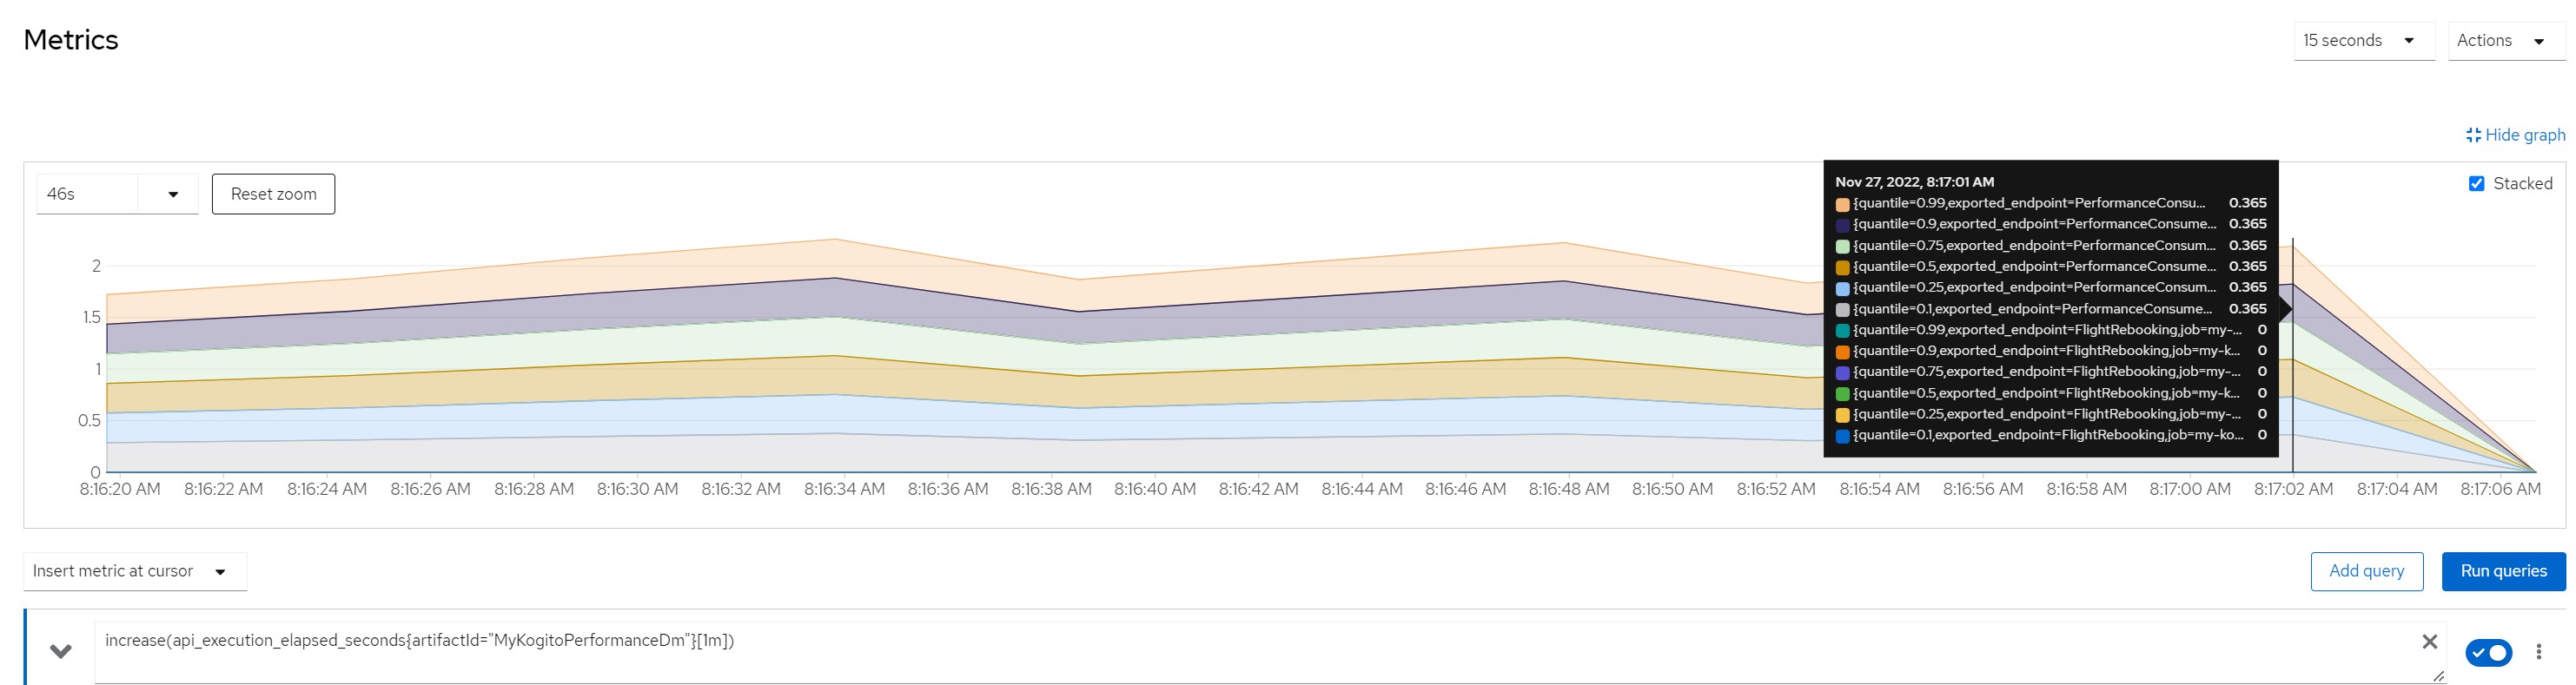
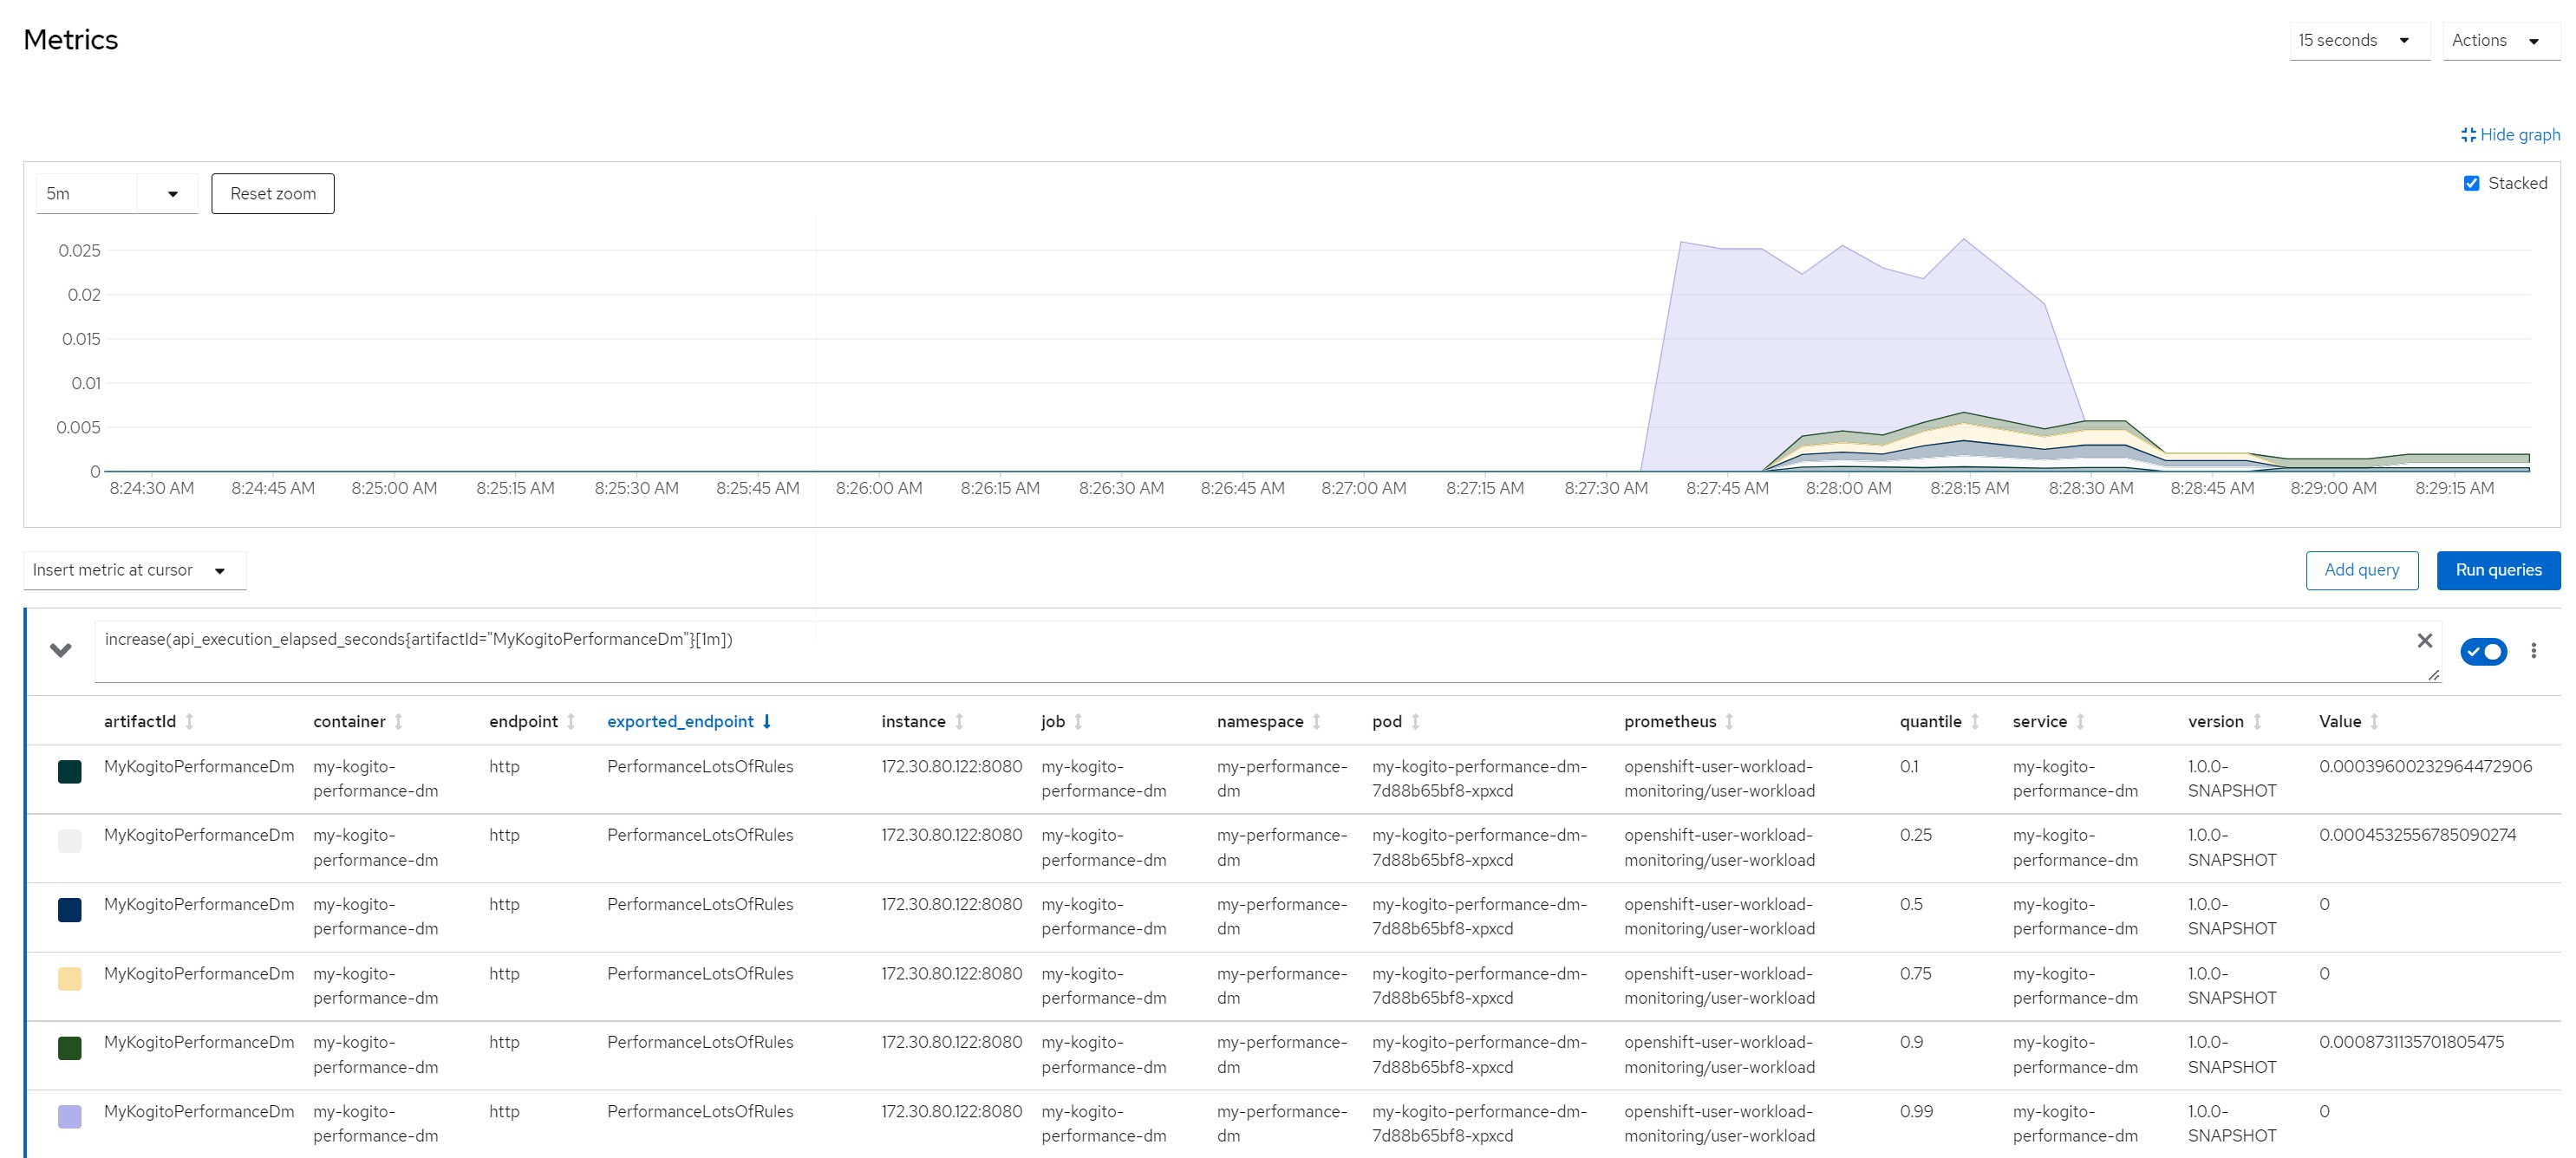
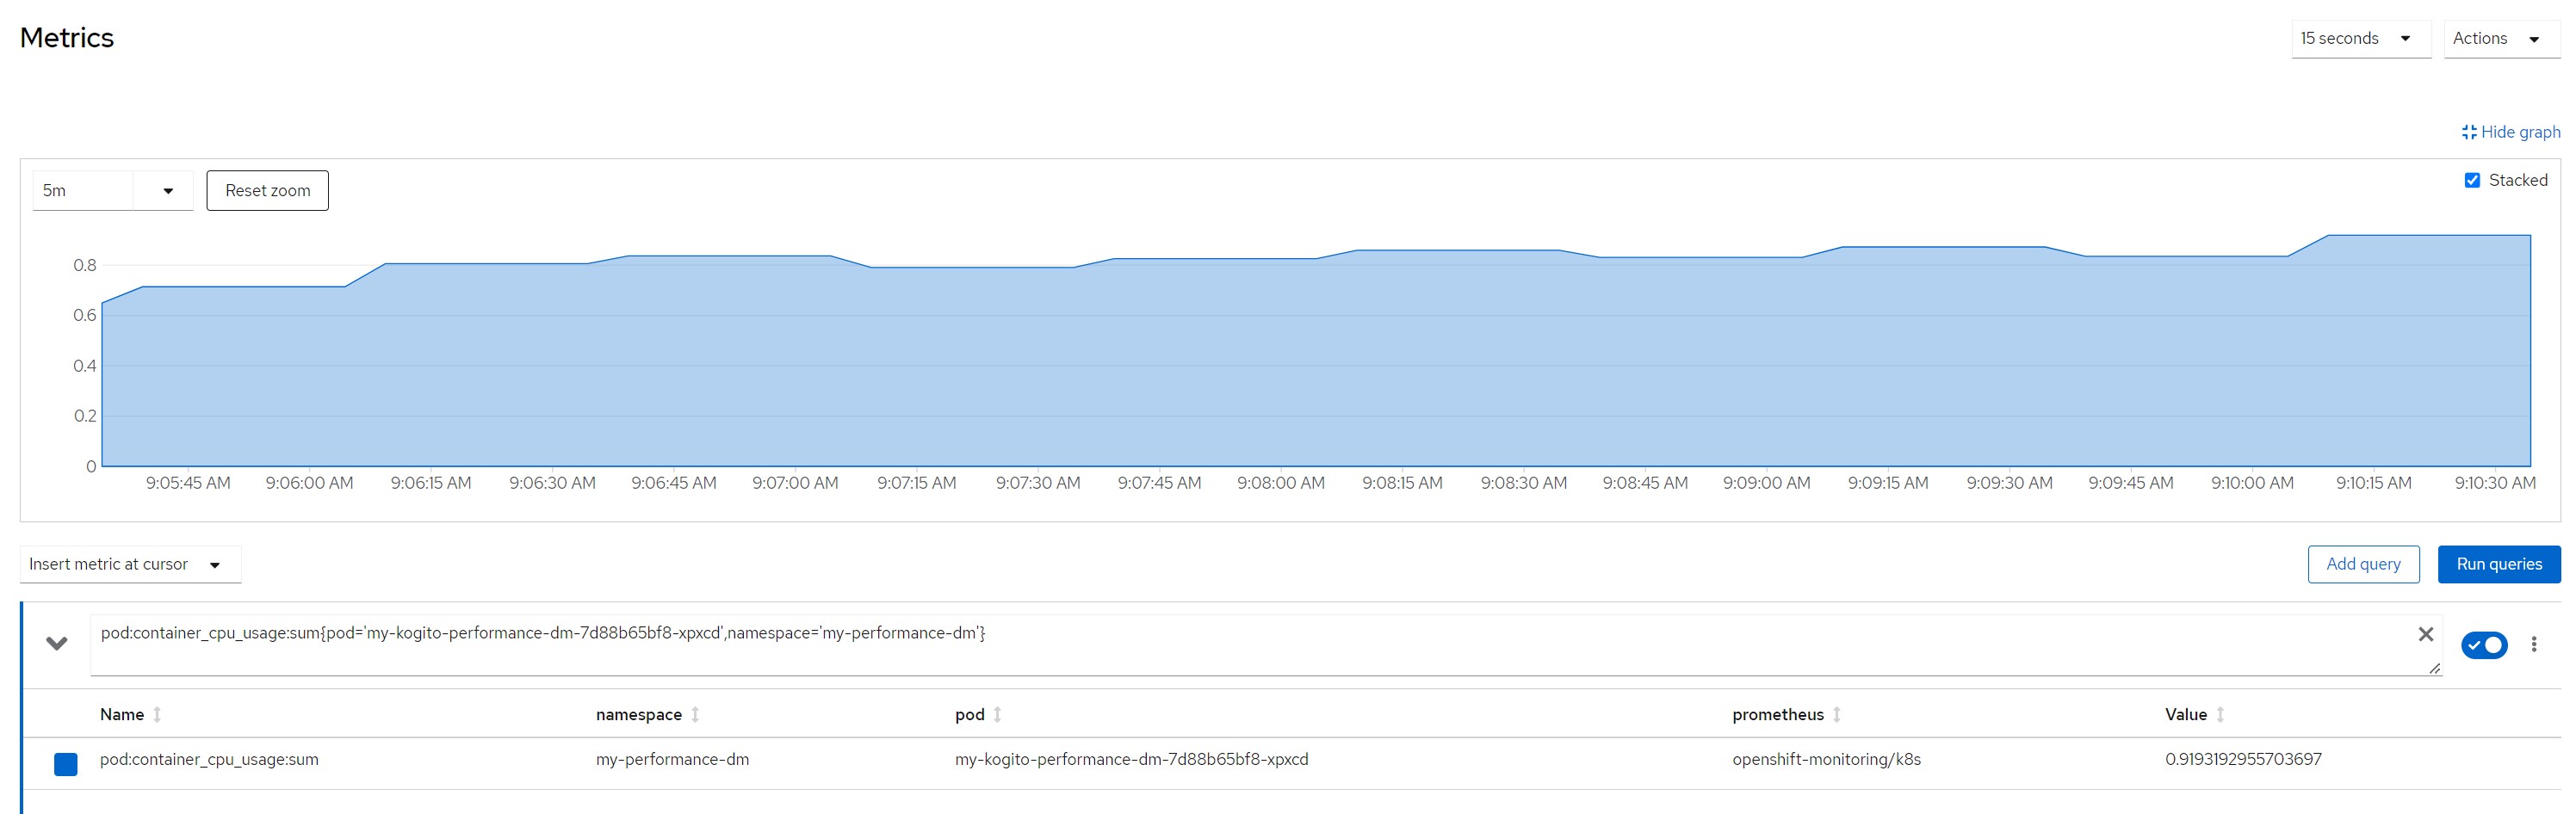
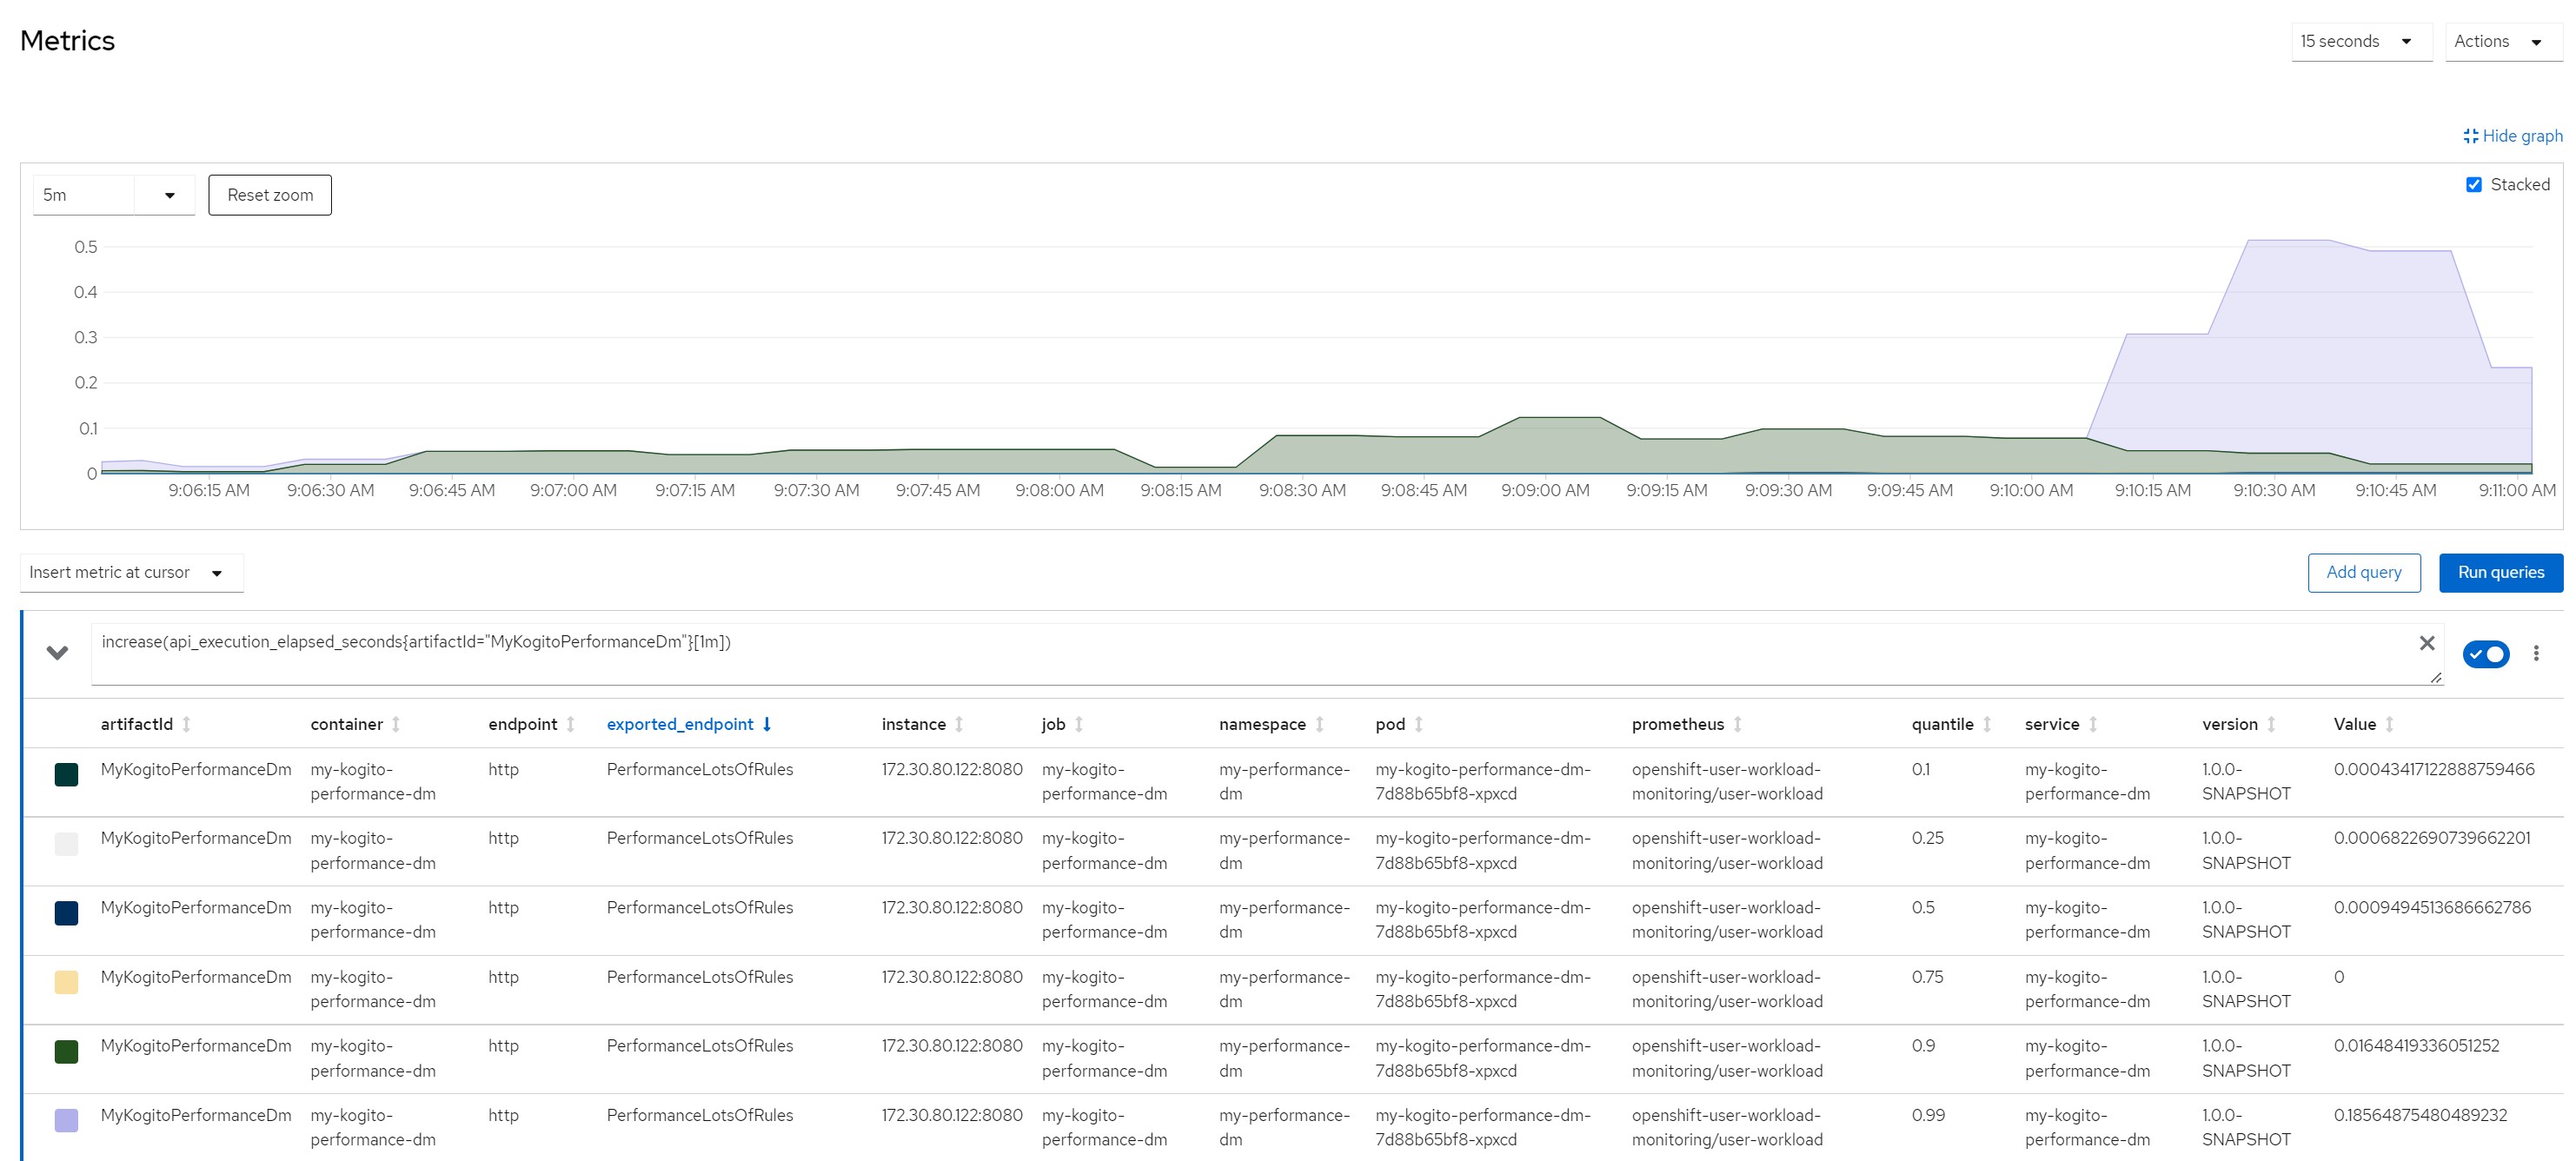
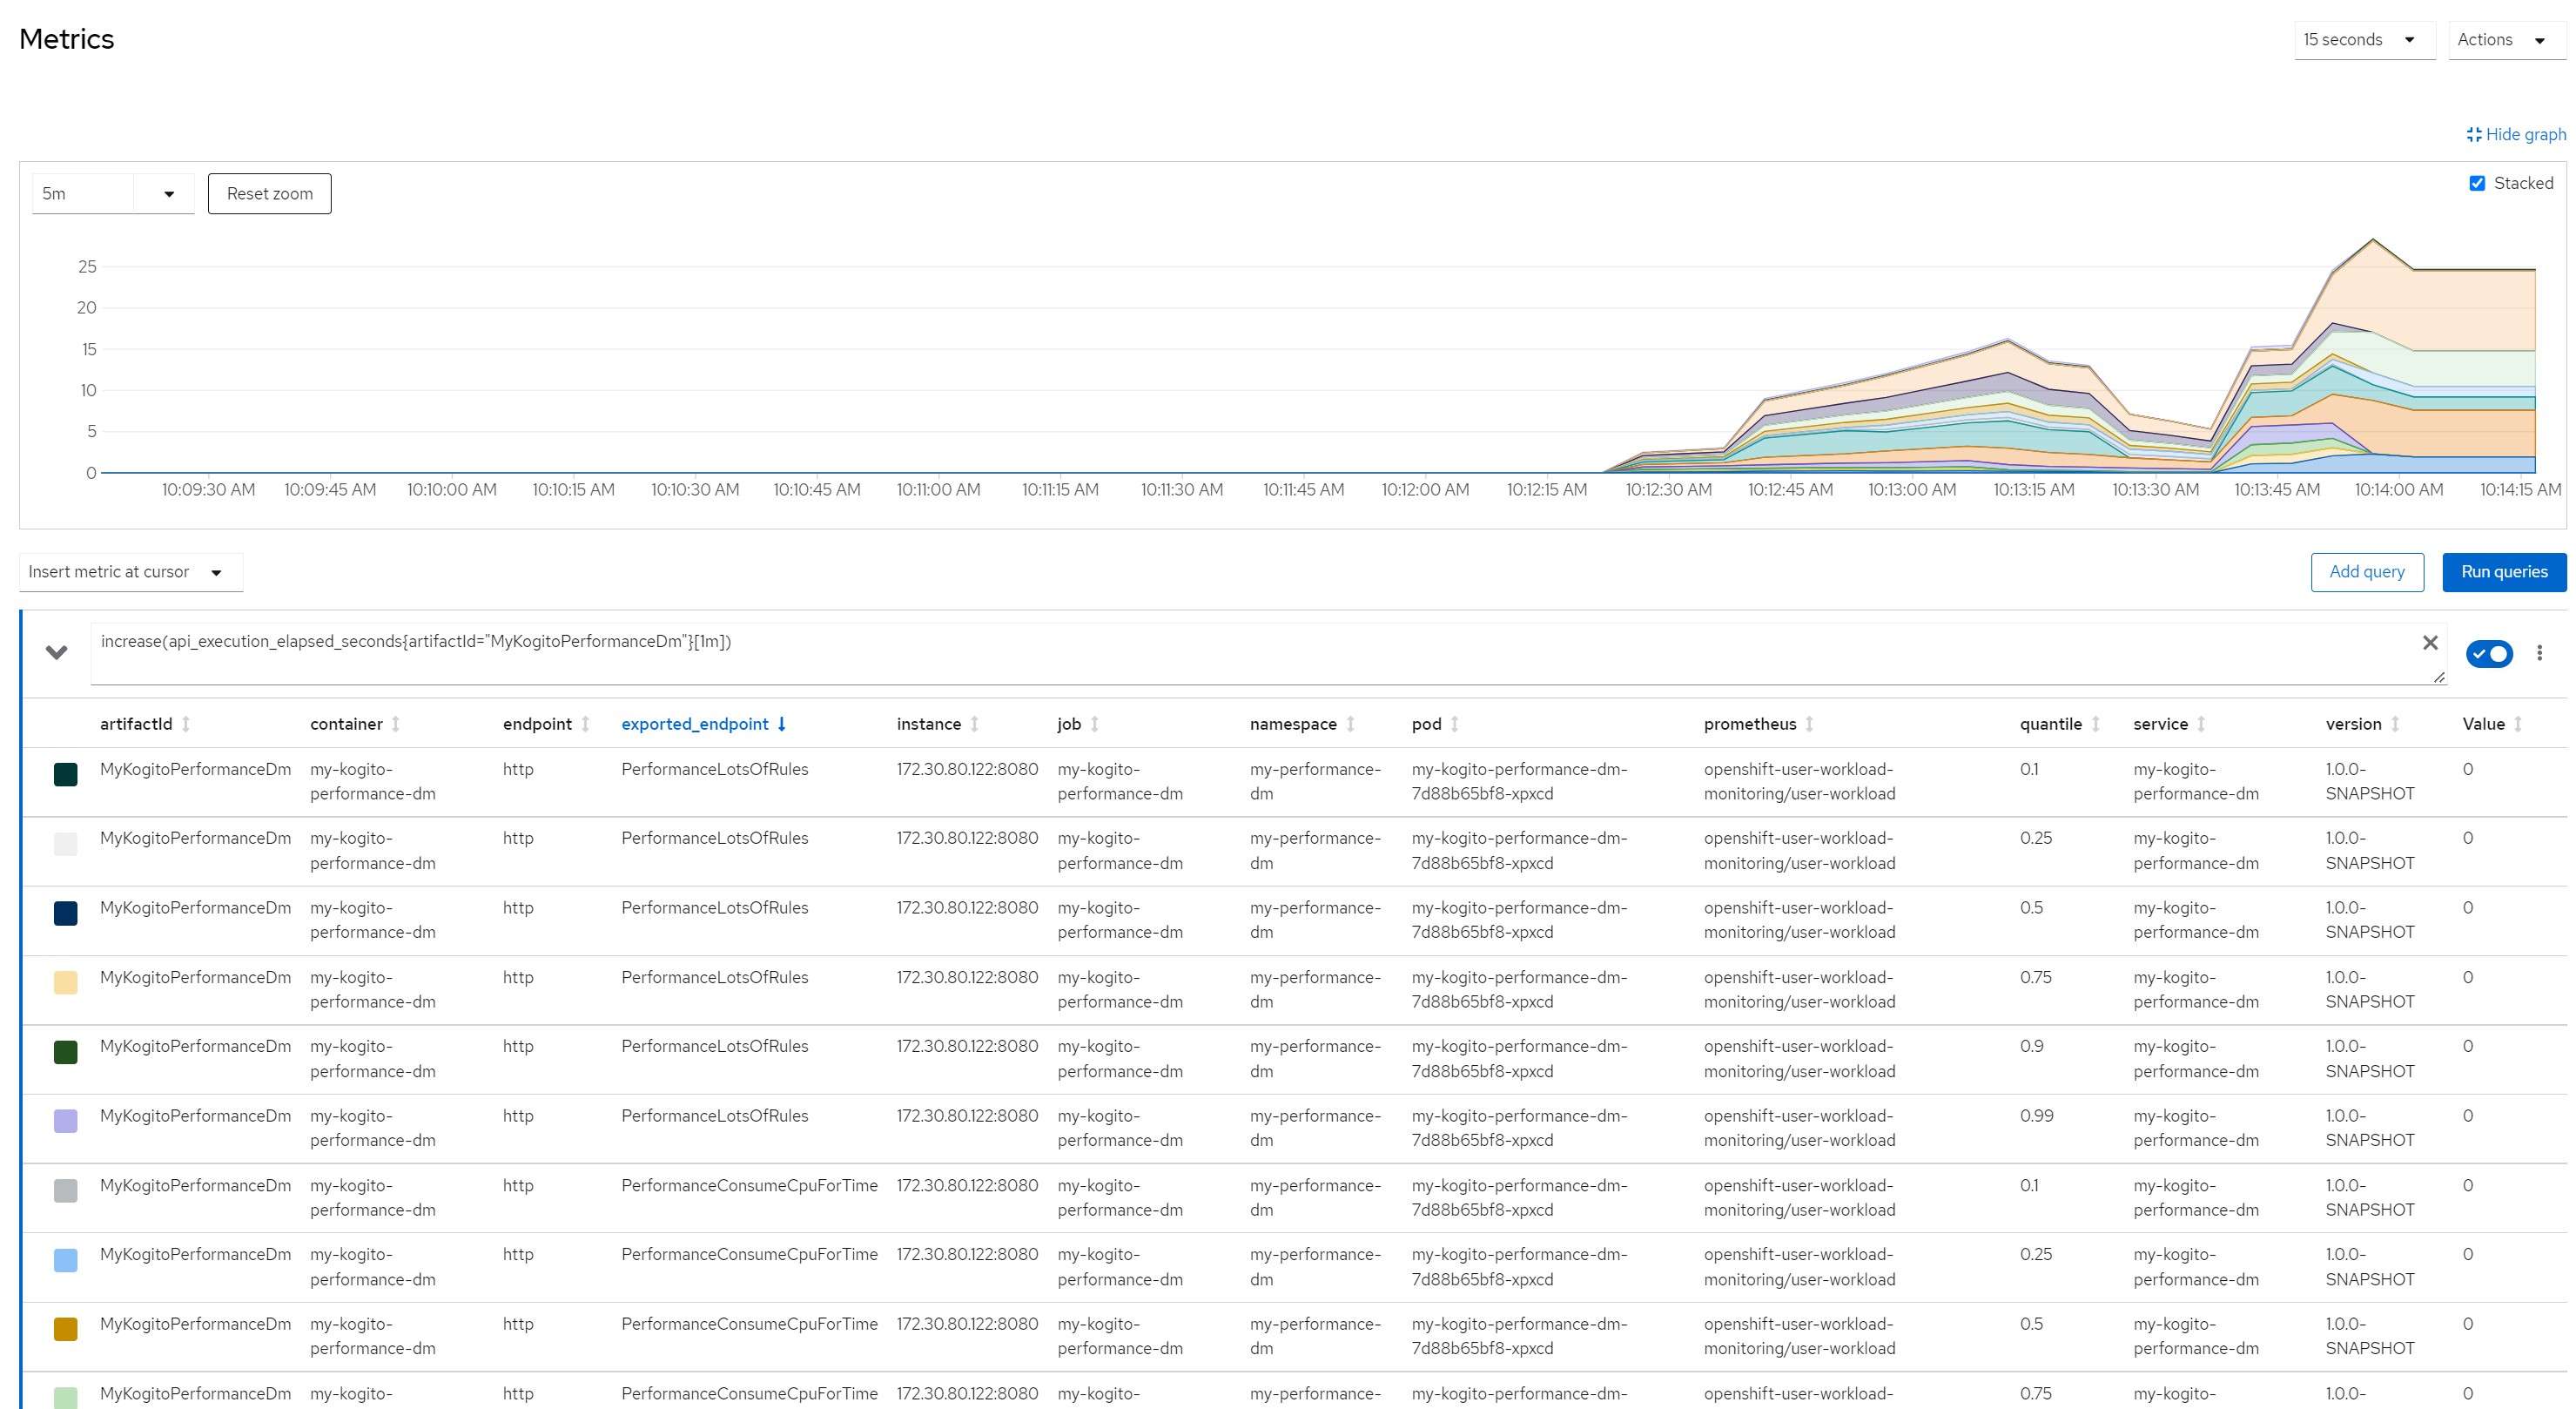
pod:container_cpu_usage:sum{pod='my-kogito-performance-dm-...',namespace='my-performance-dm'}quantile for most consumed time in the last minute
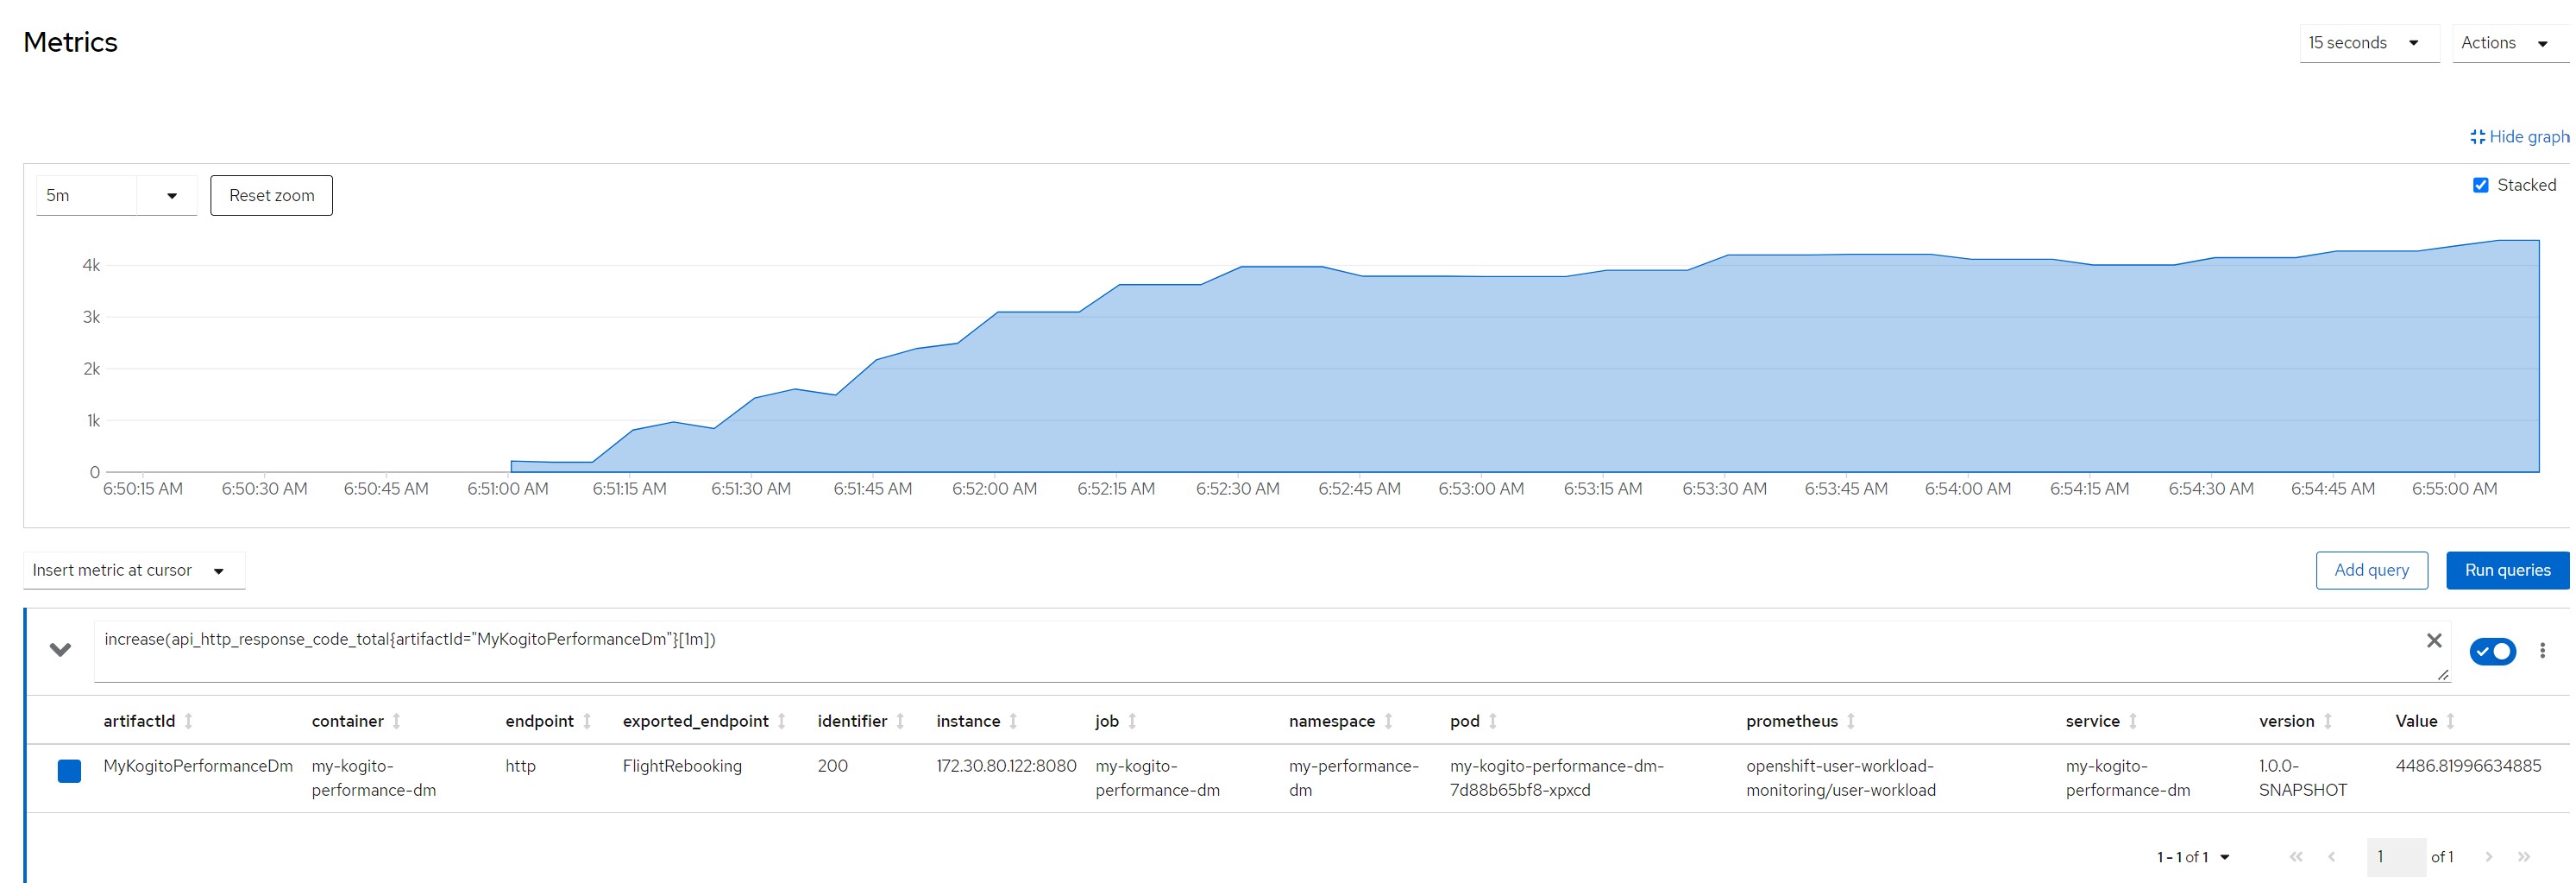
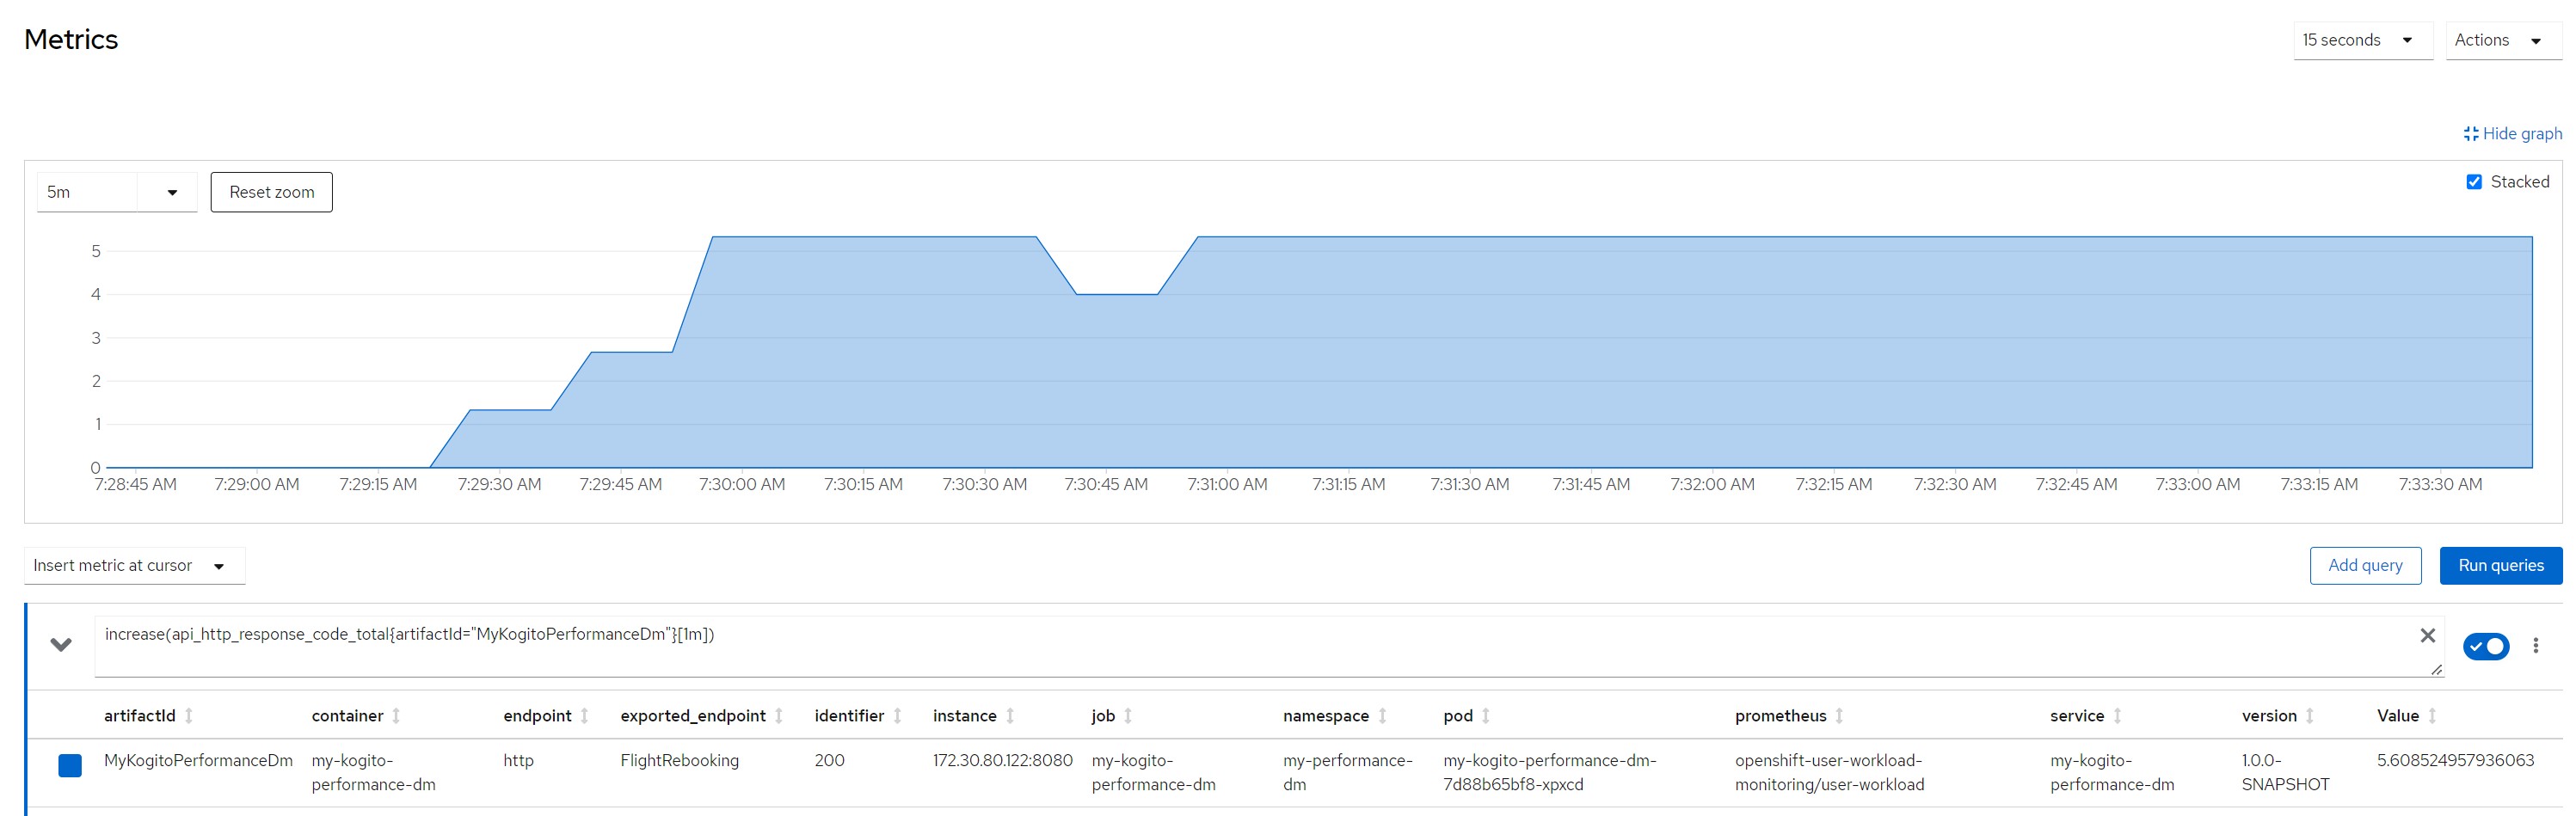
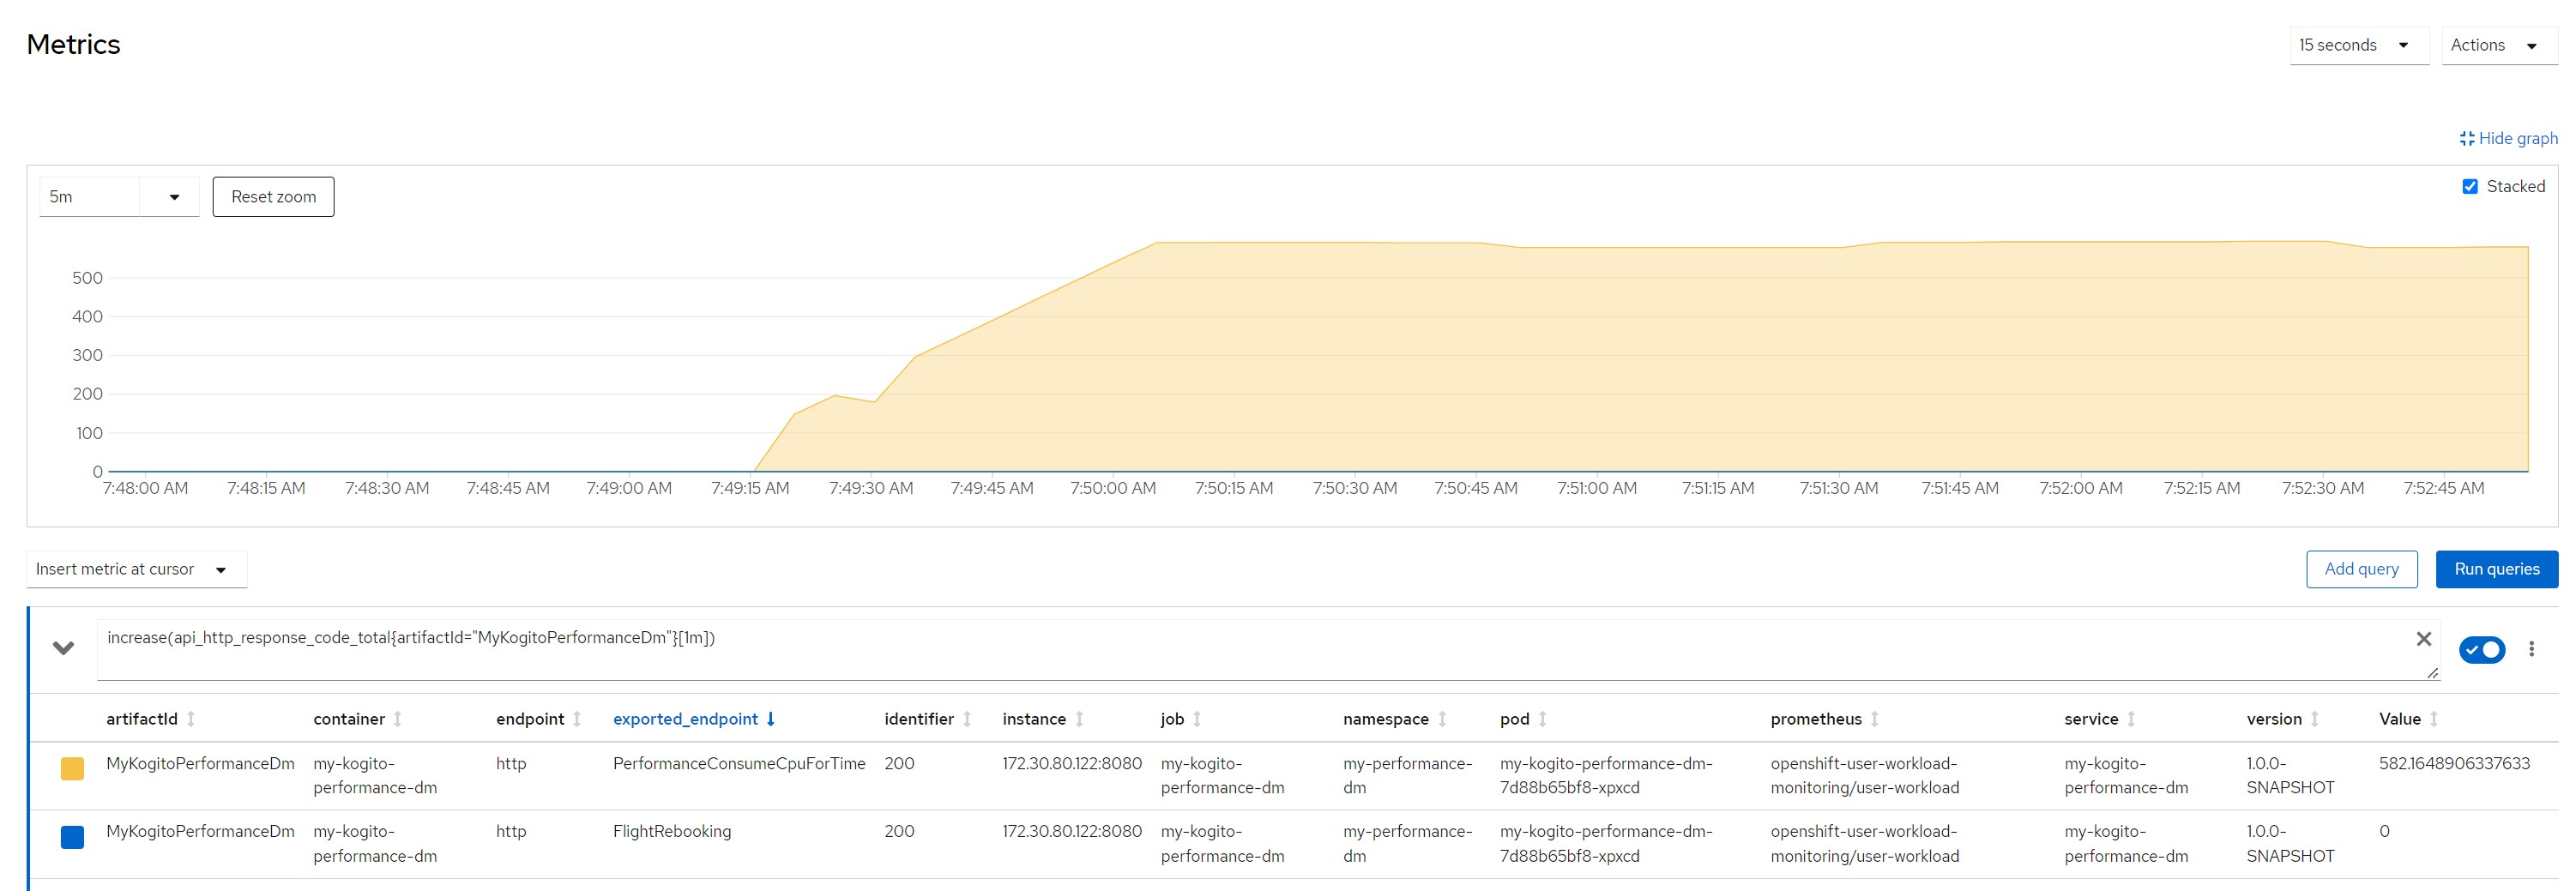
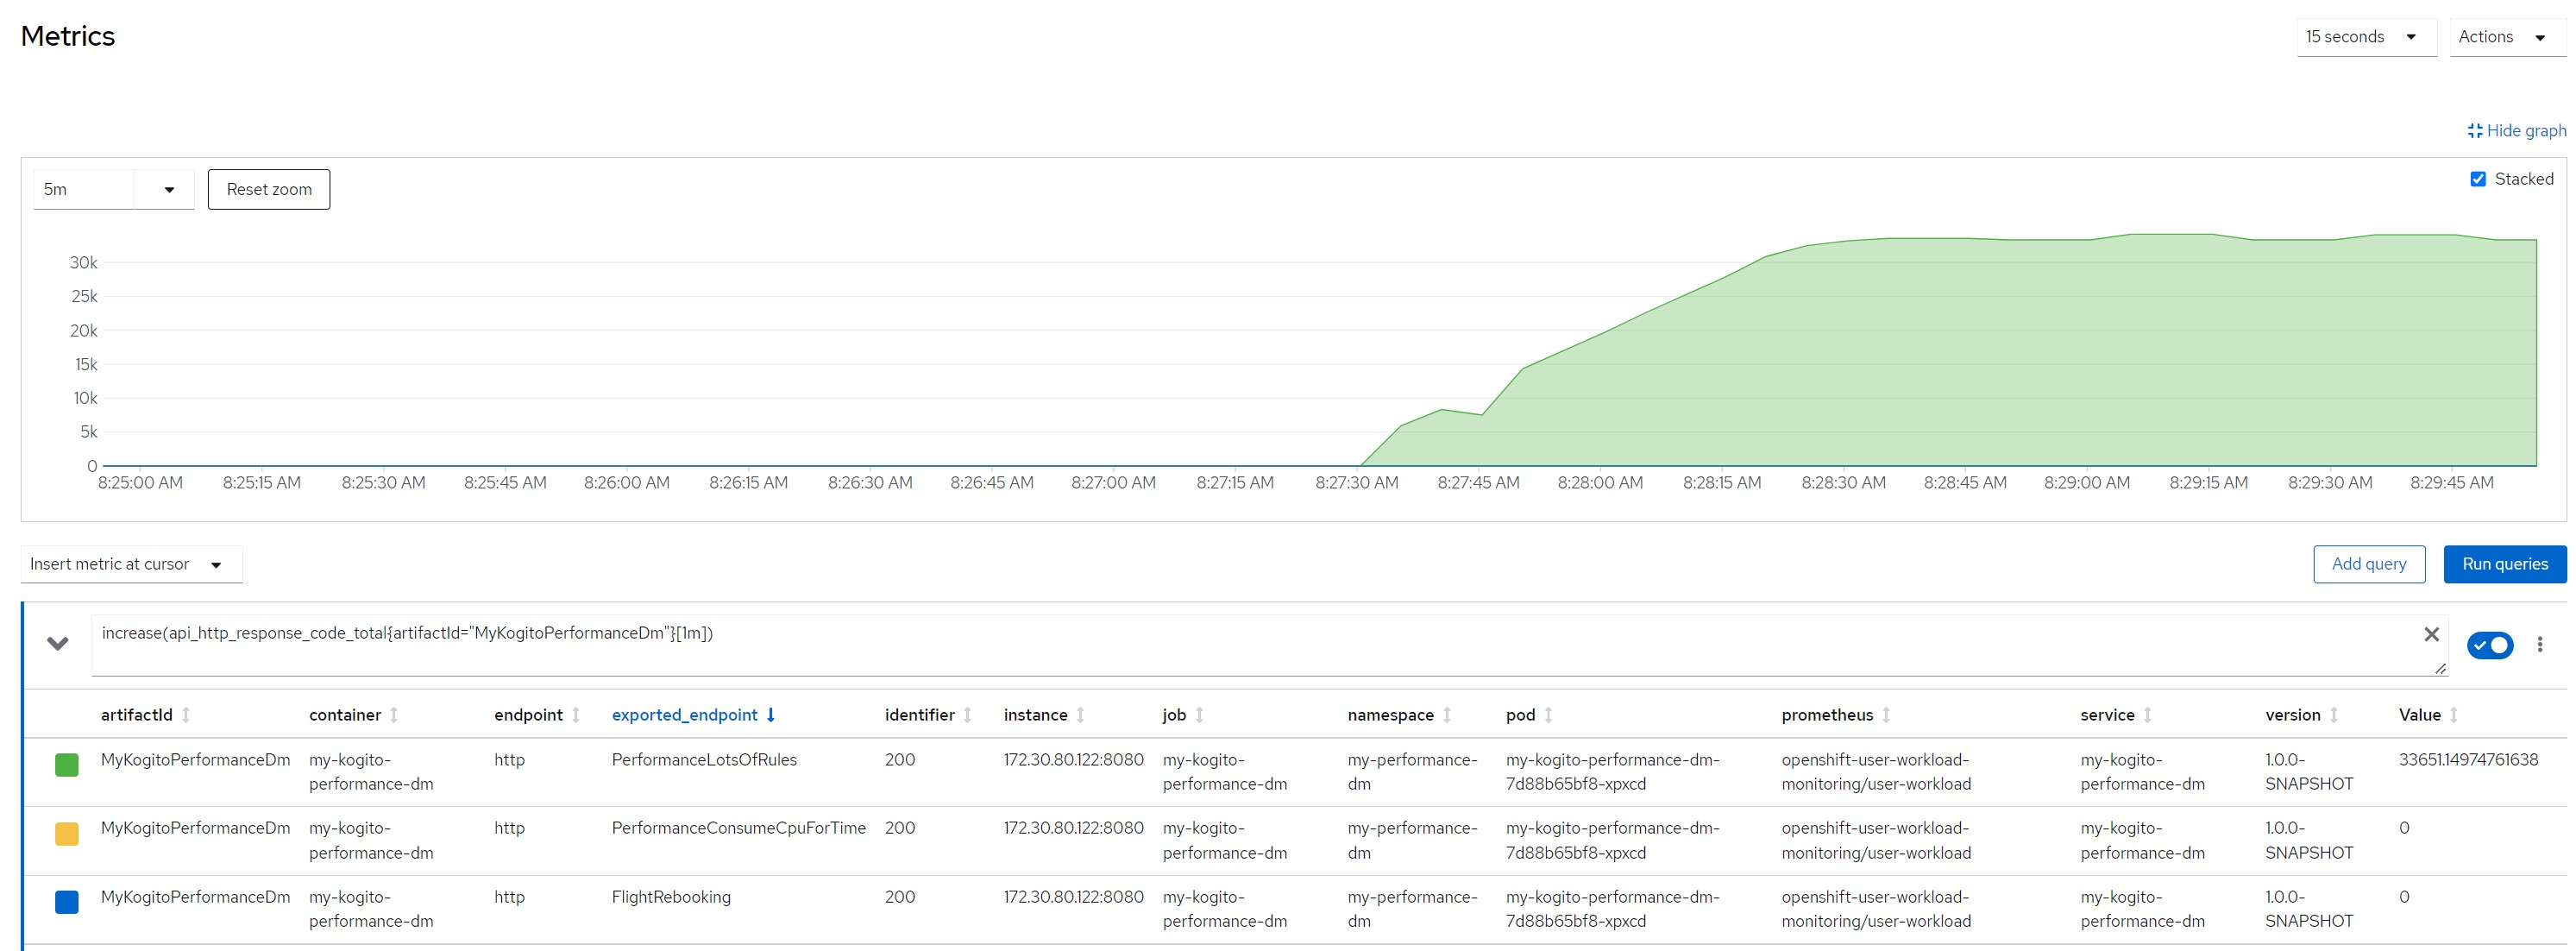
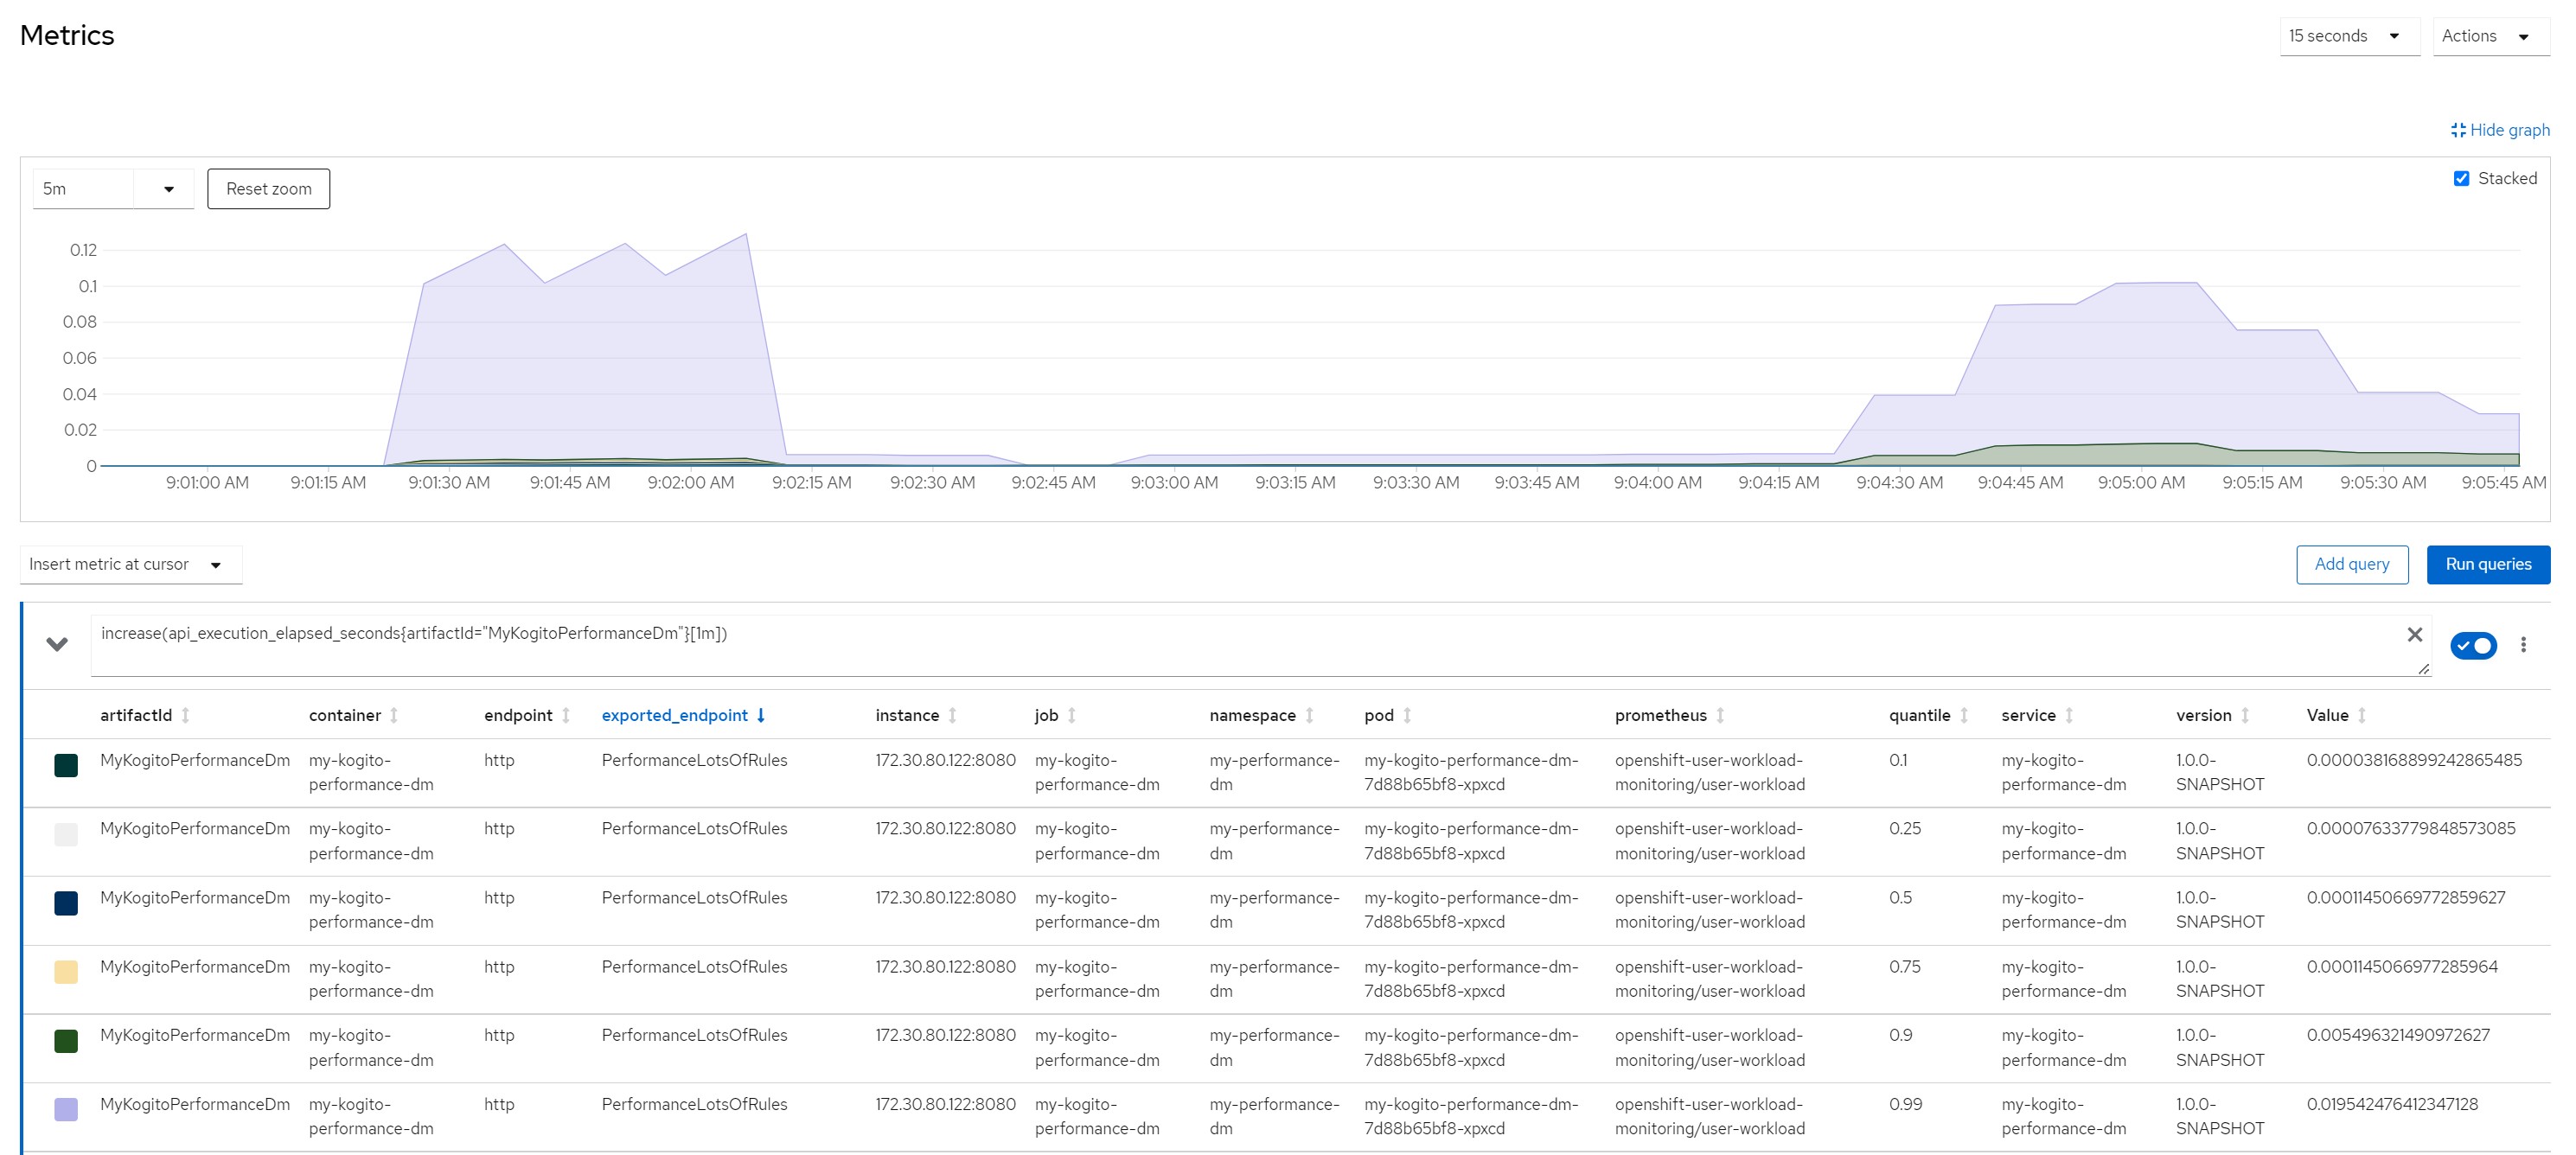
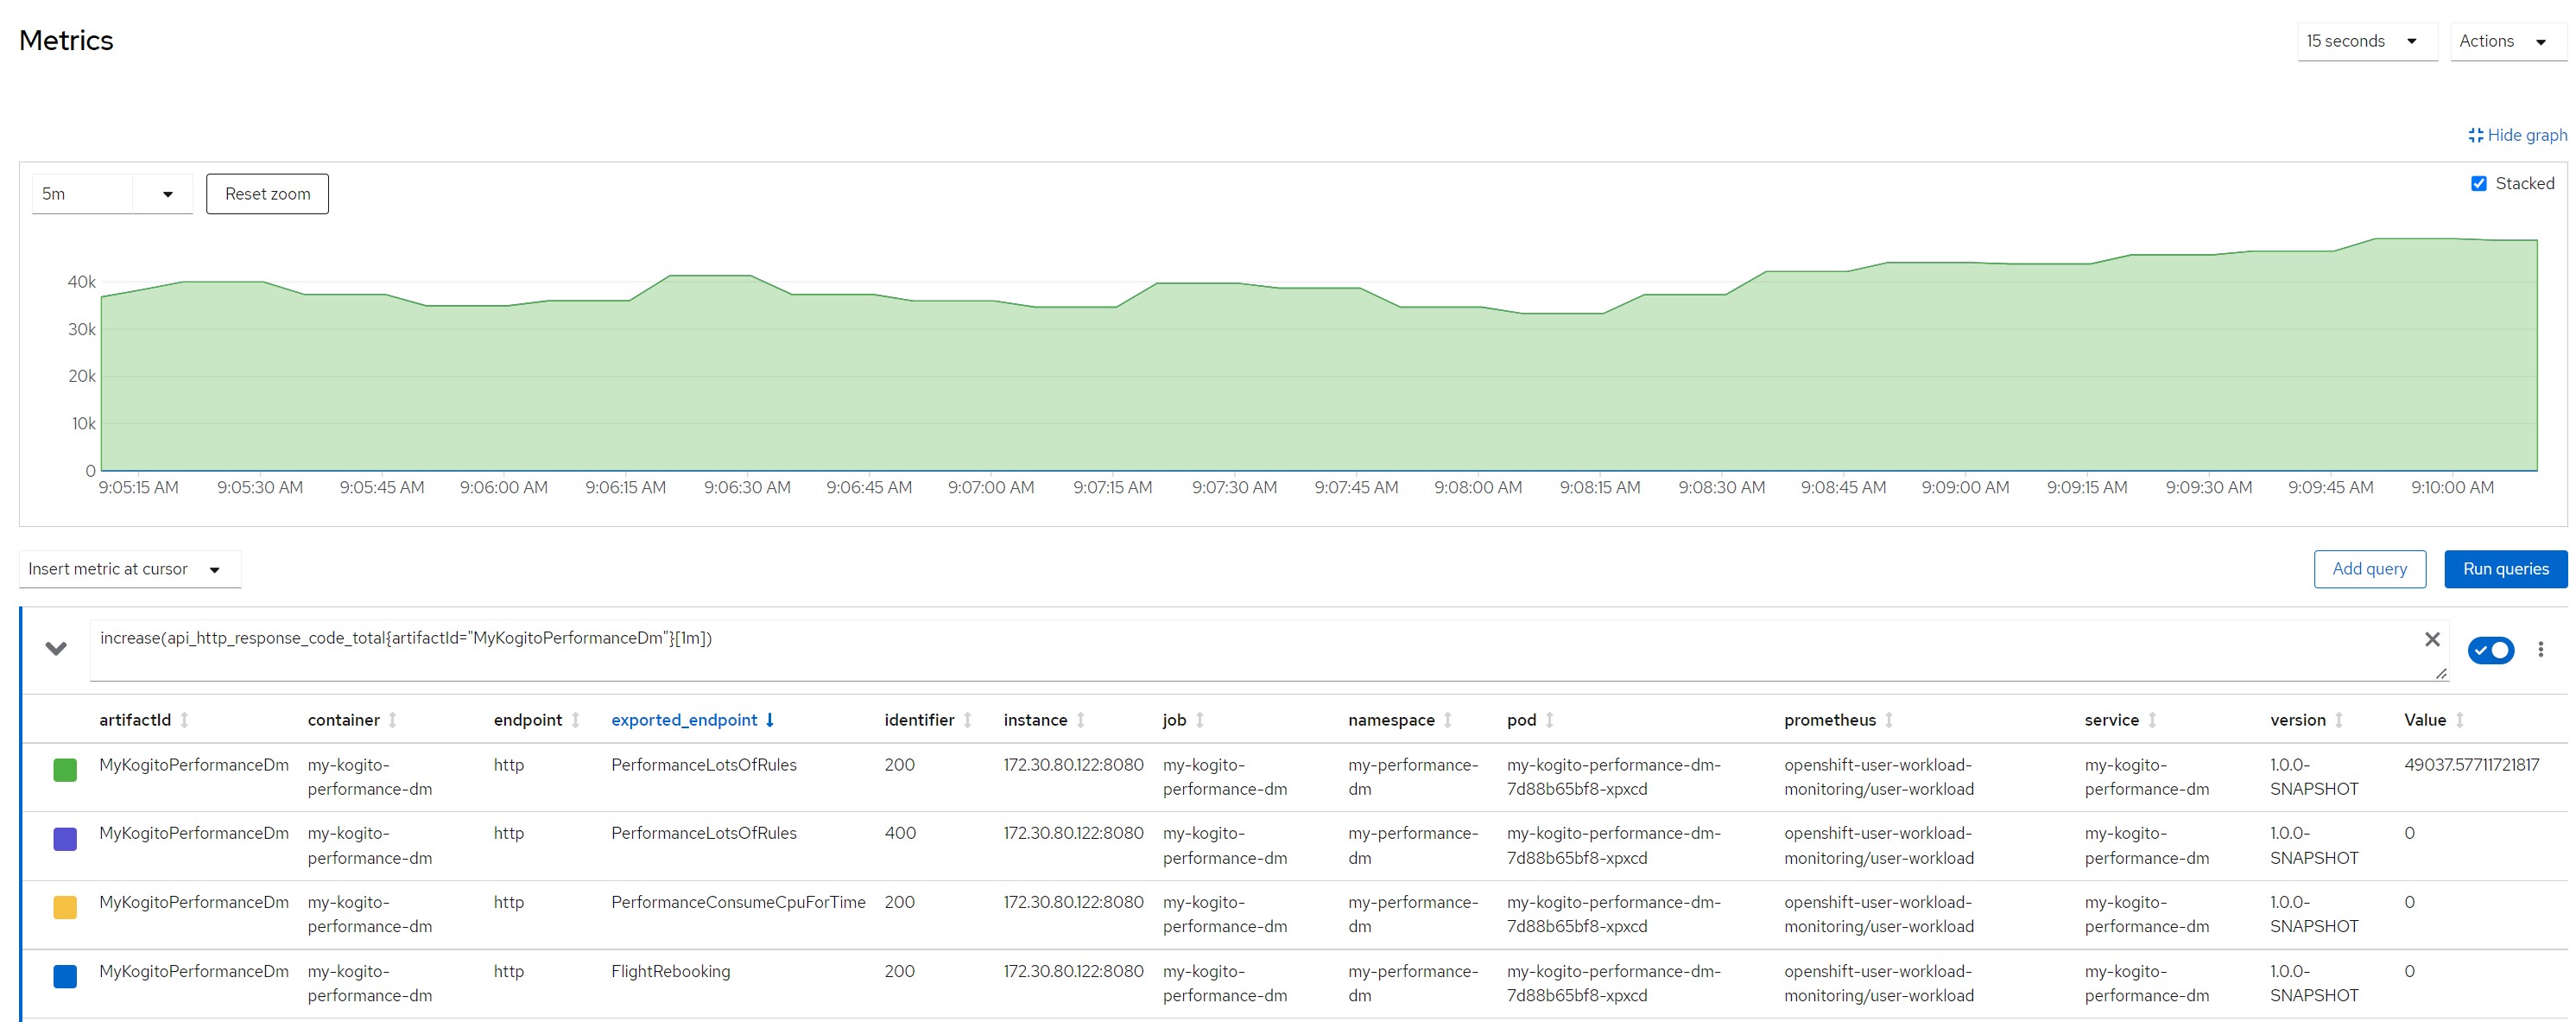
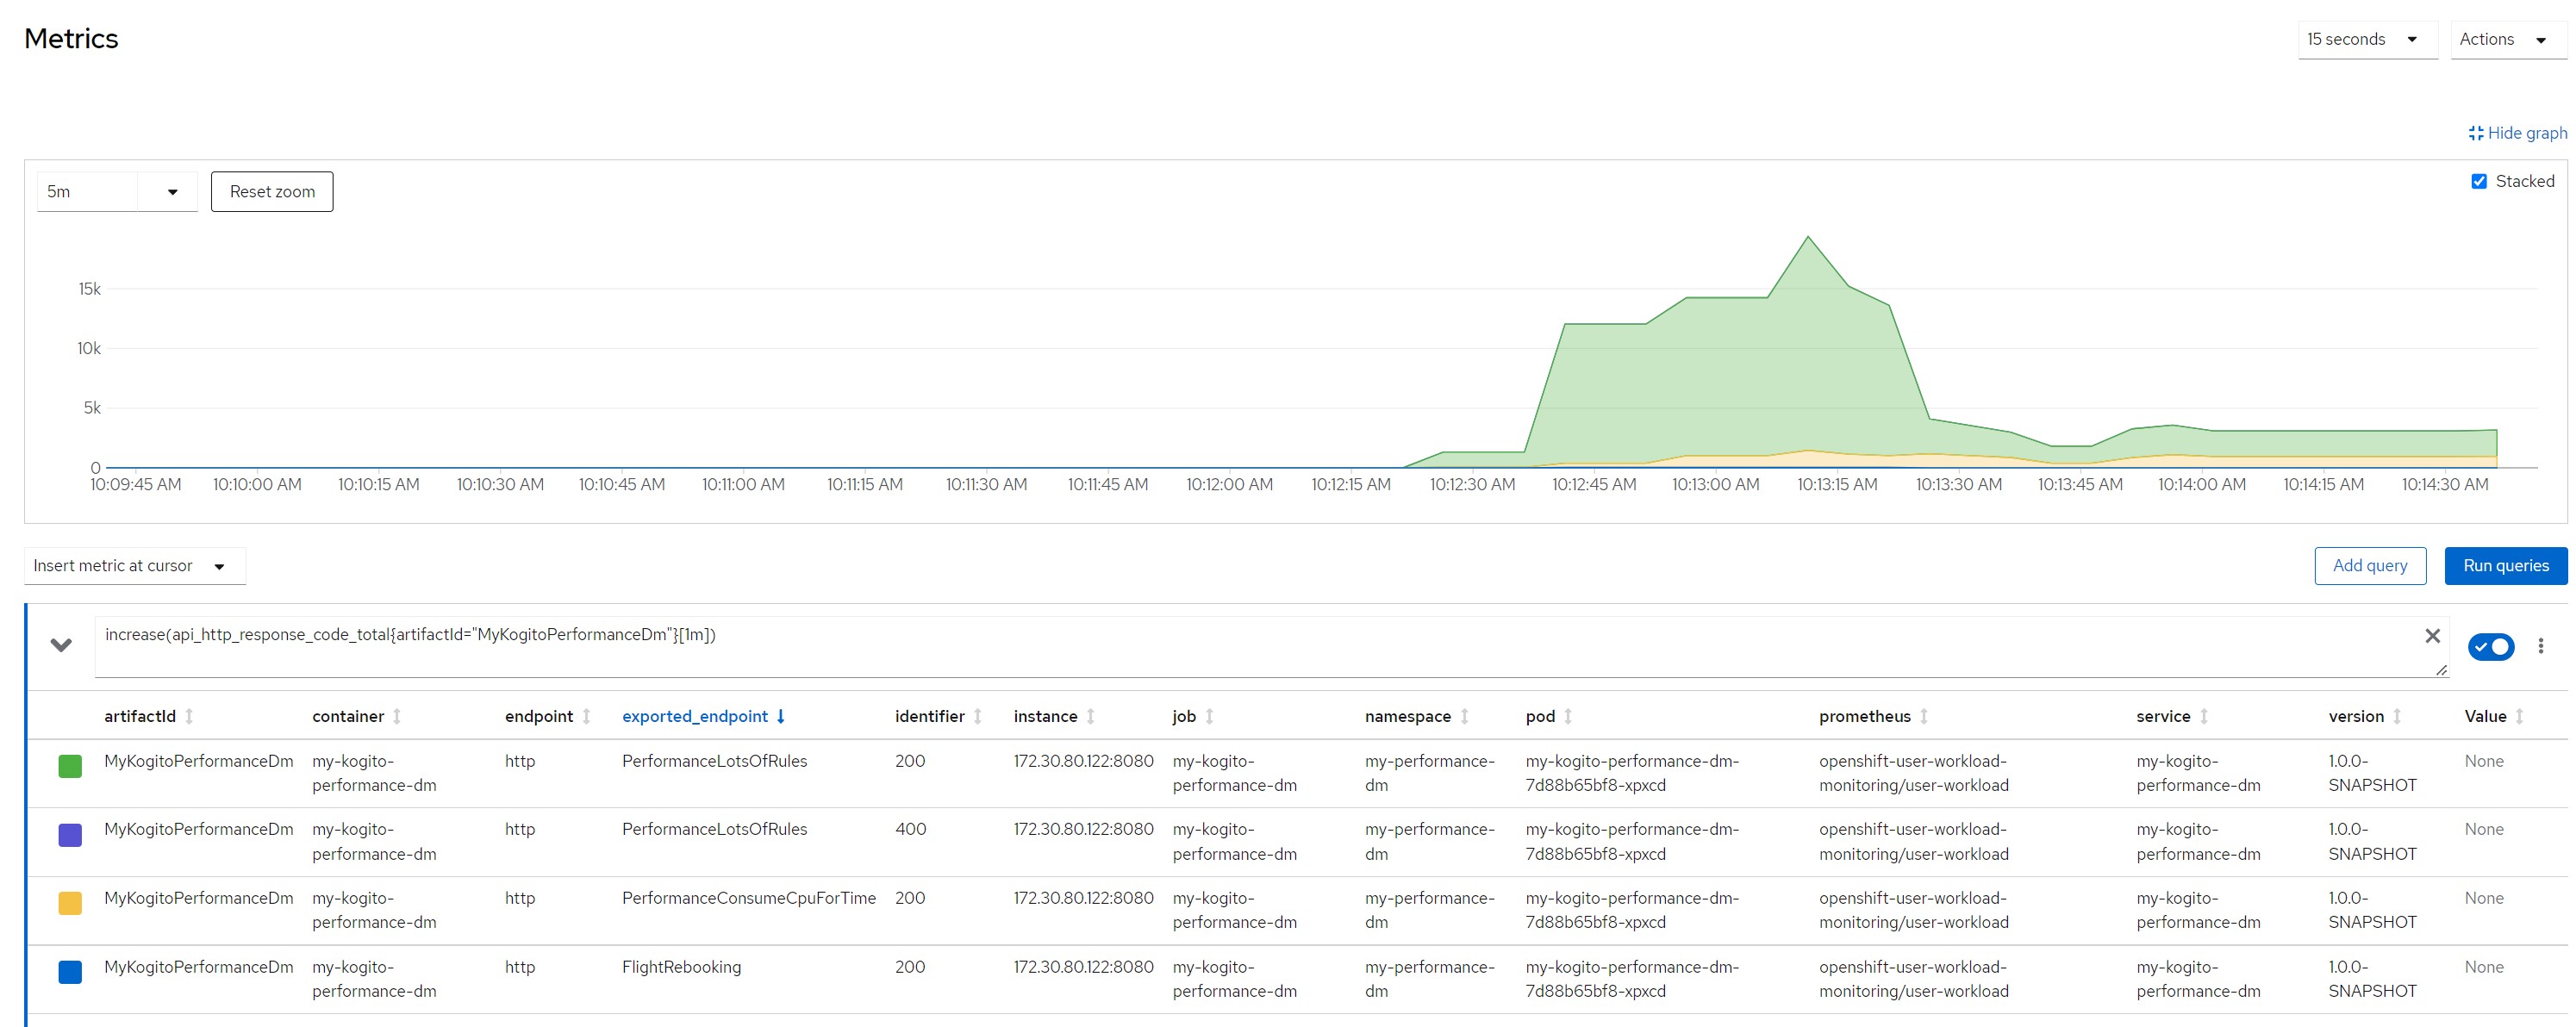
increase(api_execution_elapsed_seconds{artifactId="MyKogitoPerformanceDm"}[1m]) number of http calls in the last minute
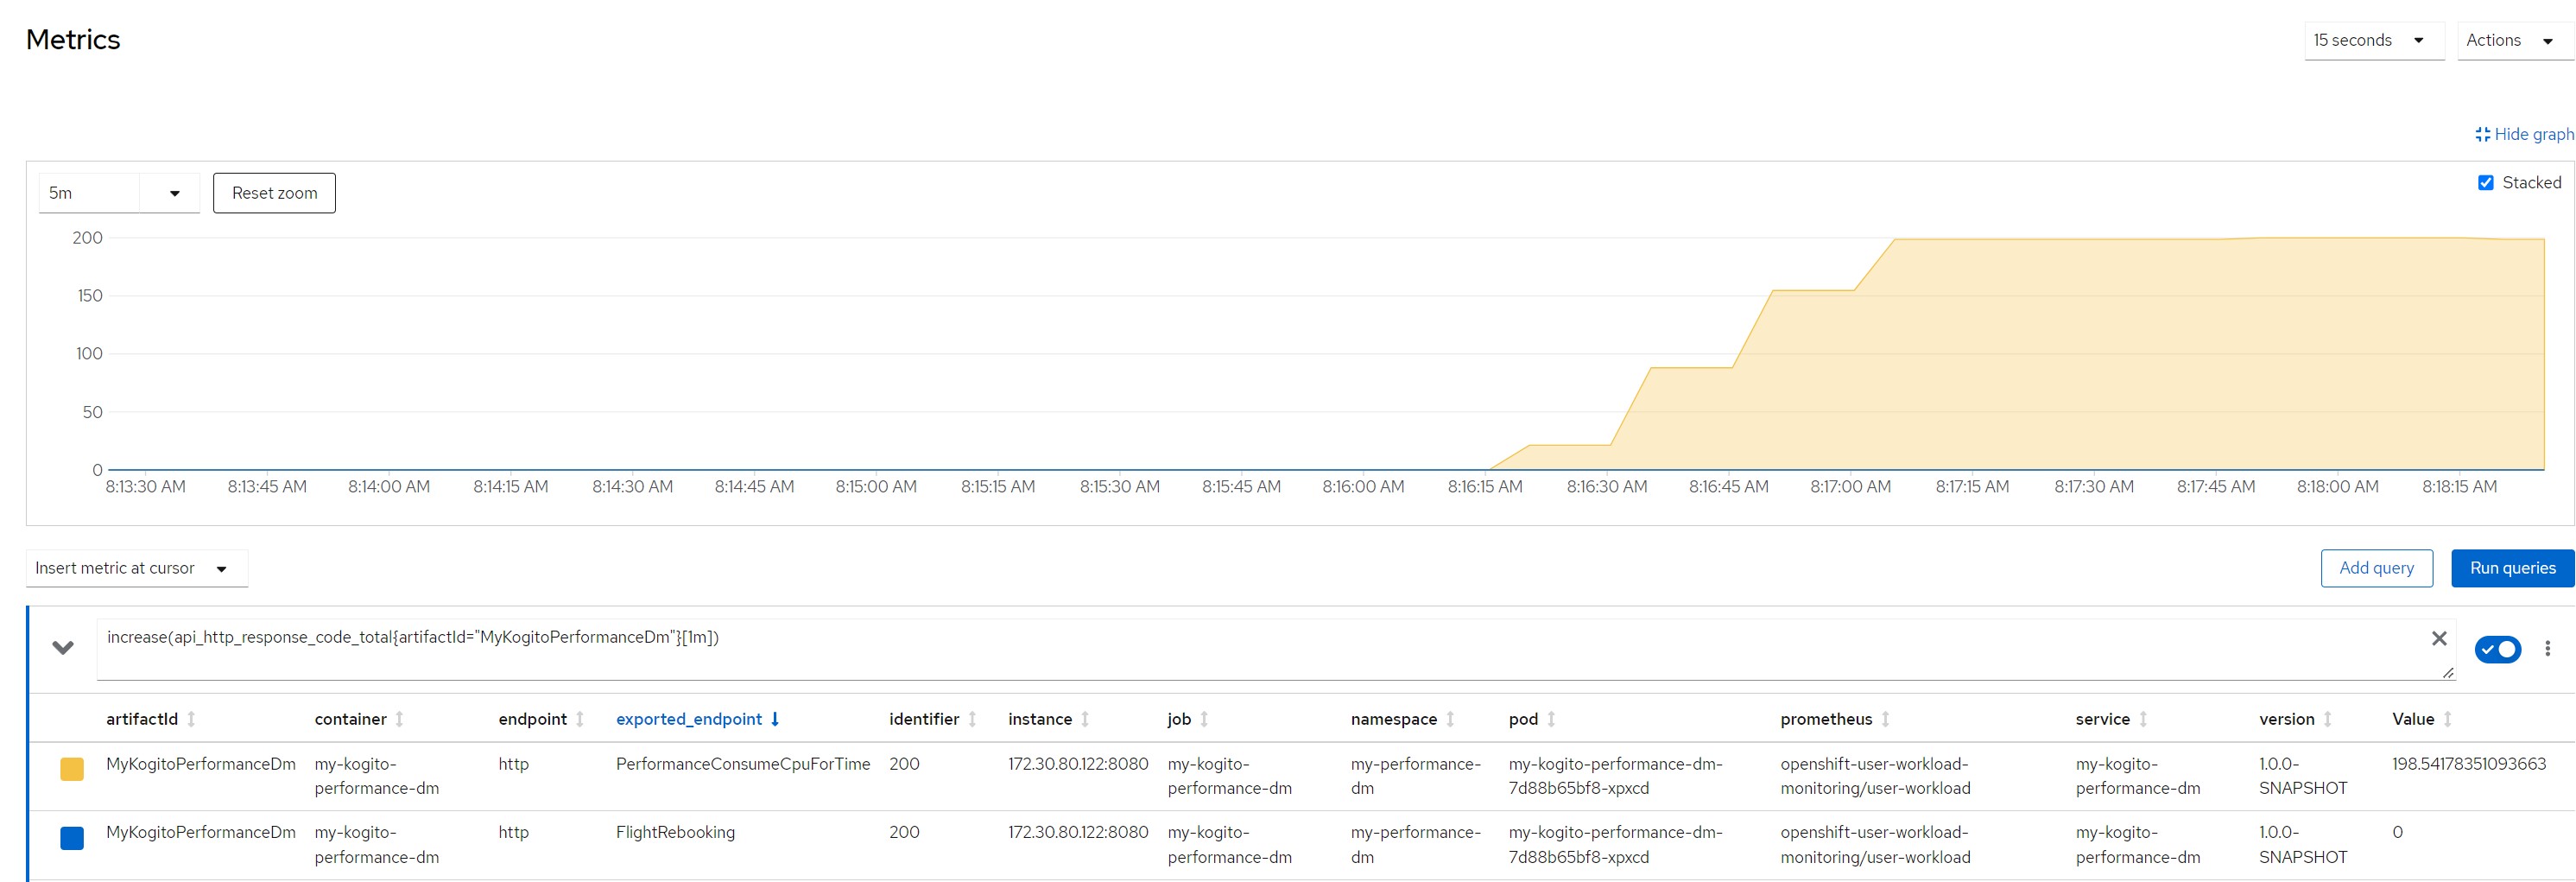
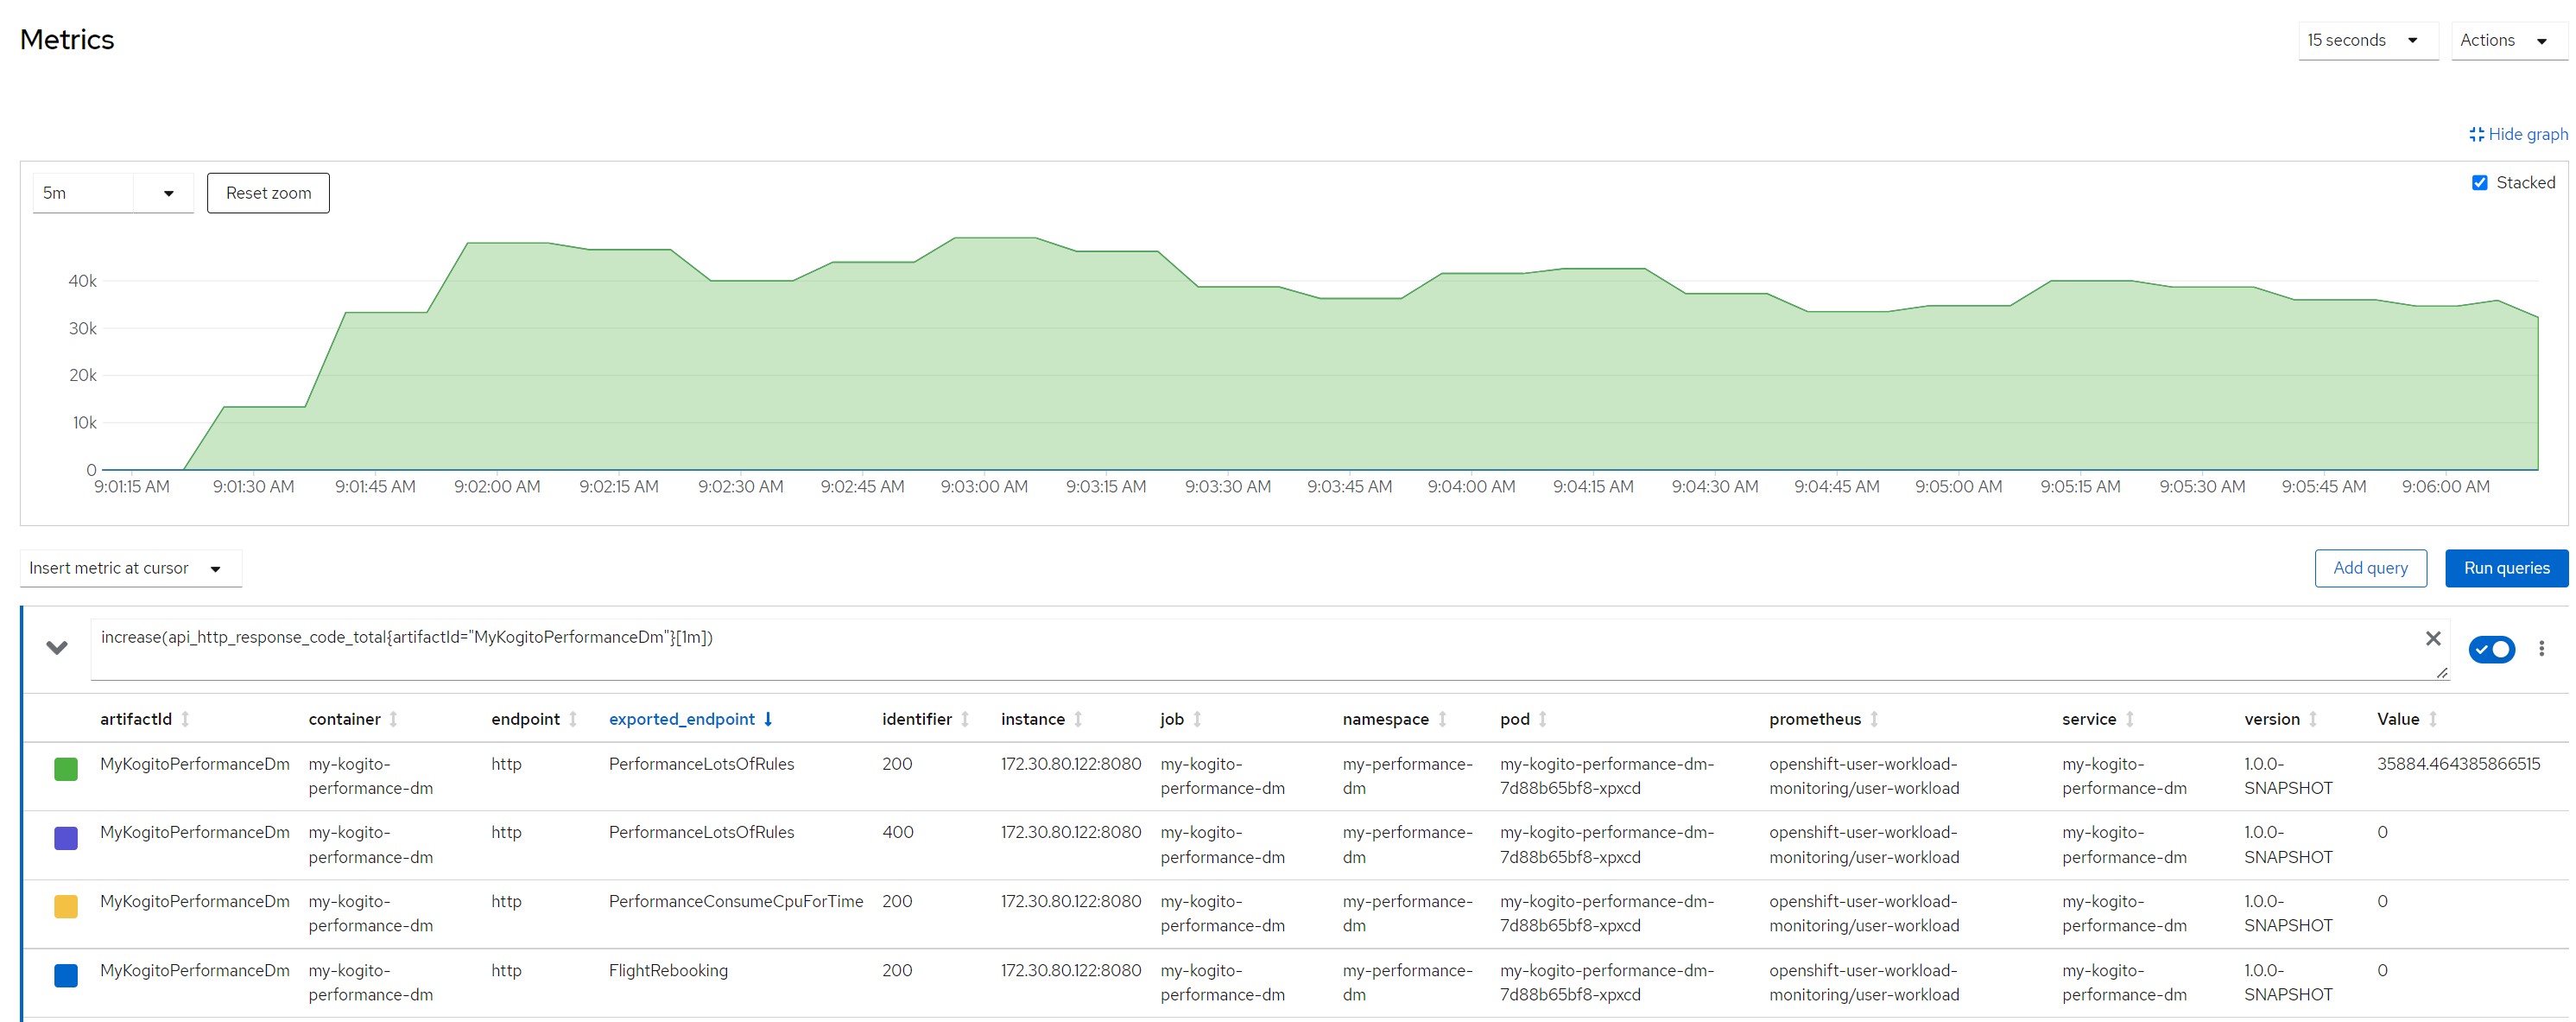
increase(api_http_response_code_total{artifactId="MyKogitoPerformanceDm"}[1m])Measurement resultsScenario 1Payload for scenario 13 flights of which one canceled and two scheduled, 10 passengers booked on a canceled flight and reassigned to flights still scheduled
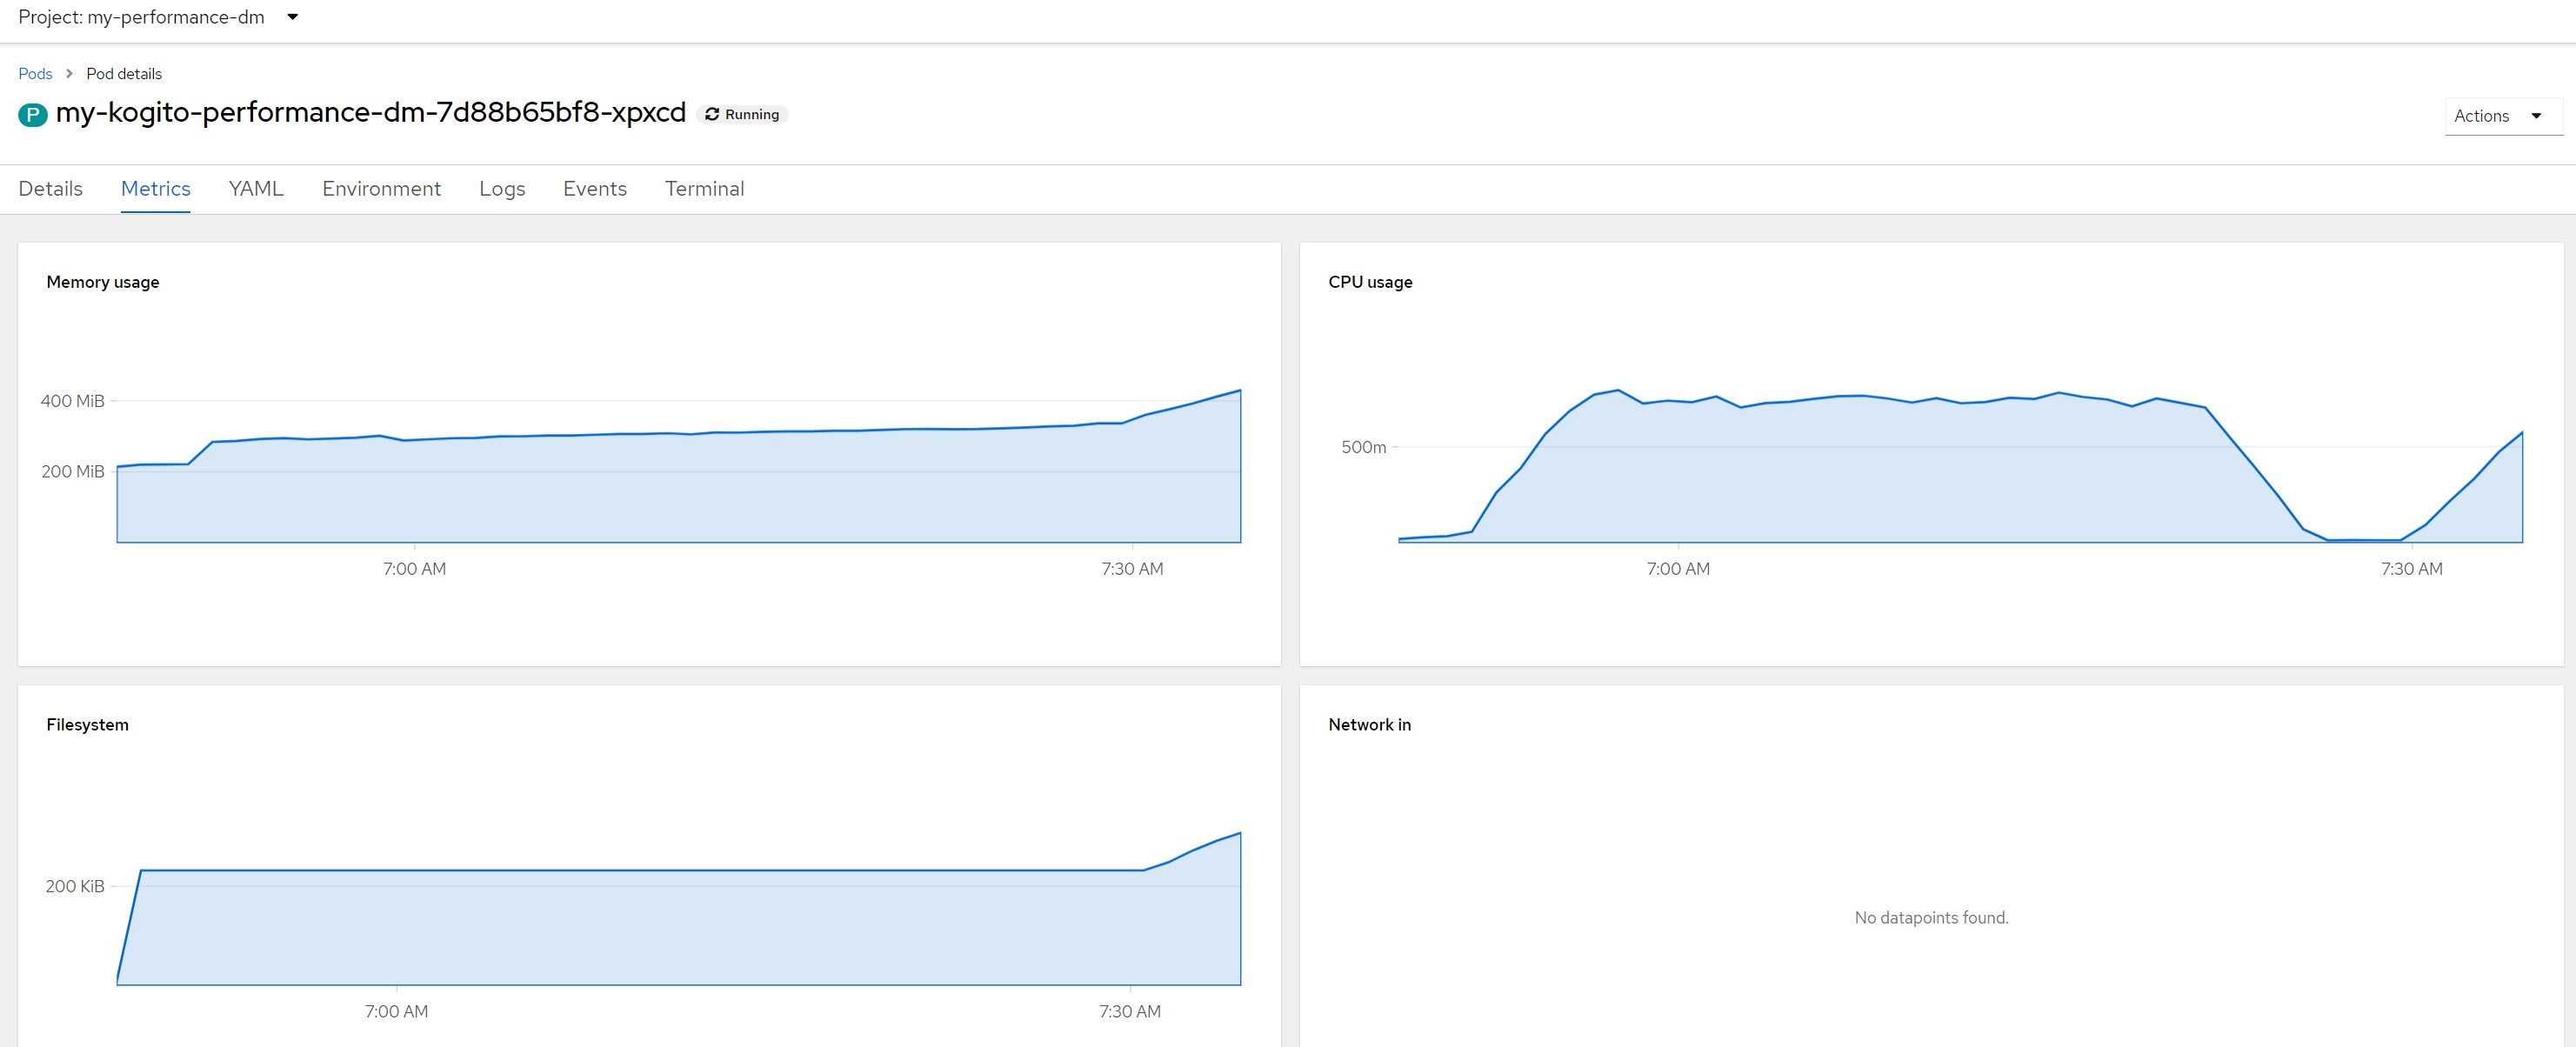
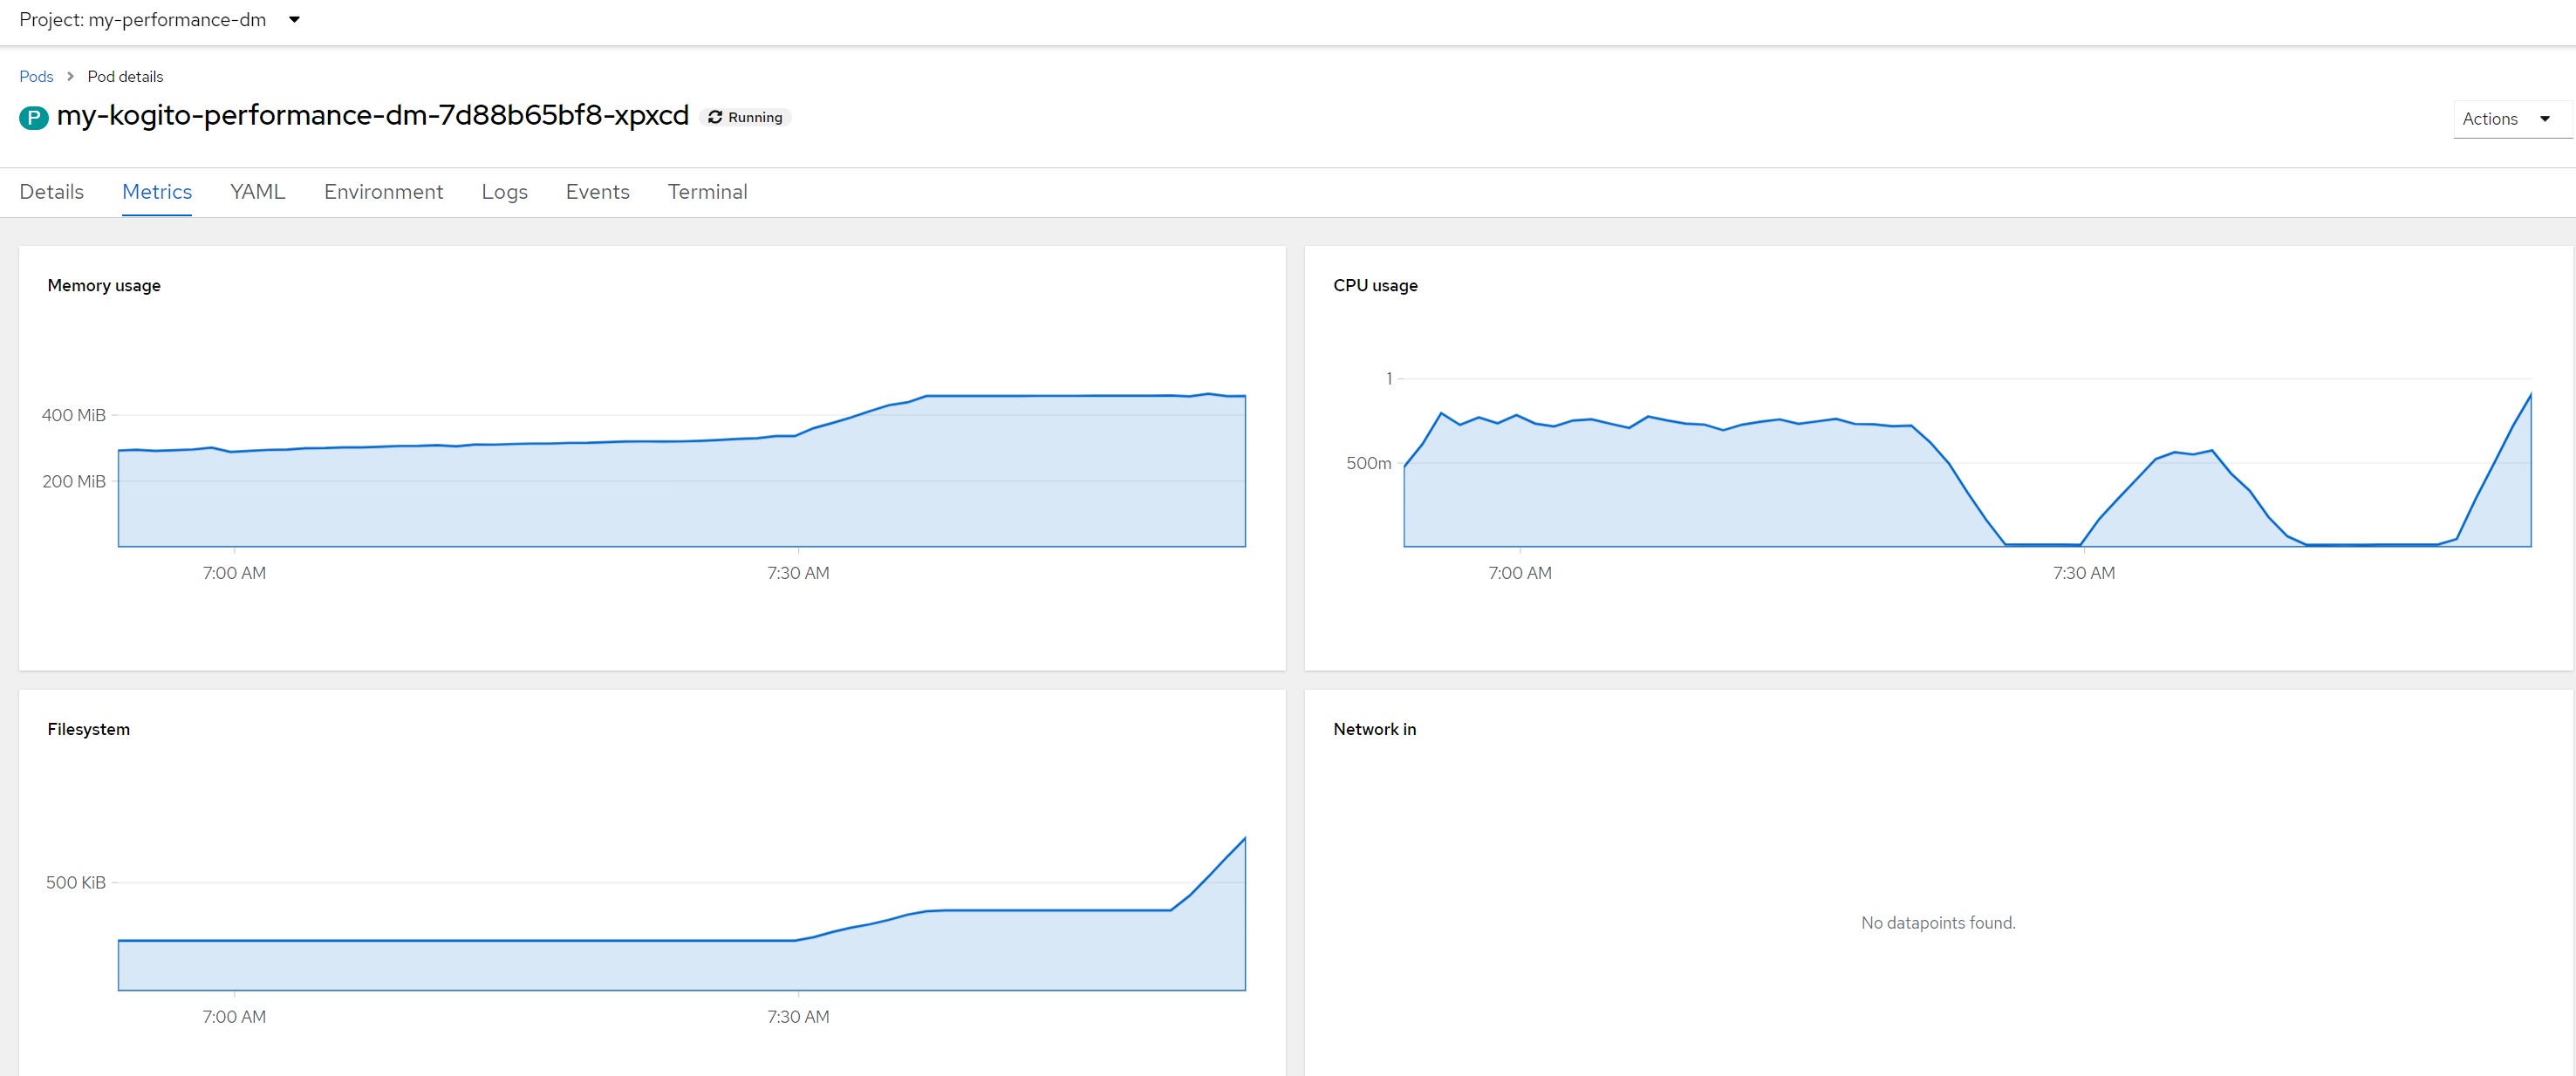
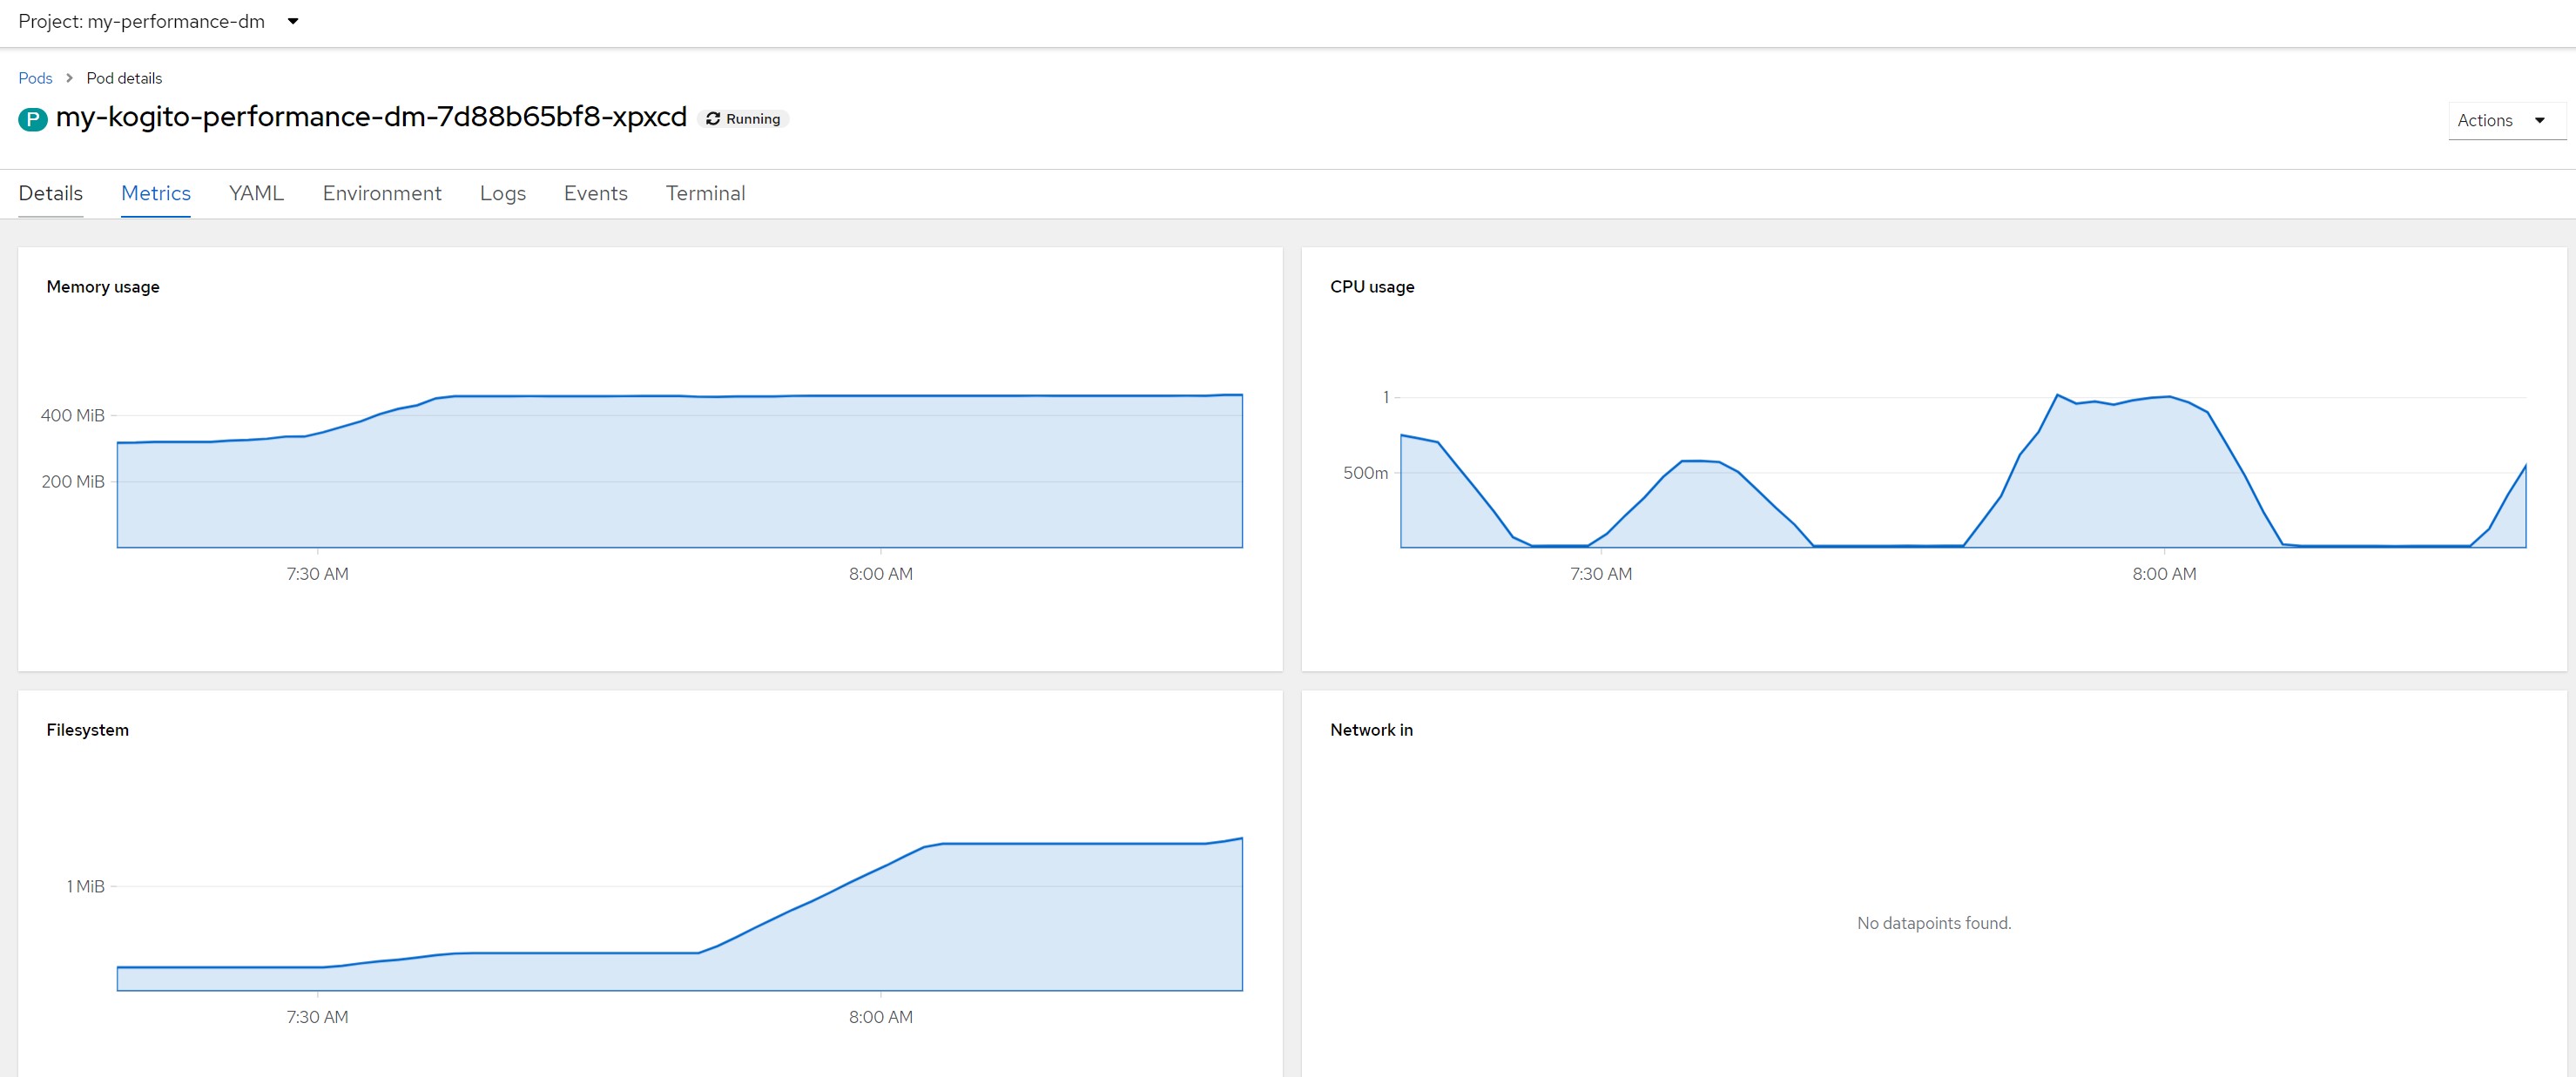
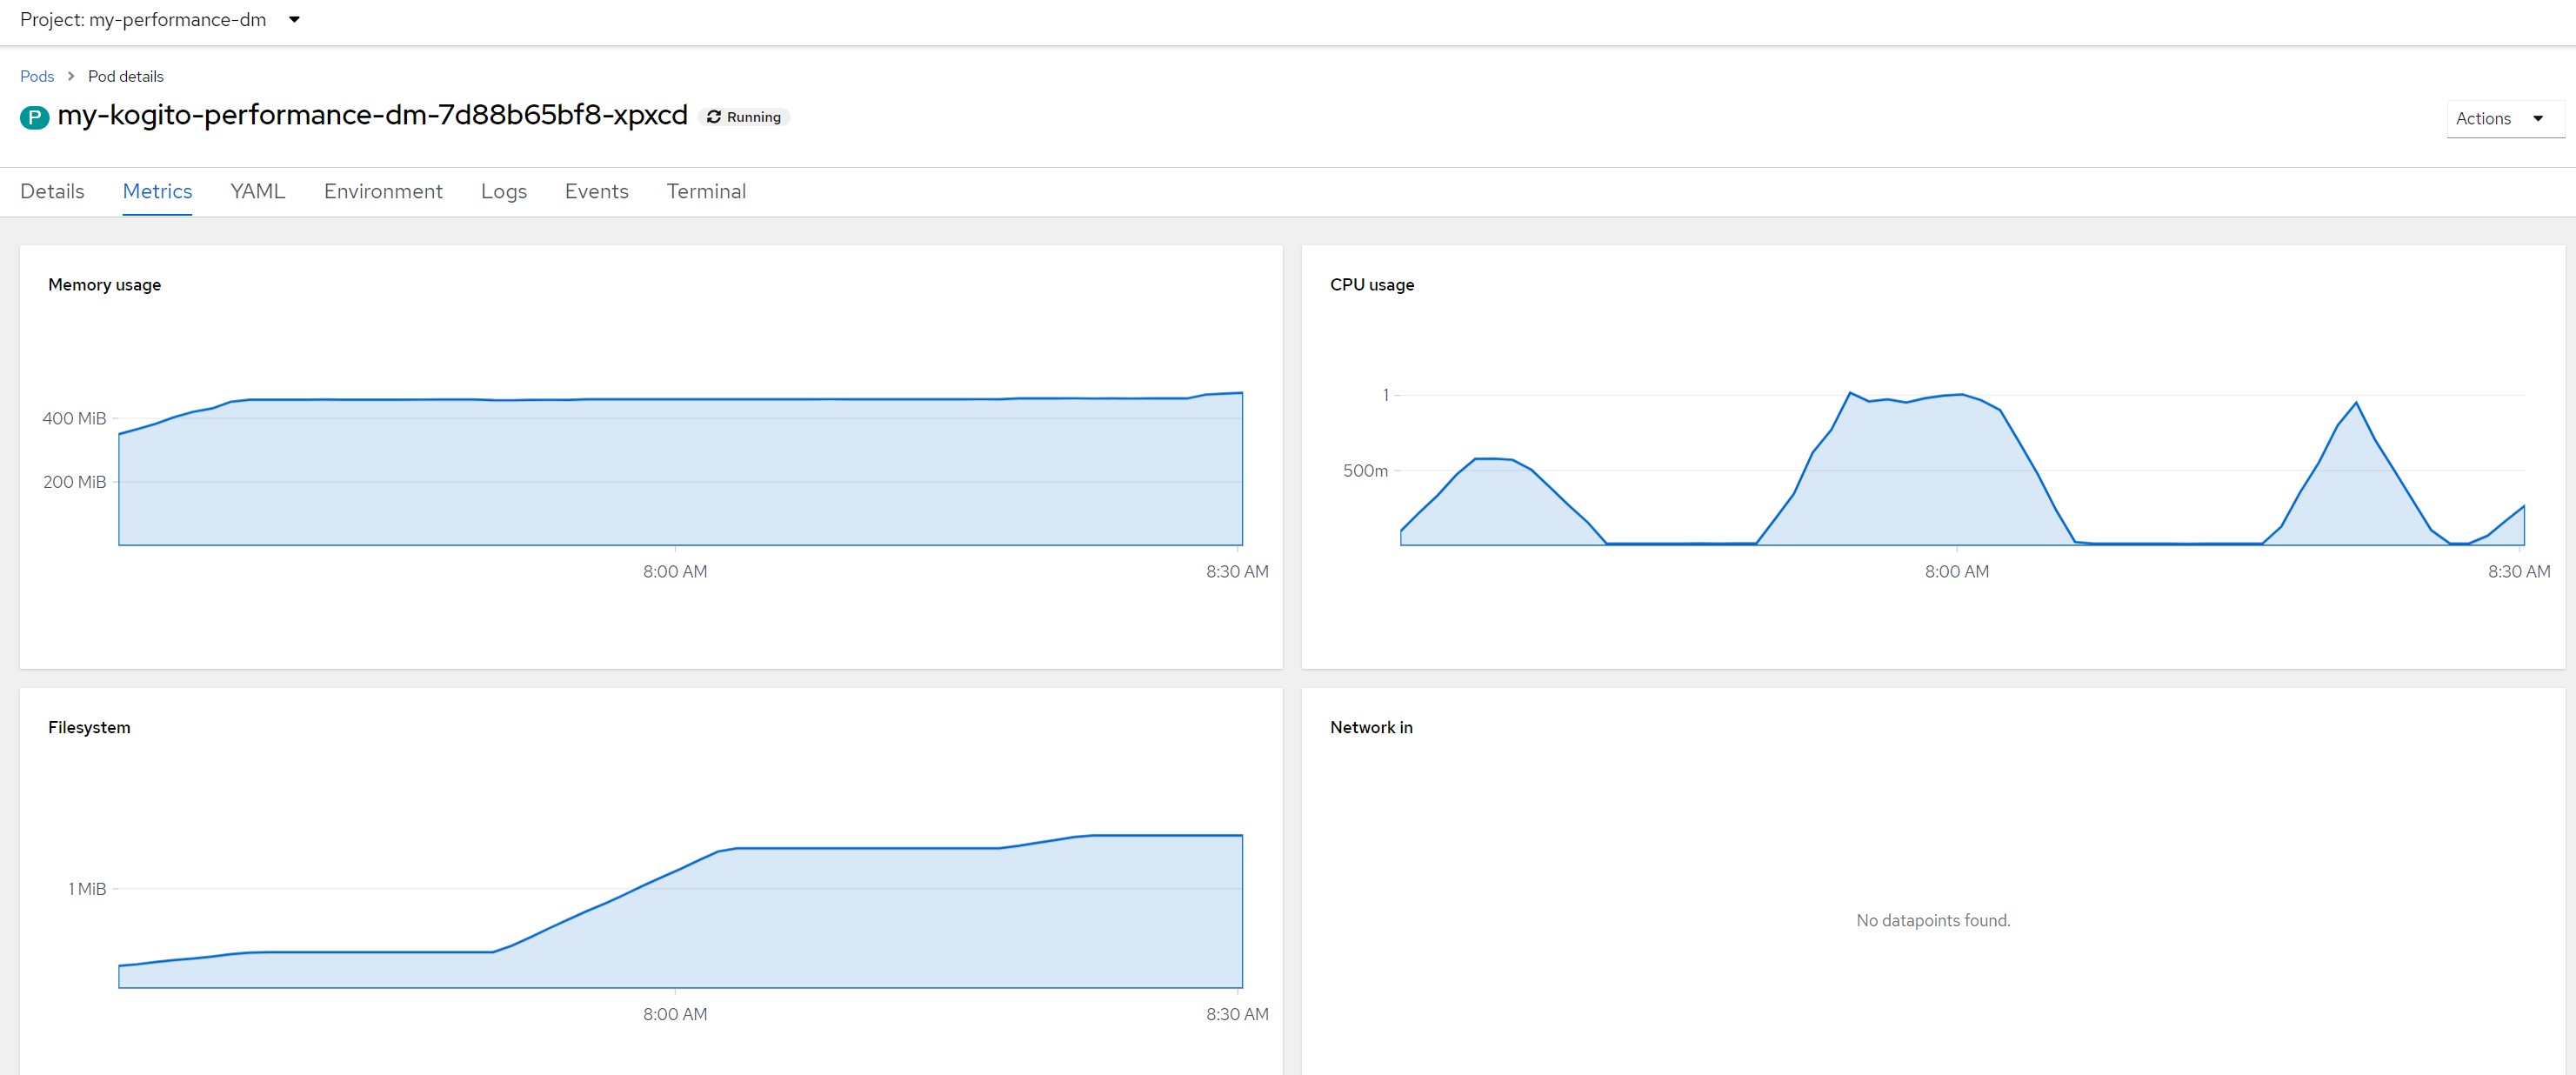
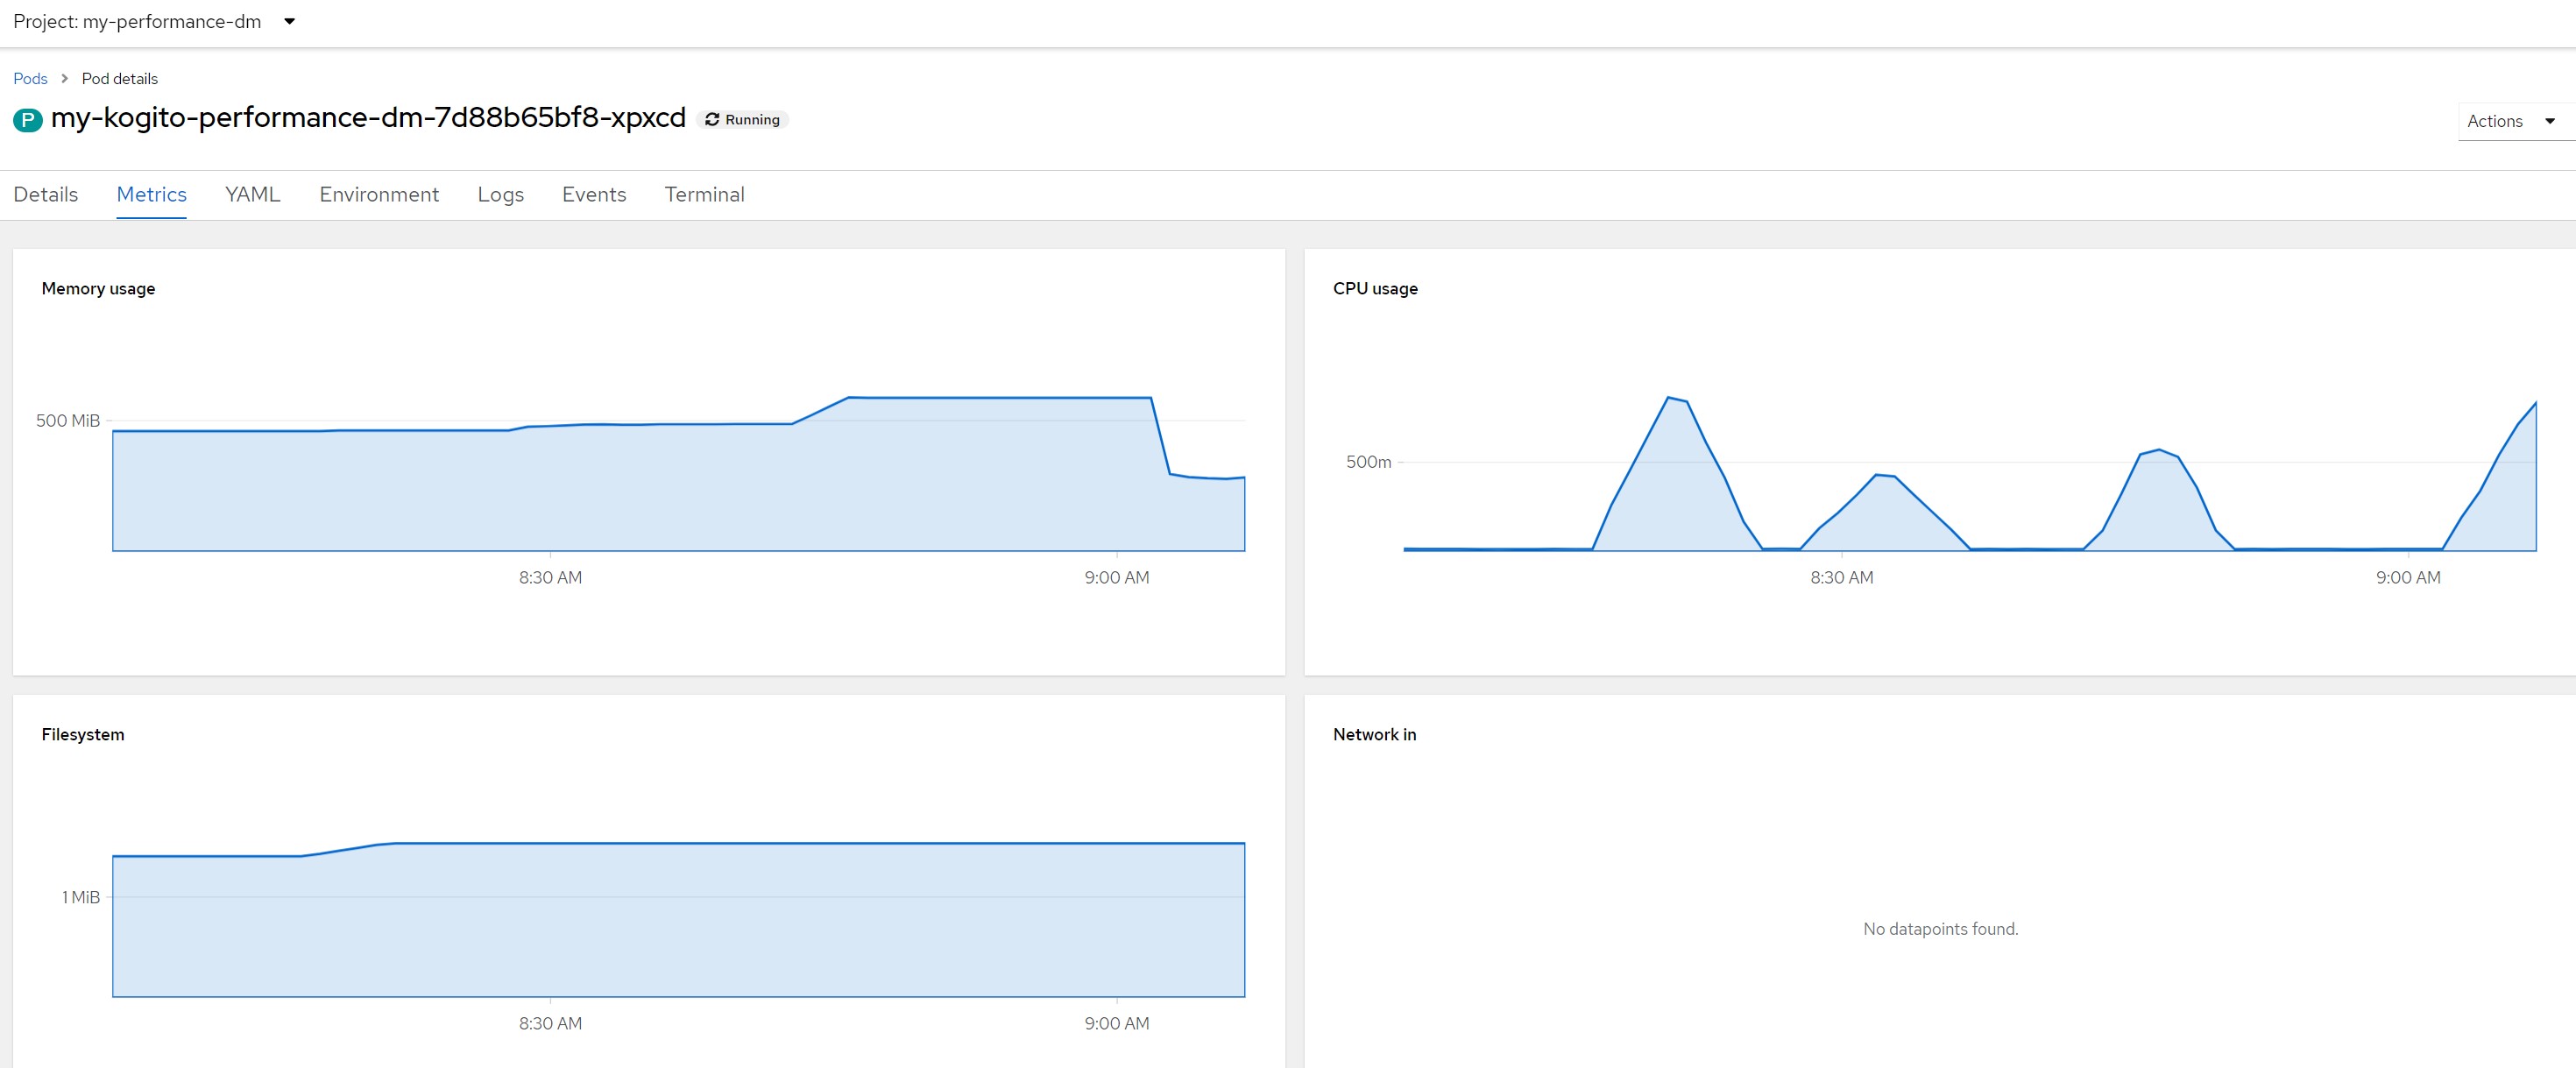
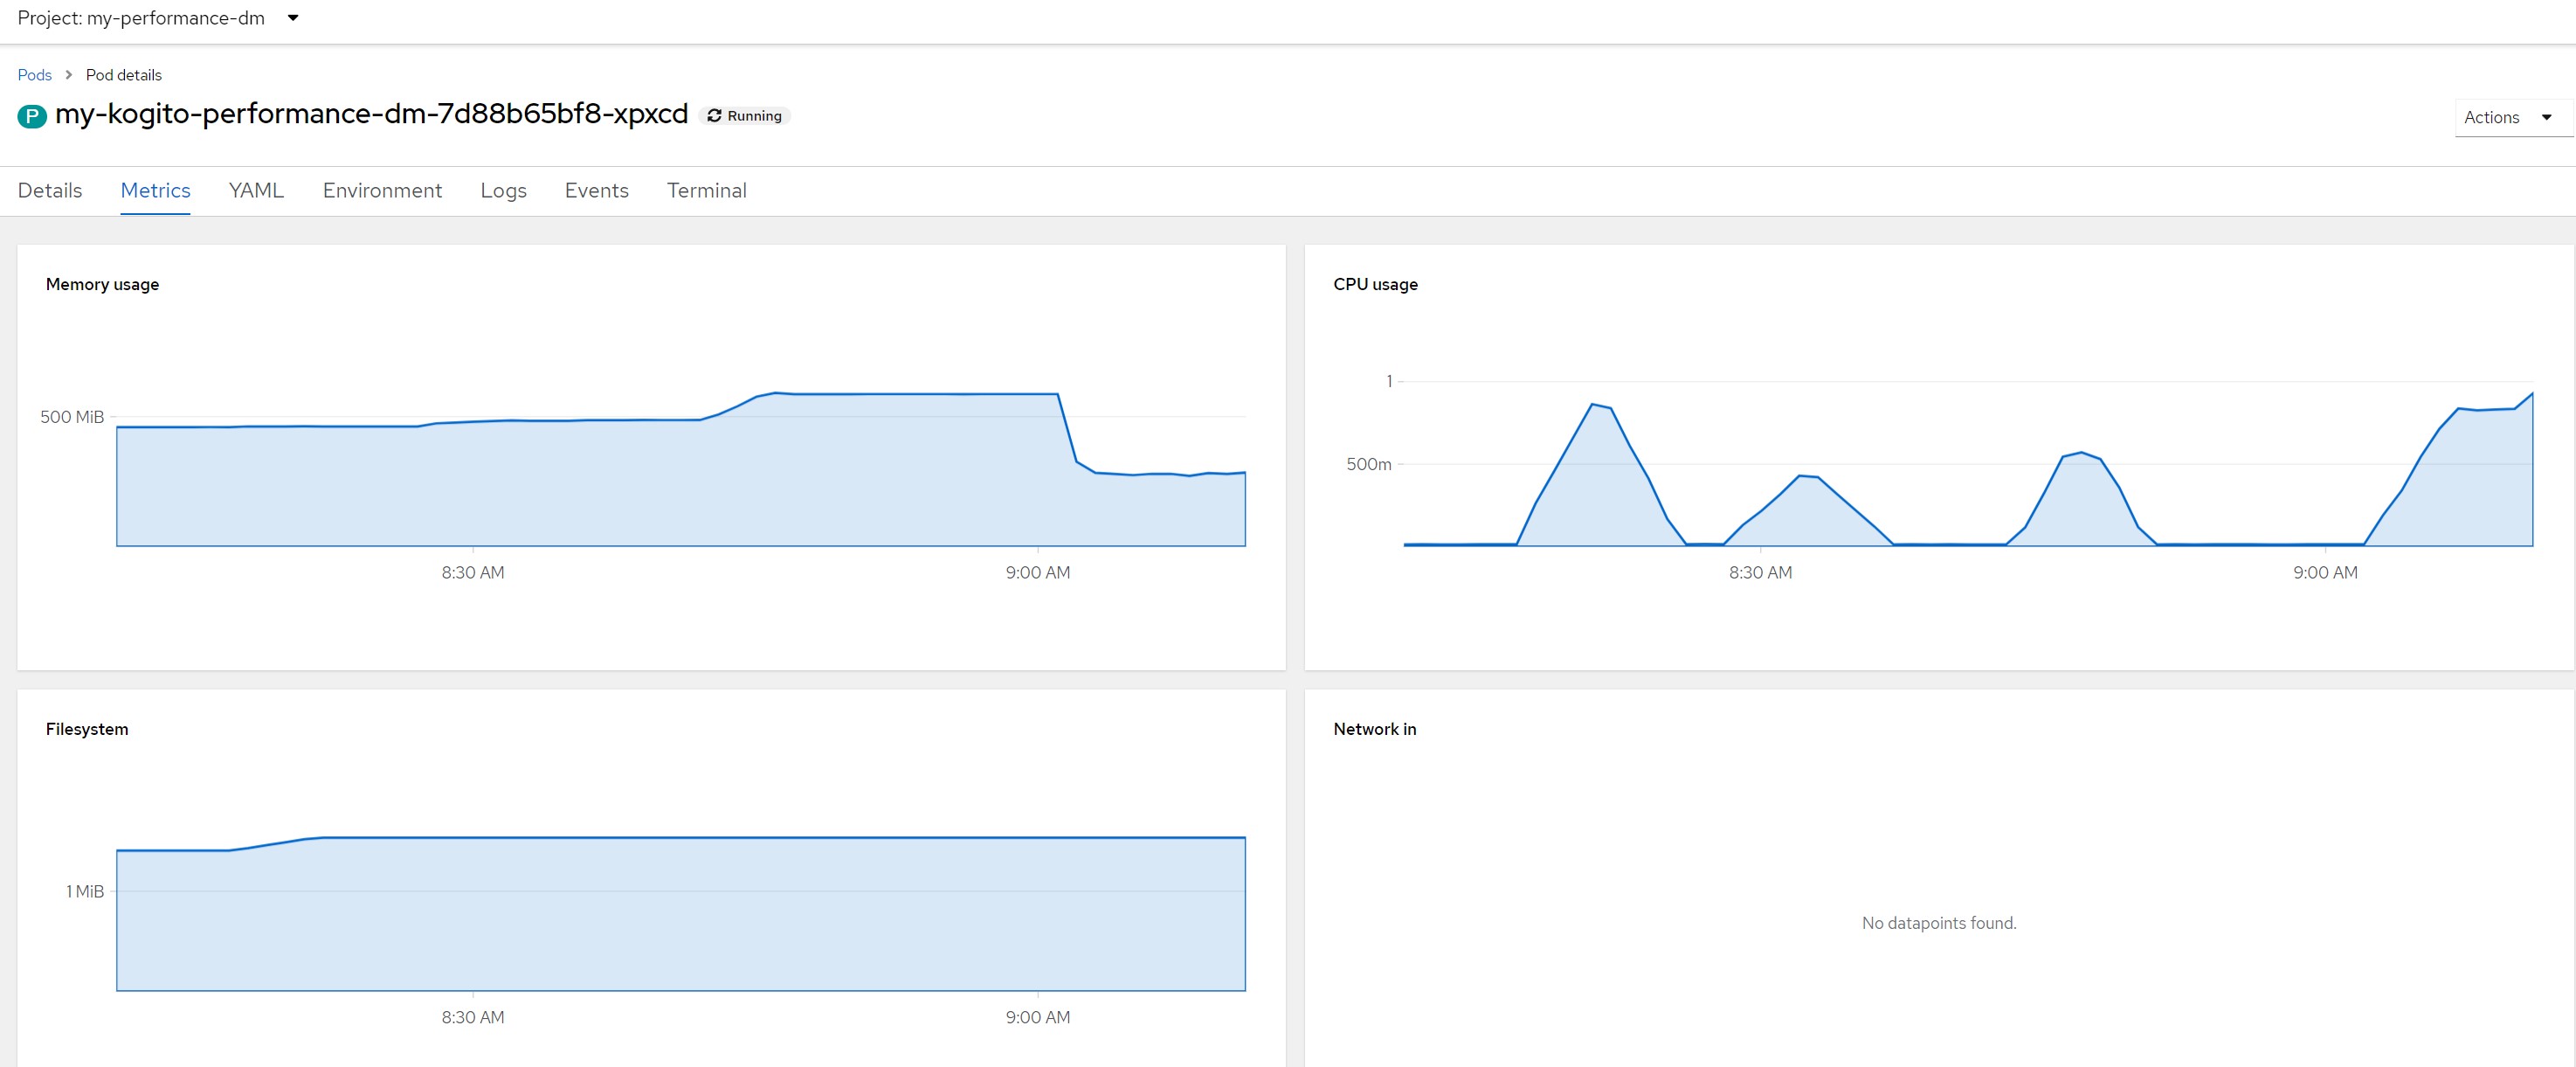
Remarks for scenario 1Pod metrics overall
CPU in last 5 minutes
Quantile for response times in the last minute
Number of calls in the last minute
 Considerations for scenario 1
A small payload (few passengers to reallocate), very low average response times, no saturation of resources
Scenario 2Payload for scenario 23 flights of which one canceled and two scheduled, 200 passengers booked on a canceled flight and reassigned to flights still scheduled
Remarks for scenario 2Pod metrics overall
CPU in last 5 minutes
Quantile for response times in the last minute
Number of calls in the last minute
 Considerations for scenario 2
A big payload (a lot of passengers to reallocate), very high average response times (6/7 seconds), no saturation of resources
Scenario 3Payload for scenario 3100 milliseconds of math calculations
Remarks for scenario 3Pod metrics overall
CPU in last 5 minutes
Quantile for response times in the last minute
Number of calls in the last minute
 Considerations for scenario 3
Intensive cpu consumption per 100 milliseconds, fixed response time, cpu high but no saturation of resources
Scenario 4Payload for scenario 4300 milliseconds of math calculations
Remarks for scenario 4Pod metrics overall
CPU in last 5 minutes
Quantile for response times in the last minute
Number of calls in the last minute
 Considerations for scenario 4
Intensive cpu consumption per 300 milliseconds, fixed response time, no saturation of resources
Scenario 5Payload for scenario 5simple payload made of some booleans, strings, numbers
Remarks for scenario 5Pod metrics overall
CPU in last 5 minutes
Quantile for response times in the last minute
Number of calls in the last minute (33k !!!)
 Considerations for scenario 5
Very very very low cpu consumption for each rule execution, low concurrency, no saturation of resources
Scenario 6A little bit aggressive, 500 concurrent virtual users against a single pod with limited cpu to 1.
Payload for scenario 6simple payload made of some booleans, strings, numbers
Remarks for scenario 6Pod metrics overall
CPU in last 5 minutes
Quantile for response times in the last minute
Number of calls in the last minute (some peeks over 50k !!!)
 Considerations for scenario 6
Low cpu consumption for each rule execution but very high total cpu consumption because high concurrency, no saturation of resources even if the stable cpu consumption hovered above 80%.
Scenario 7More aggressive, 1000 concurrent virtual users against a single pod with limited cpu to 1.
Payload for scenario 7simple payload made of some booleans, strings, numbers
Remarks for scenario 7Pod metrics overall
CPU in last 5 minutes
Quantile for response times in the last minute
Number of calls in the last minute (stable over 49k !!!)
 Considerations for scenario 7
Low cpu consumption for each rule execution but very high total cpu consumption because high concurrency, average response time increased, no saturation of resources even if the stable cpu consumption hovered above 90%.
Not so bad !!!
Scenario 8We wanted to be bad.
 https://en.wikipedia.org/wiki/Cattivik
Looking for the breaking point of our service ...
A mix of the above scenarios using high concurrency to reach CPU saturation
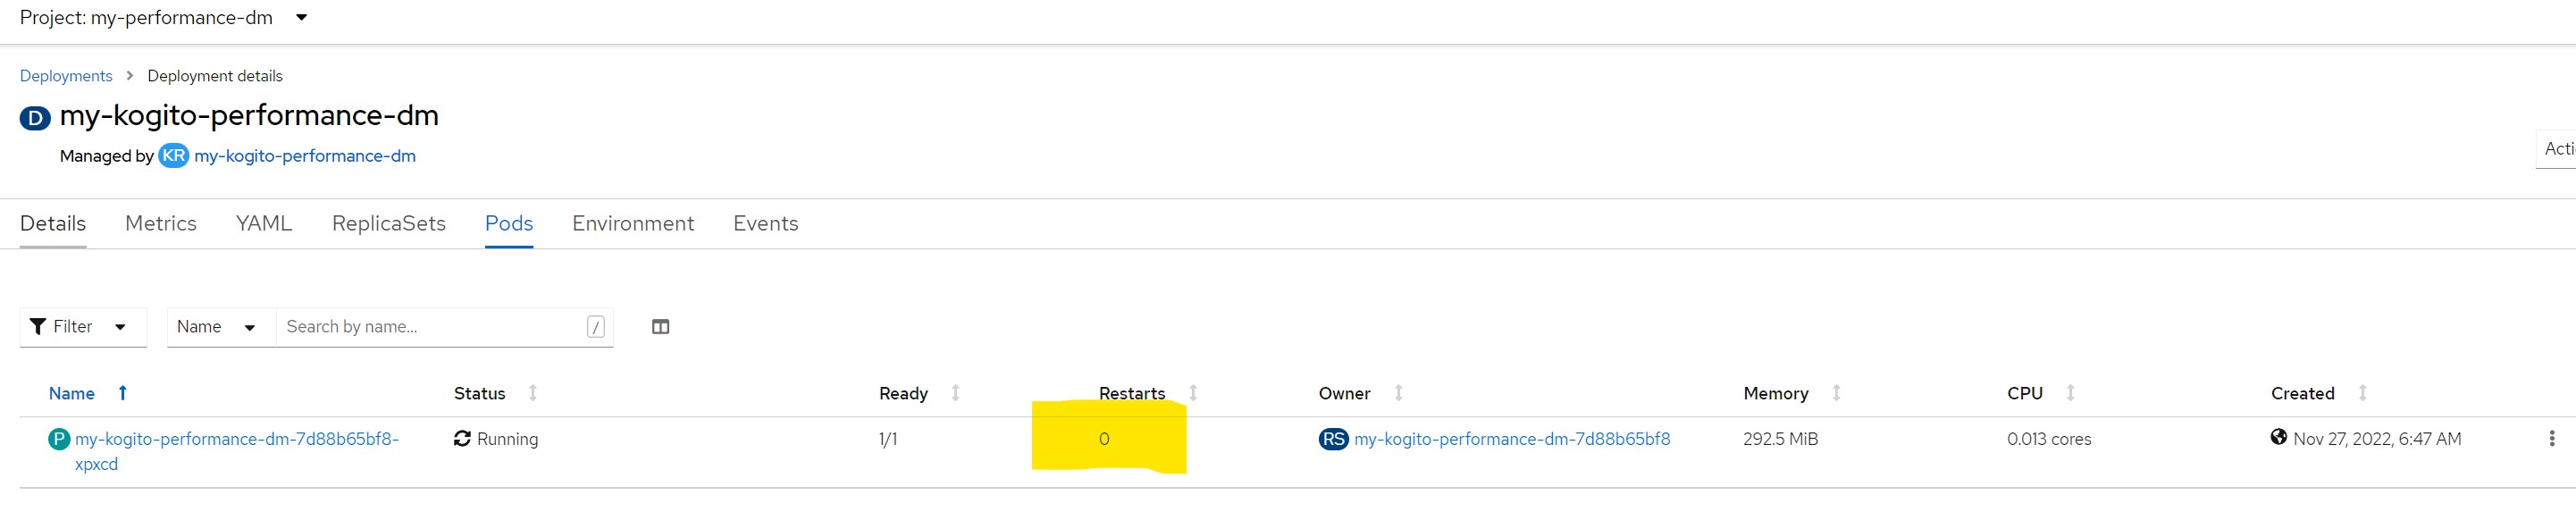
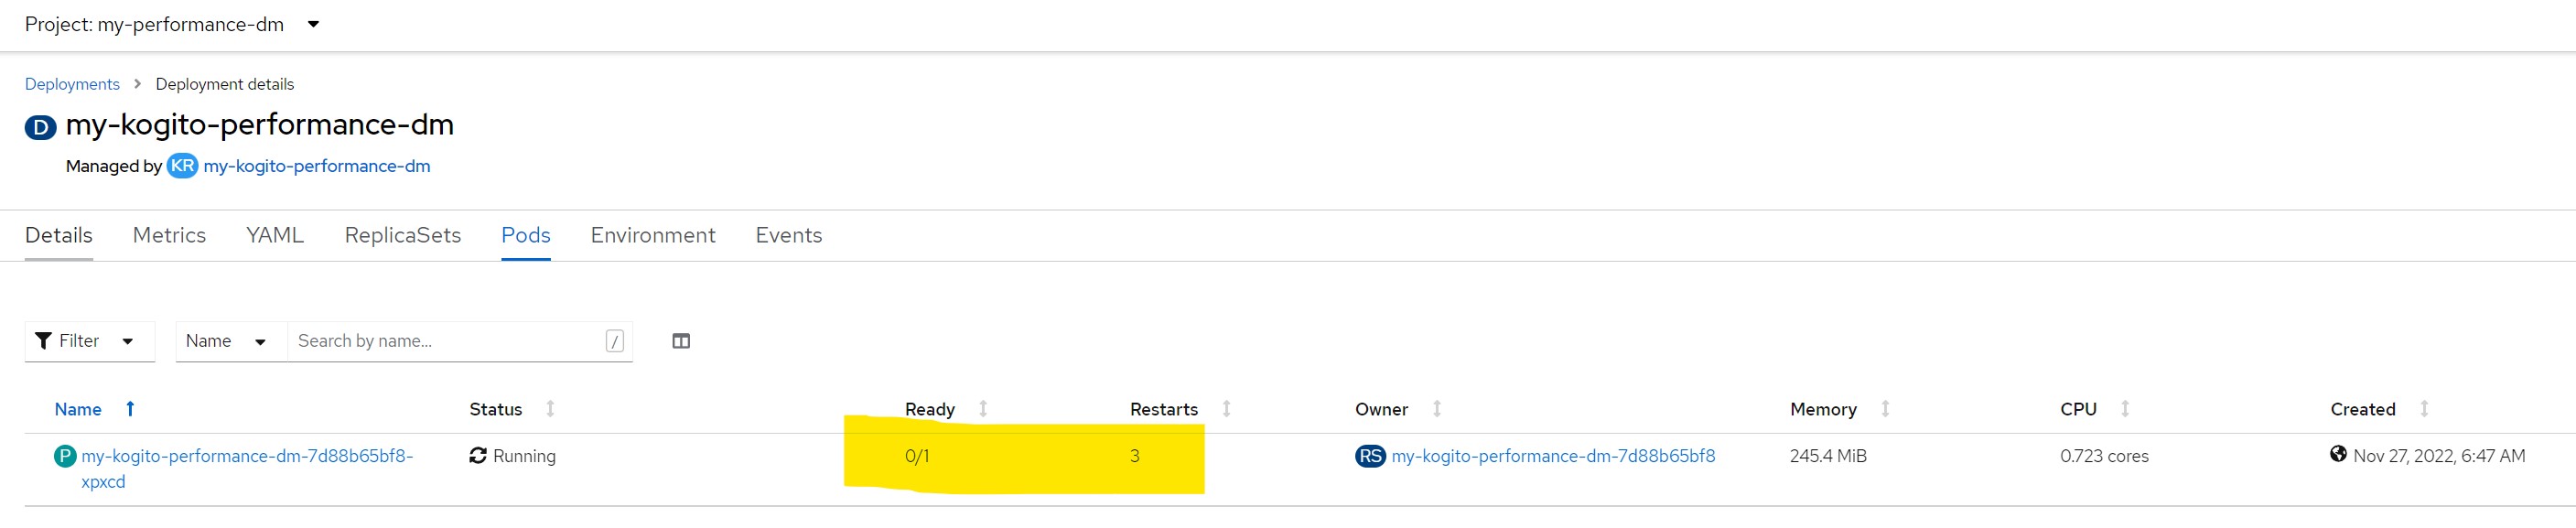
The numbers presented in this scenario have no real value as the pod worked for a relatively short time then was restarted more than once.
Before being flooded with requests (zero restarts)
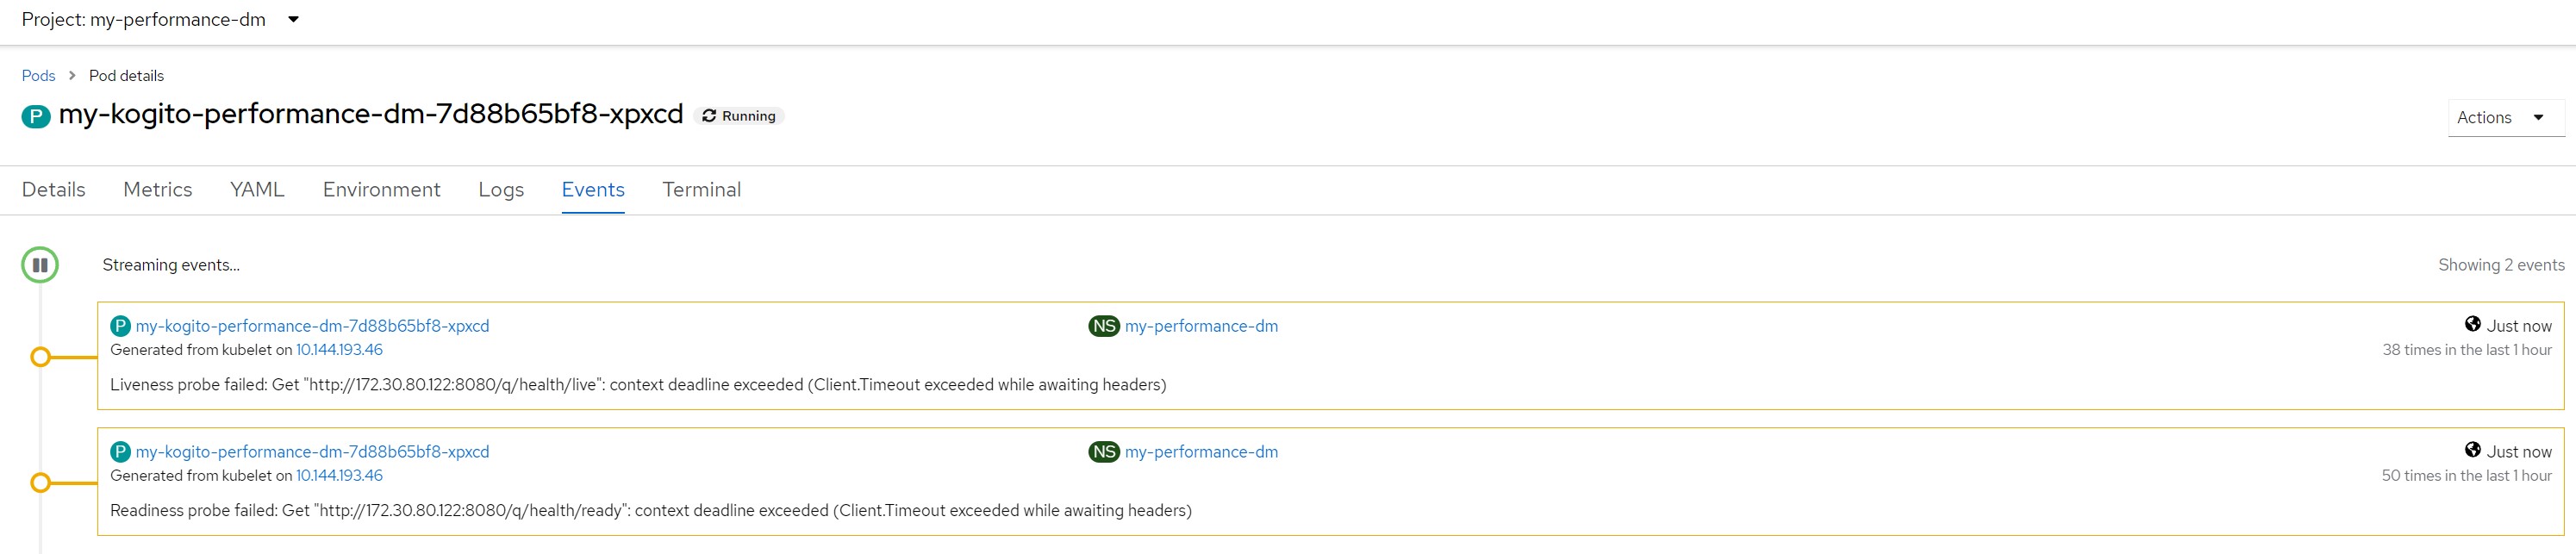
After...Probes in timeout and the pod is considered not ready/live and restarted continuously
 Remarks for scenario 8
Pod metrics overall
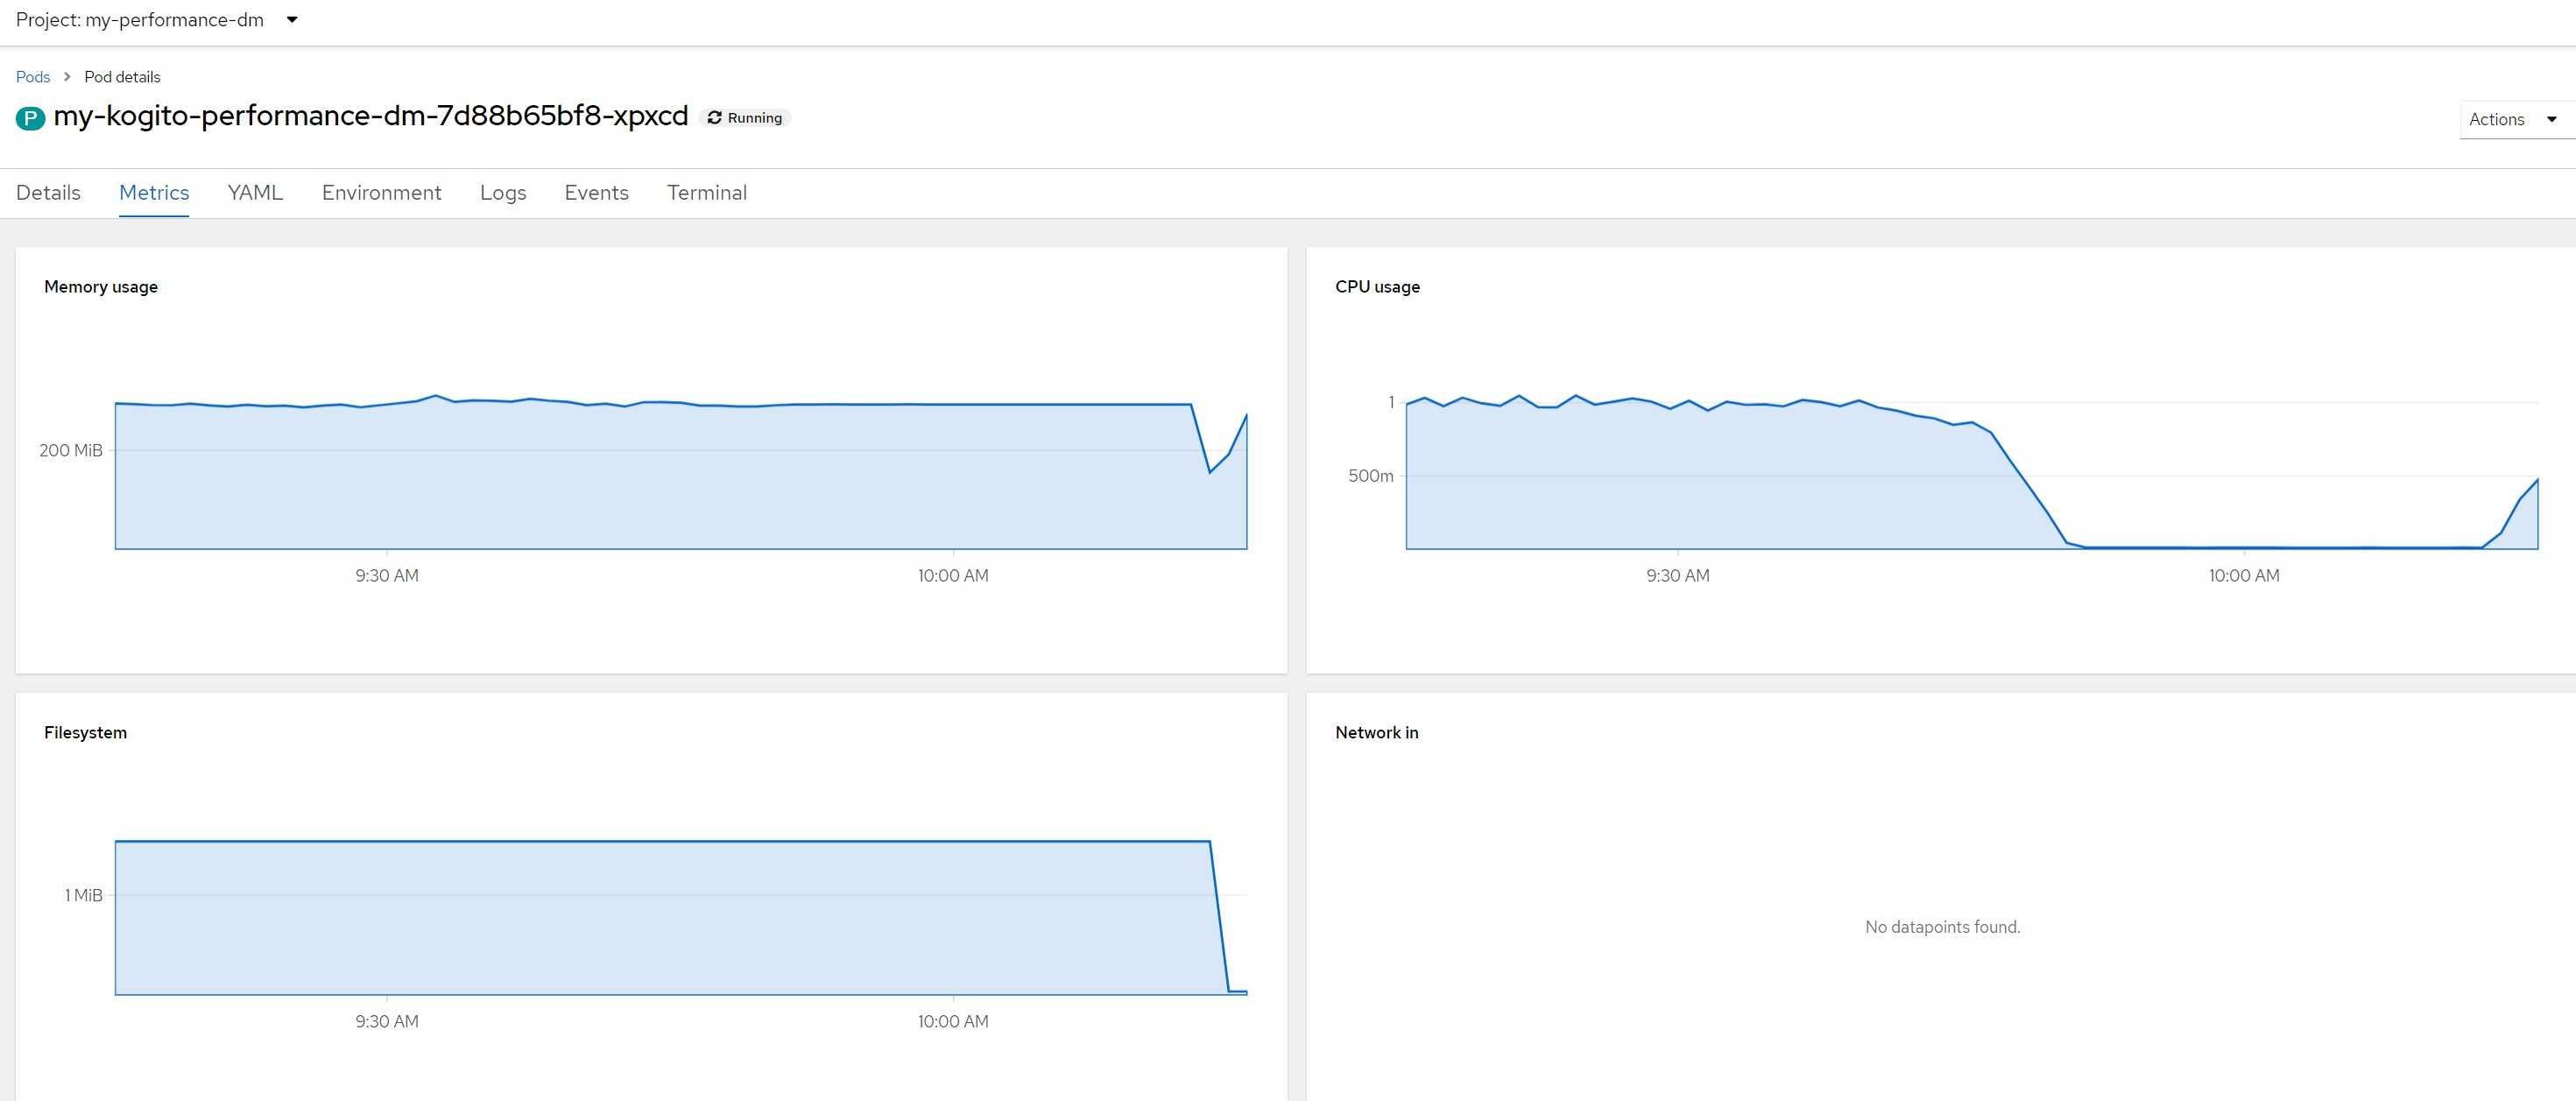
CPU in last 5 minutes
Quantile for response times in the last minute
Number of calls in the last minute
 Considerations for scenario 8
In this scenario, after a few seconds the pod became saturated with resources and the liveness probe also obtained a series of timeouts which led the OpenShift scheduler to restart the pod thus creating an out of service situation.
If you have come to this situation on your production systems… you have serious problems ;)
Benefits obtainedThrough the correct observation of the metrics and even better if with trend analysis tools it is possible to better understand the intrinsic characteristics of what is the final product generated by Kogito starting from a DMN model.
This analysis can certainly help you to better manage and govern the hardware resources necessary for compliance with the KPIs and SLAs expected from your solutions.
Capacity planning and sizingThe argument of capacity planning and the anticipated sizing of the necessary resources has always been difficult to solve in any branch of information technology.
In my opinion, the topic must be tackled incrementally for each business milestone and must be accompanied and supported by valid observation and measurement tools which, better if in real time, allow you to react in near-real-time to impending needs.
ConclusionsIn the various scenarios we observed average response times and very heterogeneous cpu consumption. We can therefore draw some simple conclusions and say that the consumption of resources is driven by the complexity of the rule logic, by the size of the payload (list of items to be submitted to the rule as in the case of FlightRebooking), by the concurrence of activation of the rules (number of requests that overlap in time), and last but not least ... the quality of the software you will write.
"Good practices" are the best investment that can be made, Ask IBM !
Teaser: I'm thinking of writing a post on the topic of rule service observability, tracking and profiling, of course the main actor will be IBM Instana, see you soon.
 References
IBM Process Automation Manager Open Editions Documentation
https://www.ibm.com/docs/en/ibamoeIBM Business Automation Manager Open Editions Software Support Lifecycle Addendum
https://www.ibm.com/support/pages/node/6596913https://www.ibm.com/support/pages/node/6830111KieGroup
https://github.com/kiegroup/kogito-operator/releaseshttps://raw.githubusercontent.com/kiegroup/kogito-images/main/kogito-imagestream.yamlKogito
https://kogito.kie.org/https://kogito.kie.org/get-started/Quarkus
https://quarkus.iohttps://quarkus.io/get-started/Previous posts related to this topic
https://community.ibm.com/community/user/automation/search?executeSearch=true&SearchTerm=antonioniResourcesGitHub repo used in this post
https://github.com/marcoantonioni/IBM-BAM-OE-demosPayloads
https://raw.githubusercontent.com/marcoantonioni/IBM-BAM-OE-demos/main/stuffs/payloadhttps://raw.githubusercontent.com/marcoantonioni/IBM-BAM-OE-demos/main/stuffs/payload-bighttps://raw.githubusercontent.com/marcoantonioni/IBM-BAM-OE-demos/main/stuffs/payload-small