♦ Applies to: Apptio TBM Studio R12.x
In this article:
Introduction
This document describes how to view the "data path" of Apptio reporting elements (for example tables, graphs, and KPIs). The data path of a component describes what tables are being used and how. This can be very useful for determining the source of problems with configuration, or even problems with performance of a component.
You can view the data path in production reports without having to be in TBM Studio, and you can do it before a table has fully loaded. This is handy when debugging performance issues. If a table on a report is taking a long time to load you may be able to determine why, or at least where the source of the problem might be, by examining the model tables the report table is using.
Accessing Show Full Data Path
Accessing Show Full Data Path depends on the type of element as follows.
Tables
If a table has a drop-down configured, you can use that to access Show Full Data Path as shown here.
Click on the drop-down...

...and select Show Full Data Path.

If a table does not have drop-down configured, you can still access Show Full Data Path by right-clicking on one of the regions highlighted in yellow in the following screen shot.
Right click on one of the regions highlighted in yellow...

...and select Show Full Data Path.

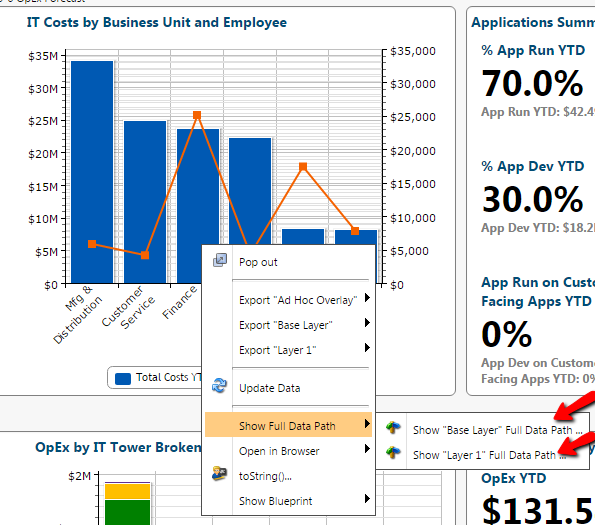
Charts
On charts you simply right-click anywhere on the chart and select Show Full Data Path.
KPIs
Similar to charts, right-click anywhere on a KPI and select Show Full Data Path.

Reading a Data Path
This section describes how to interpret the data path and provides a few dissections.
All datapaths follow the same basic structure:
<Domain Name>:<Project Name>/
<A combination of Folders and Date/Time Specifications>/
<Report view names>/
<Table functions (They can only go here sometimes)>/
<Table name>/
<Table Functions>/
The “/” indicates the end of a line. The data path is theoretically smart enough to detect the end of a line based on context, but to be safe, include the slashes.
Here is an annotated example:
| Data Path Code |
Description/ Comments |
| templates.apptio.com:Canonical/ |
The domain name is "templates.apptio.com.
The project name is "Canonical".
|
| Reports/ |
Top level folder in the project. |
| .DateGoesHere/ |
Inserts the currently selected time period. |
| CostModels/ |
Indicates the component is in a cost model. |
| Default/ |
Indicates the component is in the Default cost model. |
| Storage/ |
Indicates the name of the object in the model. |
| .View:Compare Cost to Budget/ |
Report view name. |
| .Summary/ |
Name of the table containing the data used to generate the component. In this example, .Summary is a table name. .Summary is the table most report components analyze. Other common tables are .Drivers and .LineItems. There are other tables in the product as well. For information on these tables, look up Hidden Apptio tables.
|
| !NEWCOLUMN[YTD Percent Over Budget=0-{YTD Percent Budget Variance}]/ |
Table function that creates a new column. Table functions always begin with the ! character. |
Dissection 1: A table with ad-hoc filters
Note that while the following image is in edit mode, the data path can be obtained without being in edit mode. In the image on the left you can see that the table has a filter applied in the ad-hoc configuration. On the right you see the complete data path for this element. With the datapath you can:
- See any configuration you could see with the ad-hoc dialog in edit mode.
- Determine the object on which a report component is based without having to be in edit mode.
- See any filters being applied including ones that are part of the ad-hoc configuration and thus not visible on the reporting surface.
- See all formulas being used to arrive at numbers in the report.
This allows you to asses how numbers in reporting are being arrived at in staging and production environments without edit mode.

Dissection 2: A table with a custom icon column
In the image on the left you can see the table filtered to records with Cost < 500000. On the right you see the complete data path for this element. Note that similar to the last dissection you can see all formulas being used to arrive at numbers in the report are shown including the logic for the Period Over Period Trend icon column and the Current FY Plan Variance Trend sparkline. Therefore, if trend arrow icons were suspect you could use the online help on the Icon() function in conjunction with the values specified to help validate the arrow integrity.
You can also see all filters being applied including the Employee Type slicer selection of “External Labor” and the “<500000” in the auto search filter. This allows you to assess whether there are filters being applied which aren’t obvious and what logic or calculations are being applied in the reporting surface.

Dissection 3: A table doing a drill through the model
In the image on the left you can see a table which describes cost by cost pool for any given service. This is a .DrillTo table. You can observe the objects being drilled between, the fact that it is a .DrillTo report, and the metric being used. This can be significant in that a .DrillTo implies more calculation time than a simple .Summary table as in the last example.


Dissection 4: A table which is “calculating …” and is crafted in a way that may be inefficient
In the image on the left you can see a table which describes cost by cost pool for any given service similar to the last dissection. One of the key things to note here is that the data path is available even before the table is fully loaded. This allows you to assess an element that may not be performing well while it is still loading. The top object in the drill is Business Services and the bottom object is Cost Source. However, the slicer on the right is filtering by IT Resource Tower Name which creates a 3 object drill which can be very expensive in terms of calculation time. In addition, the table is configured to show both Cost and Budget metrics so the drill is occurring through both models. Depending on the configuration of the models involved this can be a VERY expensive report to calculate.


This article is open for your feedback. At the bottom of this page, click Add a comment.