Column pickers can be handy in reports, but they can also have a performance impact when not configured correctly. This tip provides recommendations for configuration of pickers to optimize their performance in Apptio reports.
If you don't know what a column picker is you can read the Column picker documentation.
Also, in this tip we leverage examination of the data path to understand what is going on. Therefore, if you haven't already read Use "Show full data path ..." it would be a good idea to do that.
Clues that you might have a column picker issue
Not every column picker presents an issue and even large ones can be used with minimal performance impact depending on the situation. Things to look for are pickers that have more than a few choices. If you see a picker that requires a scroll bar to see all the choices, that's a sign that it should be examined as described in this article. Another thing to watch for is pickers that impact large numbers of tables.
Looking closer and taking action
The default behavior for column pickers is to add any column in the picker configuration to the grouping for any tables it impacts. This is because depending on the configuration of the tables being used in the report, having the report grouped by the column being added by the picker may be necessary for the report to display correctly and failing to do so from the outset could be very confusing to the person configuring the report.
However, when Apptio pre-calculates a report, it looks at the grouping configuration of tables and generates a key dynamically based on the table's grouping configuration. This dynamic generation of keys can be very calc-intensive. Because columns in a column picker are added to grouping by default, this can degrade performance. This is especially true in situations where the table is a simple ".Summary" table and the columns are all from the same object the table is based on. Grouping in such cases can be very wasteful.
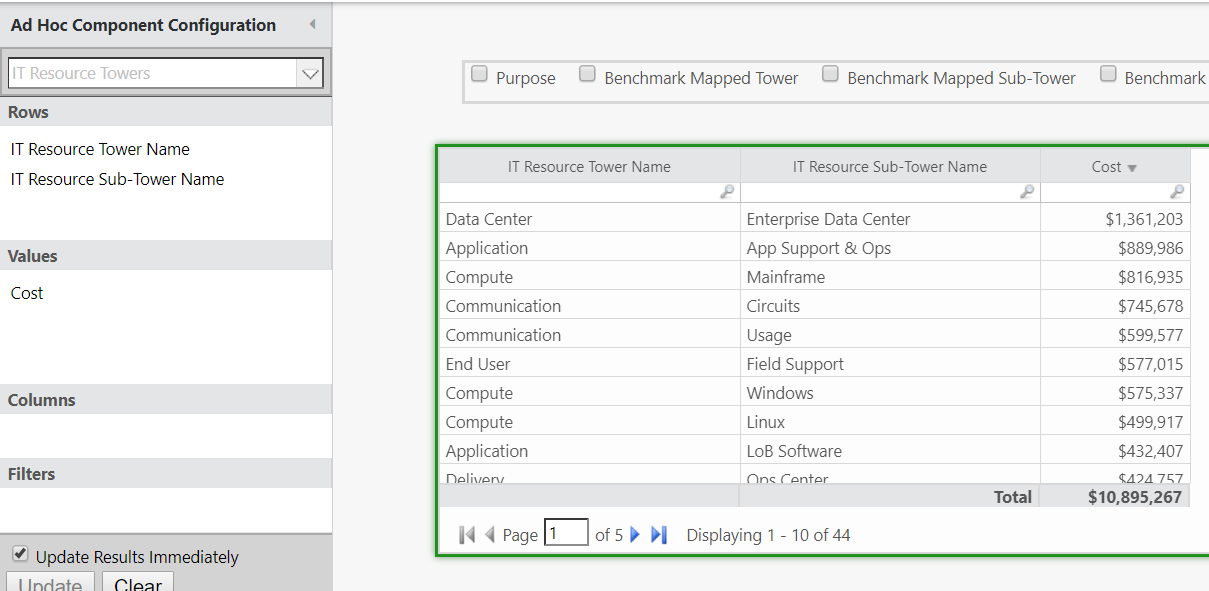
Here is an example: In the following report we have a simple table based on IT Resource Towers and a column picker at the top. The columns in the picker are the Purpose, Benchmark Mapped Tower, and Benchmark Mapped Sub-Tower from the IT Resource Towers object, and the Benchmark metric based on the Benchmark model.

Note that the "IT Resource Tower Name" is not grouped. This is because the "IT Resource Sub Tower Name" represents the lowest necessary granularity and so we only need to group by that column name.
When none of the pickers are selected the data path looks like this:
dkelly.apptio.com:Cost Transparency Reference/
Reports/
.DateGoesHere/
CostModels/
Default/
.View:tab:Service Costing/
.View:_DK Sandbox/
.View:Column picker performance/
IT Resource Towers/
!GROUPBY[{IT Resource Sub-Tower Name}]/
.Summary/
!ALL_ROWS/
!SORT[{IT Resource Towers Master Data.IT Resource Tower Name}|asc]/
!LIMIT[0,2147483647,add_total]/
!LIMIT_COLUMNS[{IT Resource Towers Master Data.IT Resource Tower Name},{IT Resource Sub-Tower Name},{Cost}][][][orderByIncludeList]/
Now we select all the columns in the picker. With the columns selected the data path looks like this:
dkelly.apptio.com:Cost Transparency Reference/
Reports/
.DateGoesHere/
CostModels/
Default/
.View:tab:Service Costing/
.View:_DK Sandbox/
.View:Column picker performance/
IT Resource Towers/
!GROUPBY[{IT Resource Sub-Tower Name},{IT Resource Towers Master Data.Purpose},{IT Resource Towers Master Data.Benchmark Mapped Tower},{IT Resource Towers Master Data.Benchmark Mapped Sub-Tower}]/
.Summary/
!ALL_ROWS/
!SORT[{IT Resource Towers Master Data.IT Resource Tower Name}|asc]/
!LIMIT[0,2147483647,add_total]/
!LIMIT_COLUMNS[{IT Resource Towers Master Data.IT Resource Tower Name},{IT Resource Sub-Tower Name},{IT Resource Towers Master Data.Purpose},{IT Resource Towers Master Data.Benchmark Mapped Tower},{IT Resource Towers Master Data.Benchmark Mapped Sub-Tower},{Cost},{Benchmark}][][][orderByIncludeList]/
Note that the GROUPBY is now blown out to include all the columns in the picker that aren't metrics. When this report pre-calculates Apptio will generate a special key based on this grouping rather than simply using the "IT Resource Sub Tower Name" when it could simply use that.
In order to prevent this behavior you would do the following:
- Select the column picker.
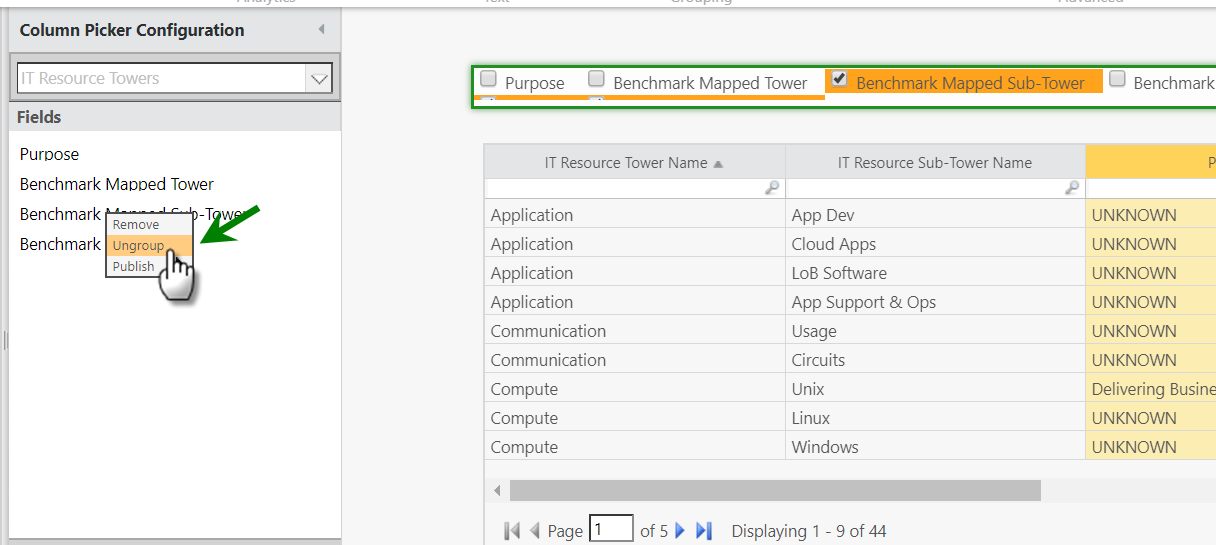
- In the ad-hoc query dialog, right-click on the first column and select "ungroup":

- Repeat for all other columns in the Column Picker Configuration dialog.
As you ungroup the columns they will be unselected in the report. That's okay, because afterwards you can re-select them without the impact to the data path.
- After ungrouping all the columns in the Column Picker Configuration dialog, re-select them on the reporting surface.
Once this is complete the data path appears as follows for the table with all the columns in the picker selected:
dkelly.apptio.com:Cost Transparency Reference/
Reports/
.DateGoesHere/
CostModels/
Default/
.View:tab:Service Costing/
.View:_DK Sandbox/
.View:Column picker performance/
IT Resource Towers/
!GROUPBY[{IT Resource Sub-Tower Name}]/
.Summary/
!ALL_ROWS/
!SORT[{IT Resource Towers Master Data.IT Resource Tower Name}|asc]/
!LIMIT[0,2147483647,add_total]/
!LIMIT_COLUMNS[{IT Resource Towers Master Data.IT Resource Tower Name},{IT Resource Sub-Tower Name},{IT Resource Towers Master Data.Purpose},{IT Resource Towers Master Data.Benchmark Mapped Tower},{IT Resource Towers Master Data.Benchmark Mapped Sub-Tower},{Cost},{Benchmark}][][][orderByIncludeList]/
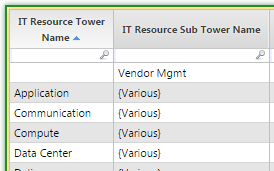
As you examine this for your own reports you may find that you do need to group some columns. For example, if you ungroup a column and you see "{Various}" in table values as in the screen shot below, that is a sign you may need to continue to group by that column.

The key is to only group what must be grouped.
Finally, some older versions of Apptio may not display values in columns added via a picker for reports trended in specific ways (e.g. multi-year trends). If you find that is the case, consult with your CSM or CSE about upgrading.