Co-Authors
 Padmini K
 Vijesh Solomon
 Vipin Menon
What is IBM Observability by Instana?
One of the advantages of AIOps is to find and troubleshoot problematic requests and services. IBM Observability by Instana automatically detects changes, issues and incidents to help you understand the quality of services and investigate service issues of your applications. Instana provides different monitoring capabilities for IBM Infrastructure and middleware components (e.g., IBM Db2, IBM J9, IBM MQ).
Instana collects data from monitored systems by using a single agent on each host. The agent runs on your host, collecting and aggregating data from various sensors, before sending it to the Instana server.
In the case of IBM Db2 LUW, the monitoring is done remotely. This means the agent resides on a remote machine and it connects to the Db2 Server with the credentials passed into the agent configuration file. This configuration helps the agent to collect the data from any host remotely without running on the respective monitoring system.
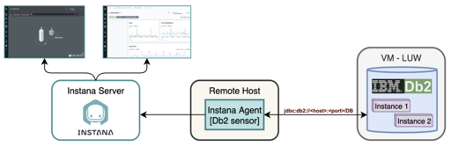 Figure 1
Installation
The details of installation of Db2 on Linux and Unix can be found here.
Configuration
As shown in Fig: 2, the fields containing the port, database name, user and password need to be configured in the agent configuration file located at
<agent_install_dir>/etc/instana/configuration.yaml . The configured remote Db2 instance will then be shown as a separate block on the Instana GUI in the specified availability zone.
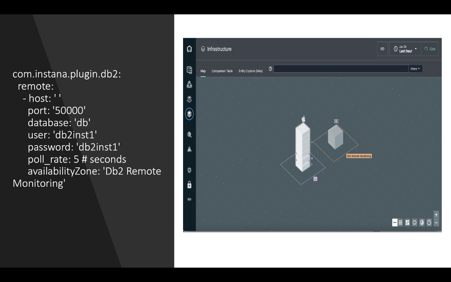 Figure 2
For IBM Db2 LUW monitoring , Instana collects the following metrics:
- Top/Long Running Queries: Returns the longest running SQL statements in the currently- connected database, such as Application Handle, Application Name, Client Application Name, Activity State, Activity Type, Elapsed Time, etc.
- DB Configurations: Returns the values of individual entries in a specific database configuration file such as Configuration parameter name, Deferred value, value flags, etc.
- DBM Configurations: Returns the values of individual entries in the database manager configuration file such as Configuration parameter name, Deferred value, value flags, etc.
- Top Total CPU (MON_GET_PKG_CACHE): This allows the user to examine the aggregated metrics for a particular SQL statement, such as Executables ID, Percentage of total rows read and total CPU time, statement execution time, etc. With these metrics, you can quickly determine the reasons for poor query performance.
- Runtime Stats: Runstats is a utility in Db2 that is used to collect statistics about the data in Db2 tables and indexes such as Object Name, object Name qualifier, Start time, end time, duration, etc.
- DB Utility: Retrieves information of all active utilities on all members using the MON_GET_UTILITY table such as Application Name, Application Handle, Utility Operation Type, Object Type, Utility start time, utility type, utility detail, etc.
Fig:3 below shows a sample screen shot of Db2 metrics monitored by Instana.
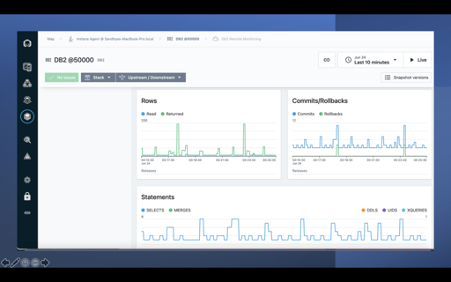 Figure 3
Problem scenarios and Solutions
Analysing lock wait mechanism by using Instana
Problem Statement: A locking mechanism is a way to analyse the failure in the applications to complete tasks, or a slowdown in the performance of queries due to locks. However, the ideal objective is to have no lock timeouts, lock wait or deadlocks on a database system, which result in applications failing to complete their tasks. Excessive lock wait periods have a threat of turning into lock timeouts, which prevent an application from completing its tasks.
Solution: It is important to monitor the lock timeout, lock wait and dead locking events at all times. Instana captures a lot of information about activities happening in the application. The lock wait, deadlock and lock timeouts in Db2 are reported by Instana Observability, which is the real-time monitoring, and helps to manage concurrency control.
To manage the Quality of Service of any applications, Instana helps to detect different events like Incidents, Issues and Changes. Fig: 4 shows an example of how to register an incident.
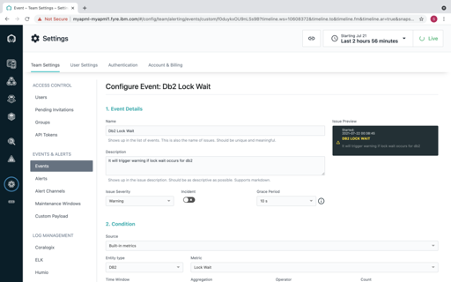 Figure 4
Instana reports these issues by providing the start time, end time, severity and the instance where the DB2 server is running. After going to the Events view of Instana GUI, you can choose between "Incidents", "Issues", "Changes" and "All" tabs to see corresponding event types. By clicking on one or selecting multiple bars in the events bar chart at the top, events table will list only the events, which are included in the selected bars. This allows detailed inspection of events without changing the current time interval. These monitored and reported issues will help you take necessary actions. Fig: 5, Fig: 6 and Fig: 7 show the triggered events and the details of the events, respectively.
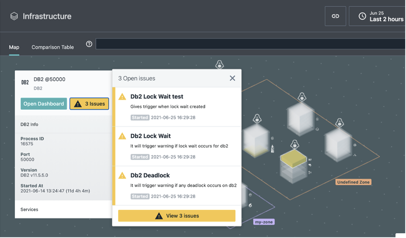 Figure 5
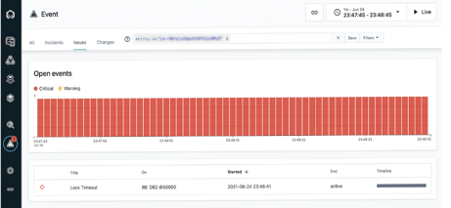 Figure 6
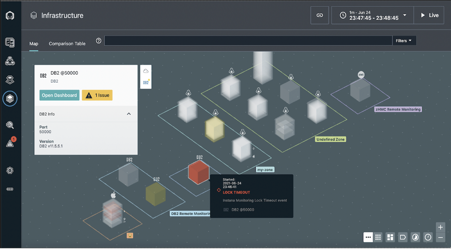 Figure 7
Identify which application transaction was consuming transaction log space
Problem Statement: One important aspect of all databases is the transaction log. If a transaction is too large, it will consume lots of space in the transaction log. It might be possible that the log file grows to maximum size and causes the SQL error "The transaction log for database is full".
Solution: Instana helps to get the root cause quickly and resolve the performance problem of the transaction activity. The Fig: 8 shows the screenshot from Instana for the Db2 transaction log that is monitored. This will help us to visualise the used and available log space.
 Figure 8
IBM Observability by Instana comes with hundreds of out-of-the-box curated capabilities that are evaluated continuously against the incoming metrics and are used to raise events or incidents depending on the user impact. While Built-in events are the predefined health signatures based on integration algorithms, which help you to understand the health of your monitored system in real-time, Custom events trigger issues based on the thresholds of an individual metric of any given entity. With IBM Observability by Instana, you have a real-time view of components that impacts Db2 LUW and understand all factors to resolve issues faster. It gives your team the benefits of observability and application performance management, there by helping to achieve the main goal of simplifying Db2 LUW service quality monitoring.
References
https://www.instana.com/supported-technologies/db2-monitoring/
https://www.instana.com/docs/self_hosted_instana/
https://www.instana.com/docs/setup_and_manage/host_agent/on/linux/
#Instana#installation#configuration#observability#how-to#Database